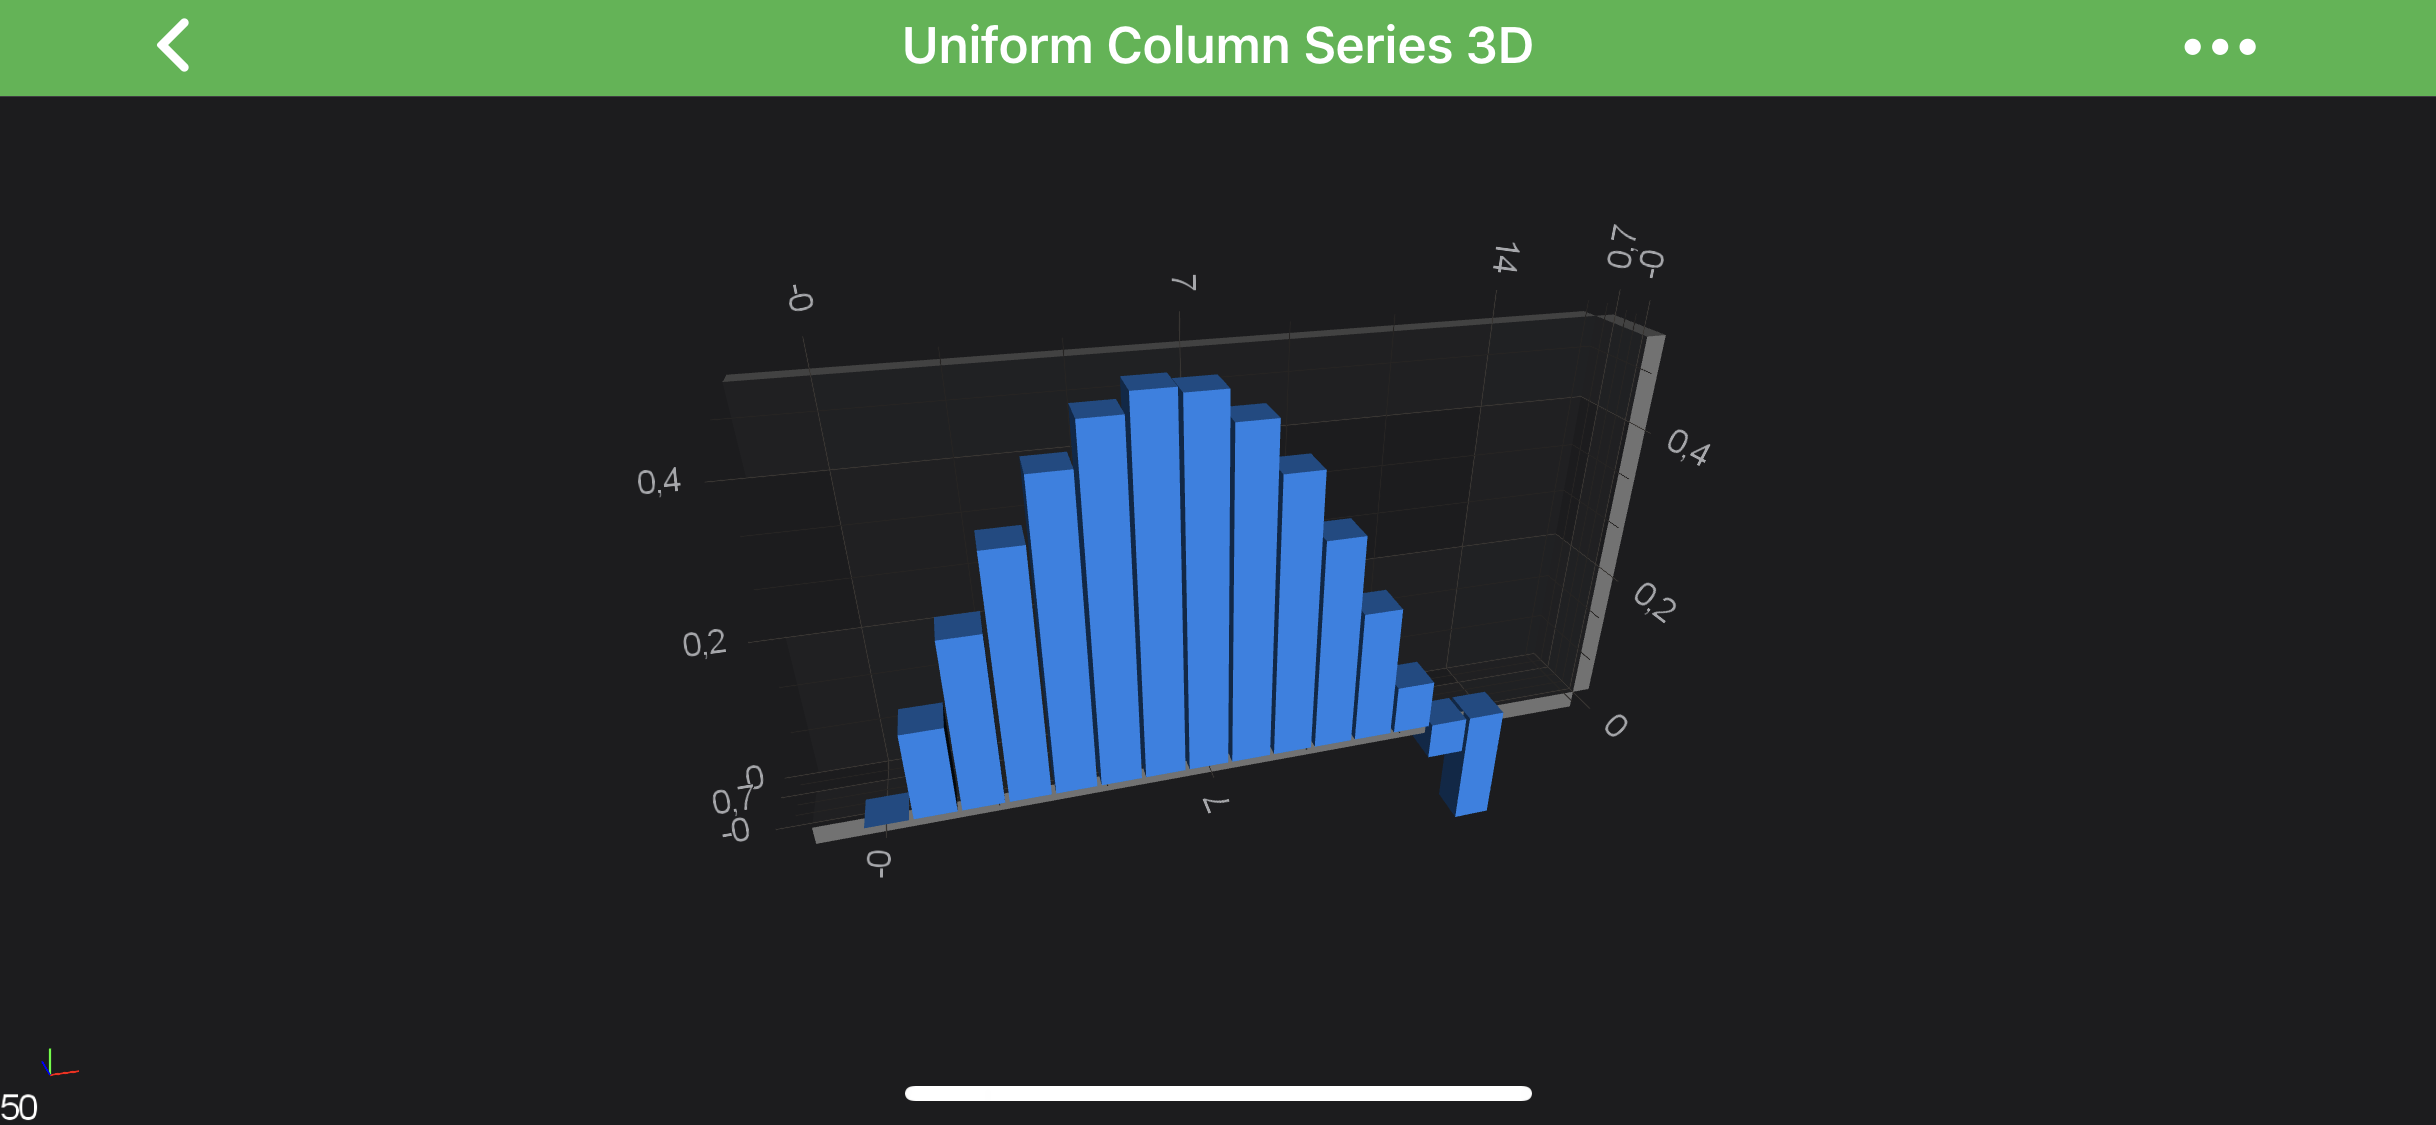
allows to specify whether the column size should be fixed or max available while not overlapping with each other. Expects SCIColumnSpacingMode enumeration.
private let Count = 15;
…
let xAxis = SCINumericAxis3D()
xAxis.growBy = SCIDoubleRange(min: 0.1, max: 0.1)
let yAxis = SCINumericAxis3D()
yAxis.growBy = SCIDoubleRange(min: 0.1, max: 0.1)
yAxis.visibleRange = SCIDoubleRange(min: 0.0, max: 0.5)
let zAxis = SCINumericAxis3D()
zAxis.growBy = SCIDoubleRange(min: 0.1, max: 0.1)
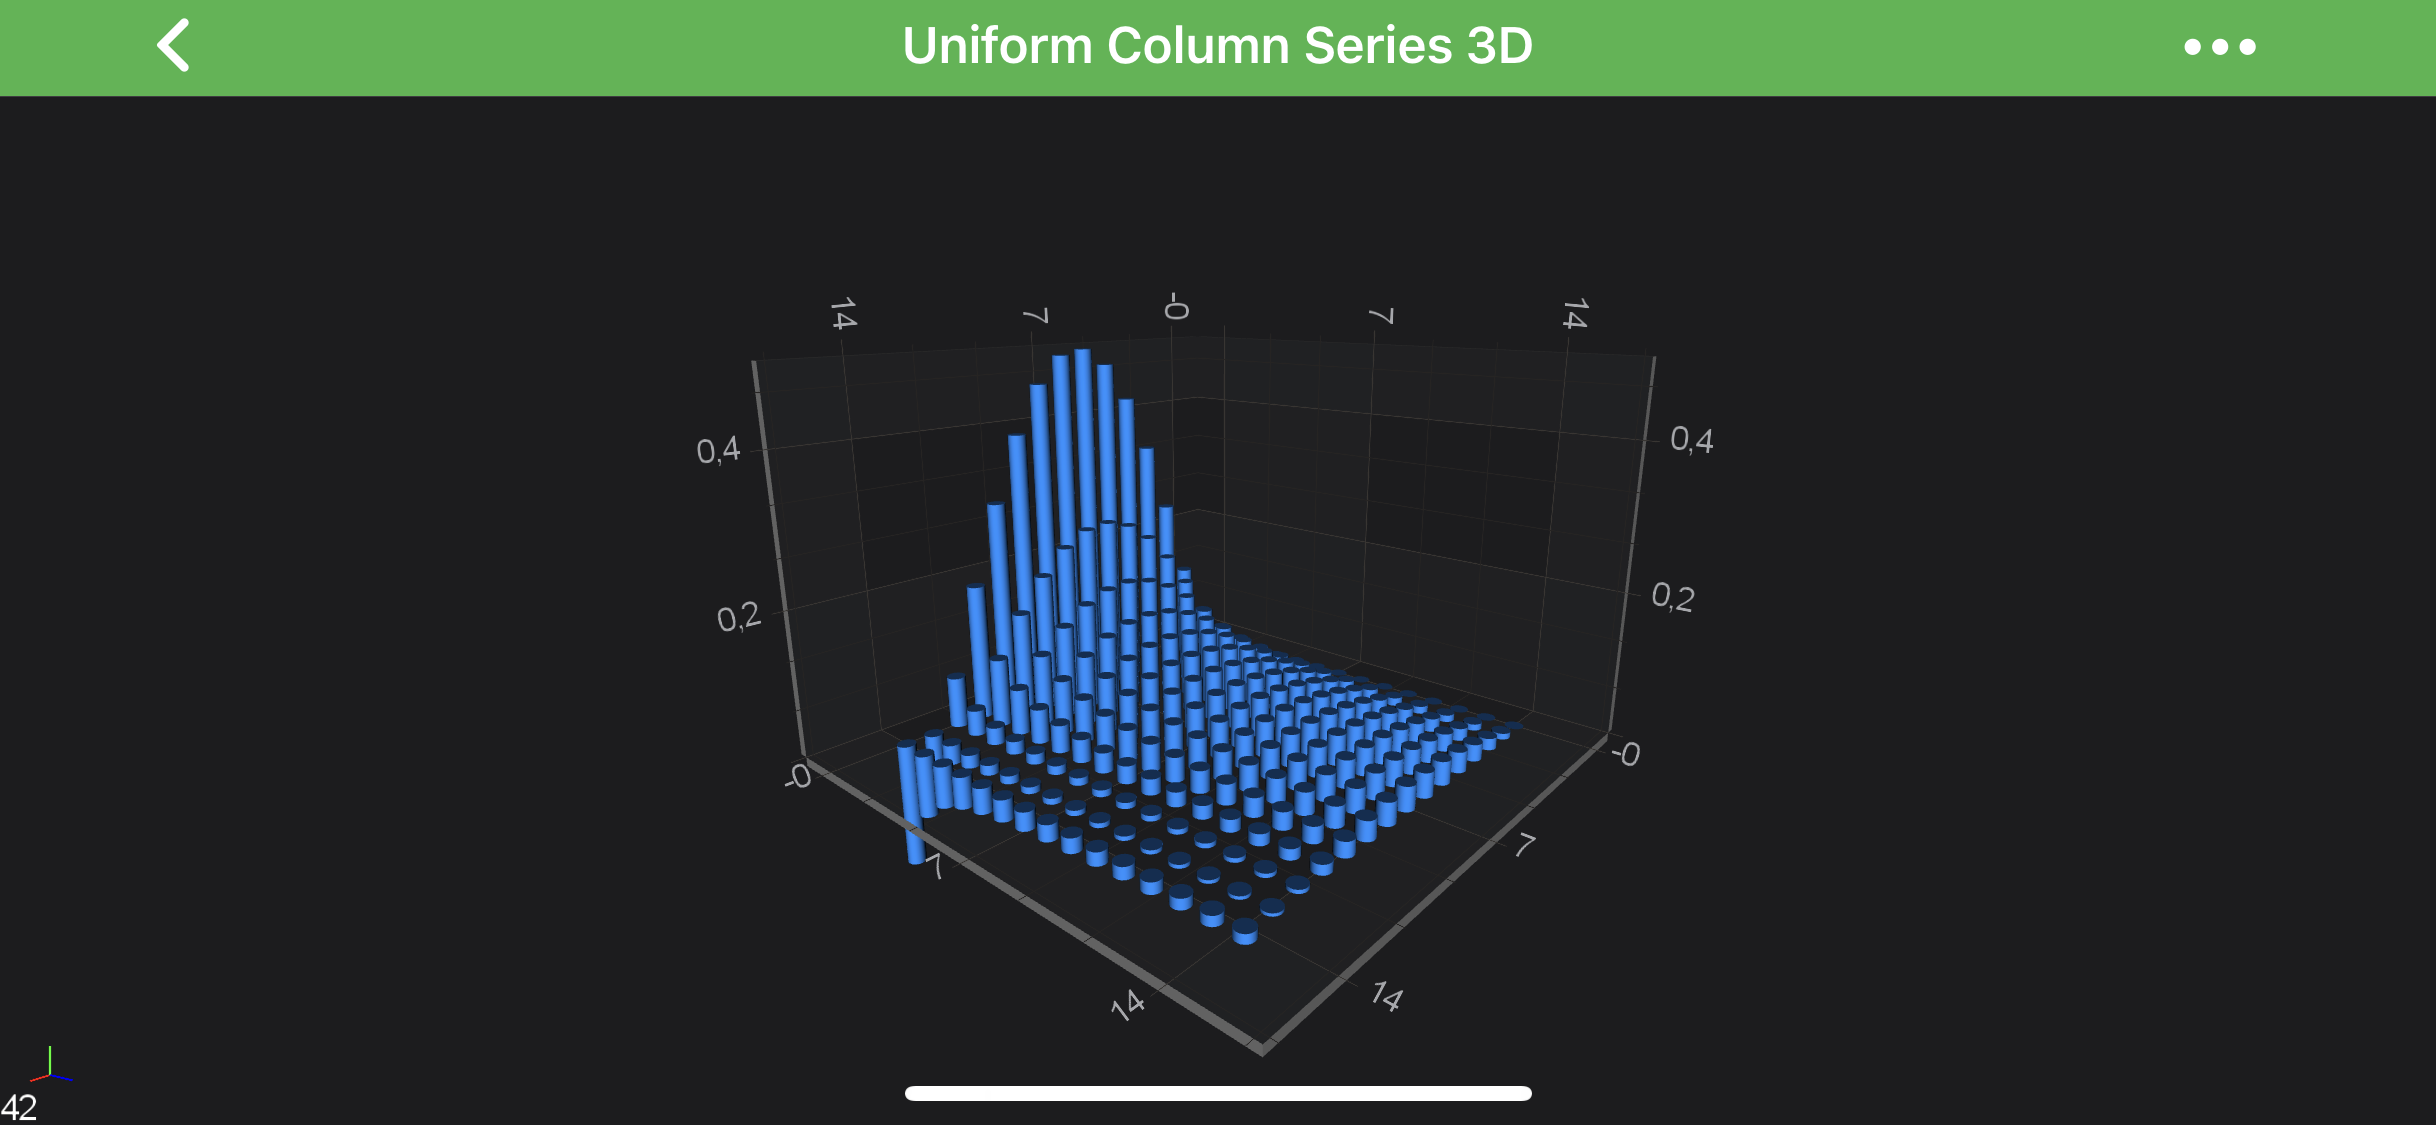
let ds = SCIUniformGridDataSeries3D(xType: .double, yType: .double, zType: .double, xSize: Count, zSize: Count)
for x in 0 ..< Count {
for z in 0 ..< Count {
let y = sin(Double(x) * 0.25) / Double((z + 1) * 2)
ds.update(y: y, atX: x, z: z)
}
}
let rs = SCIColumnRenderableSeries3D()
rs.dataSeries = ds
rs.fillColor = 0xFF1E90FF
SCIUpdateSuspender.usingWith(surface) {
self.surface.xAxis = xAxis
self.surface.yAxis = yAxis
self.surface.zAxis = zAxis
self.surface.renderableSeries.add(rs)
self.surface.chartModifiers.add(ExampleViewBase.createDefault3DModifiers())
}
const int count = 15;
var dataSeries3D = new UniformGridDataSeries3D<double, double, double>(count, count);
for (int x = 0; x < count; x++)
{
for (int z = 0; z < count; z++)
{
var y = Math.Sin(x * .2) / ((z + 1) * 2);
dataSeries3D.UpdateYAt(x, z, y);
}
}
var rSeries3D = new SCIColumnRenderableSeries3D
{
DataSeries = dataSeries3D,
FillColor = ColorUtil.CornflowerBlue,
};
using (Surface.SuspendUpdates())
{
Surface.XAxis = new SCINumericAxis3D { GrowBy = new SCIDoubleRange(0.1, 0.1) };
Surface.YAxis = new SCINumericAxis3D { GrowBy = new SCIDoubleRange(0.1, 0.5) };
Surface.ZAxis = new SCINumericAxis3D { GrowBy = new SCIDoubleRange(0.1, 0.1) };
Surface.RenderableSeries.Add(rSeries3D);
Surface.ChartModifiers.Add(CreateDefault3DModifiers());
}
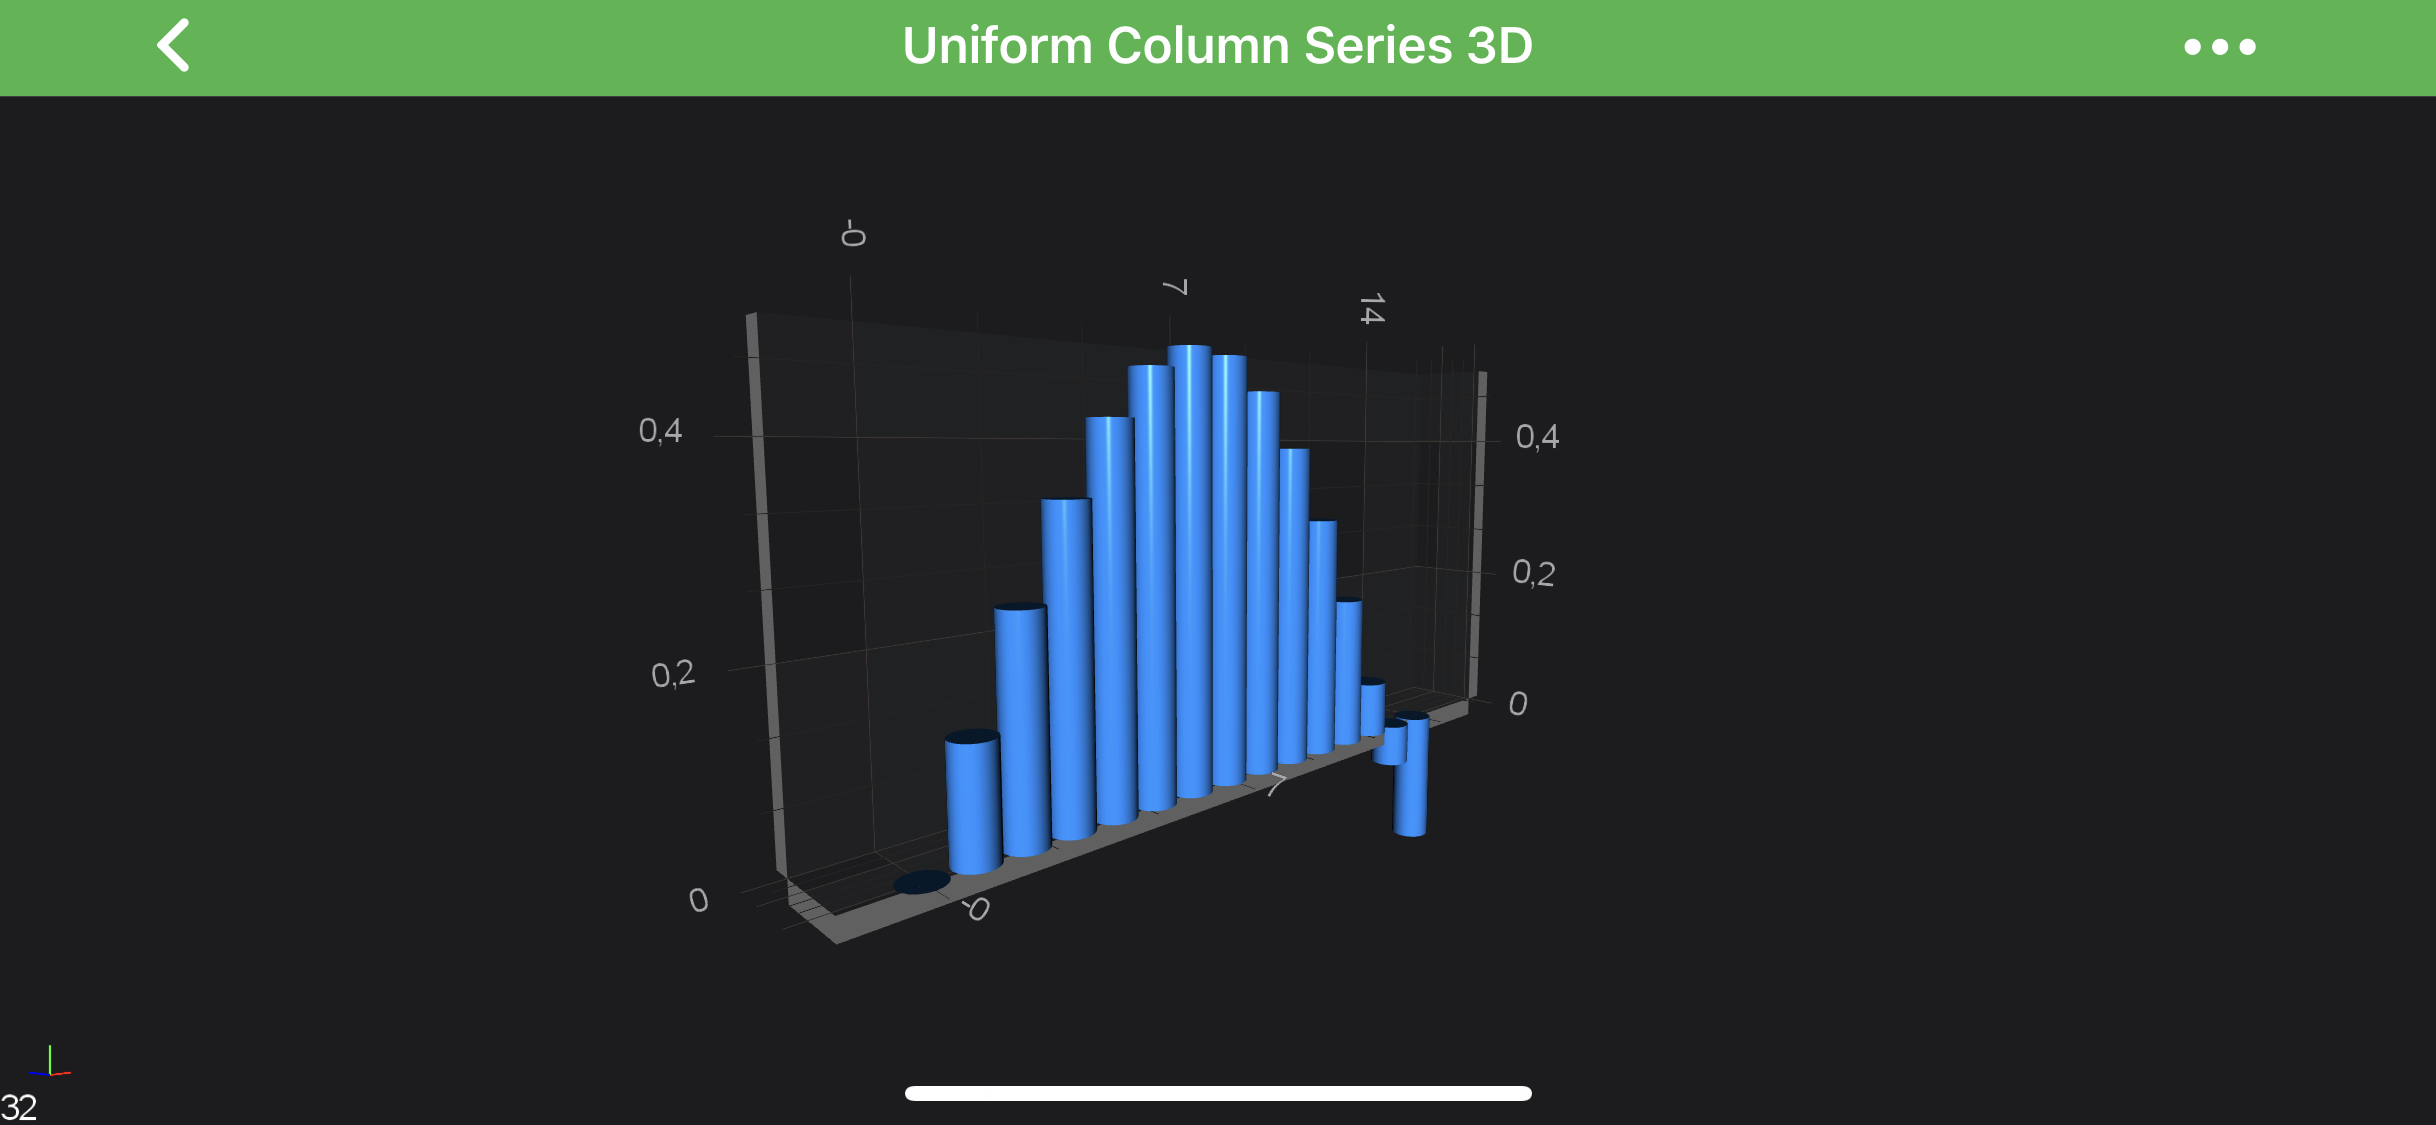
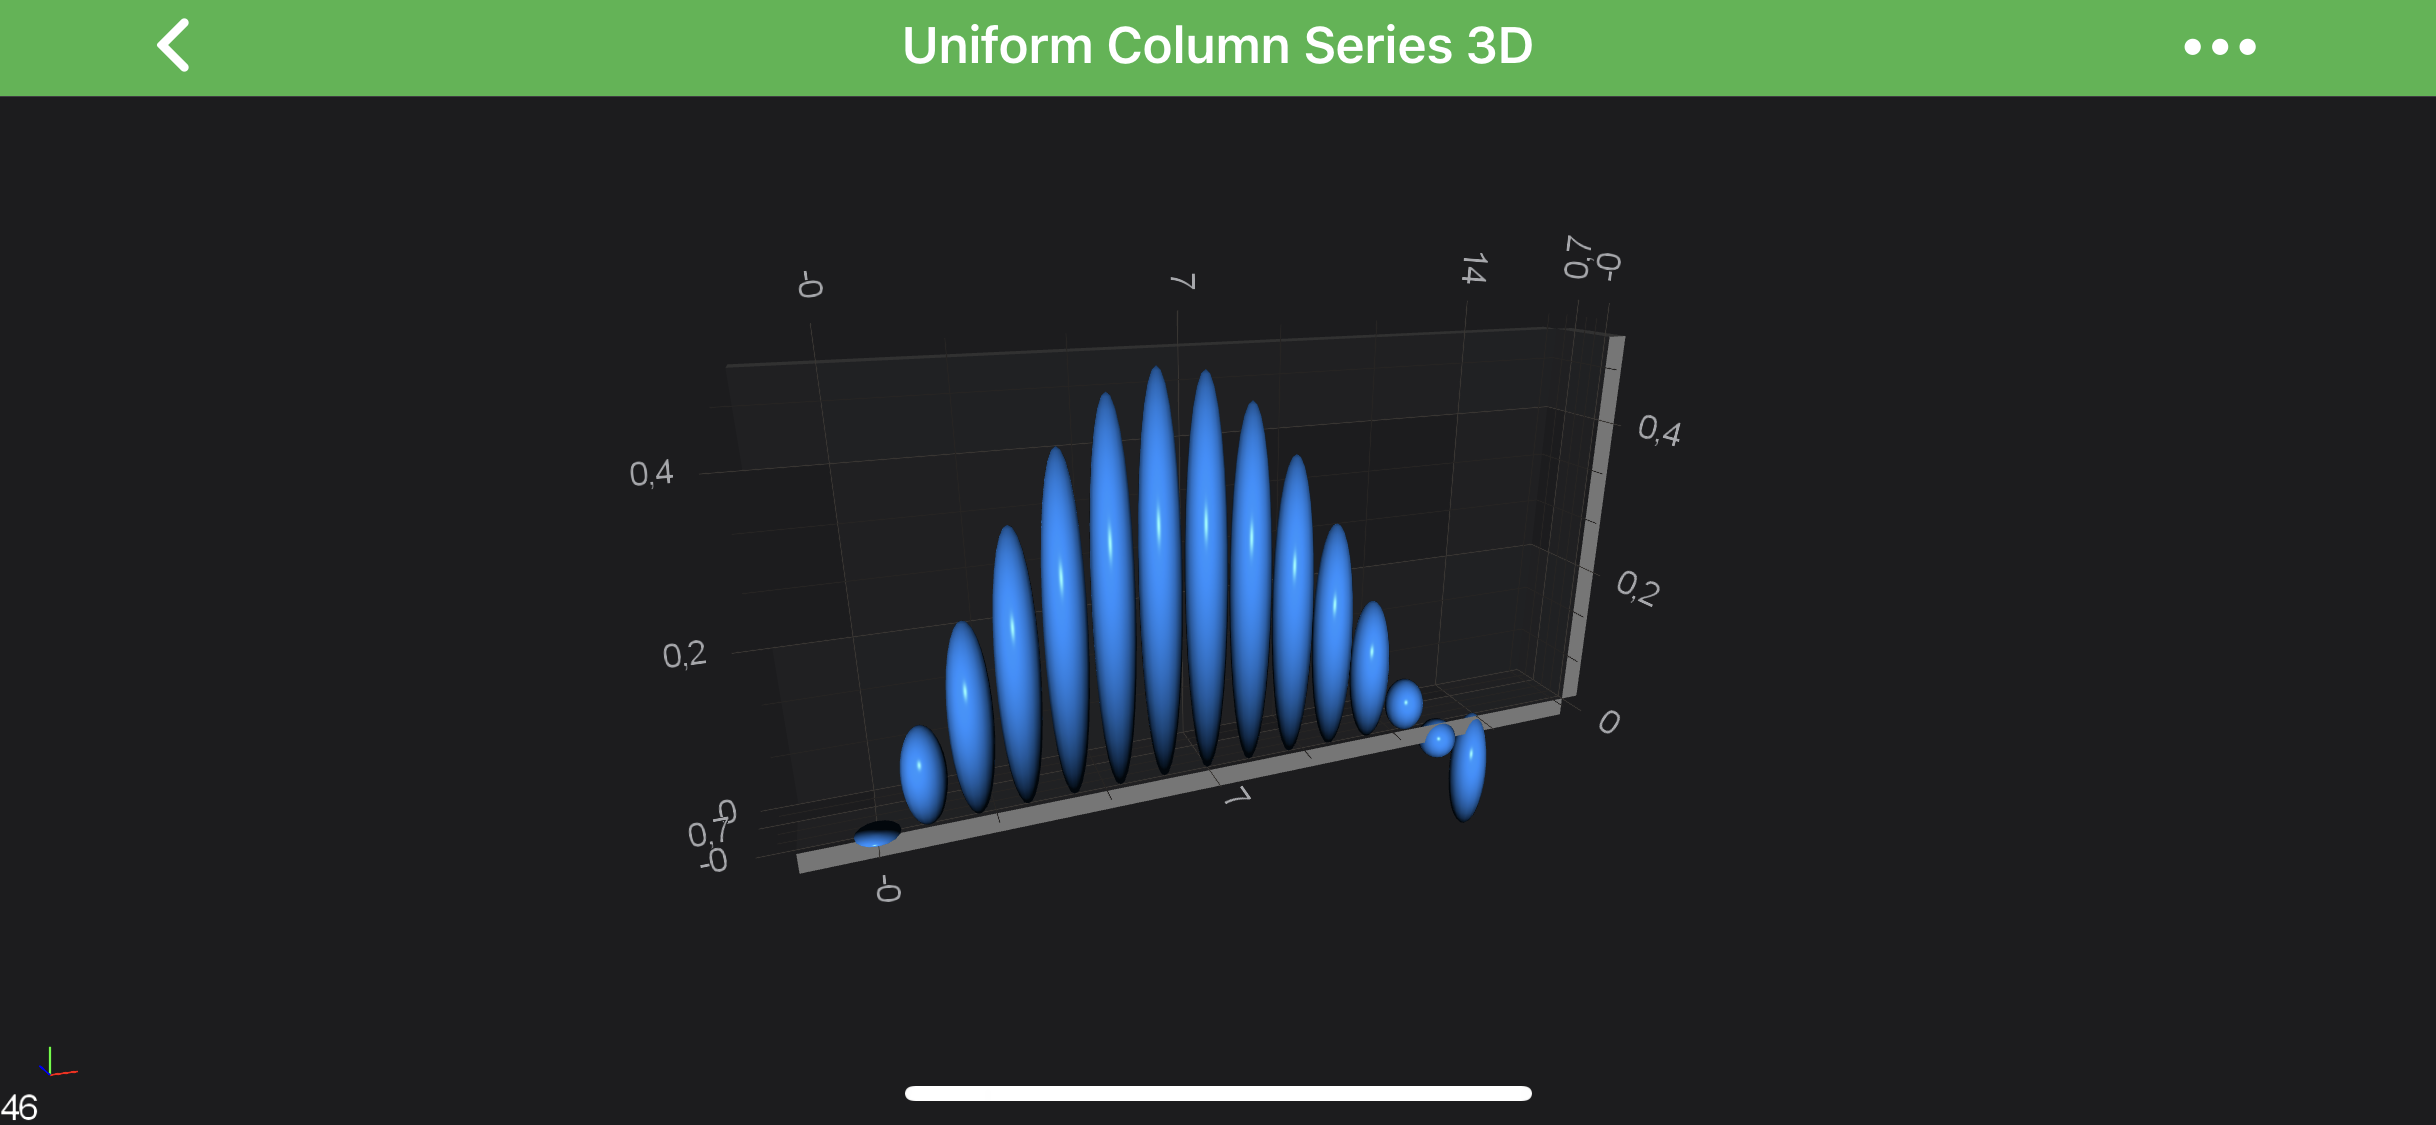
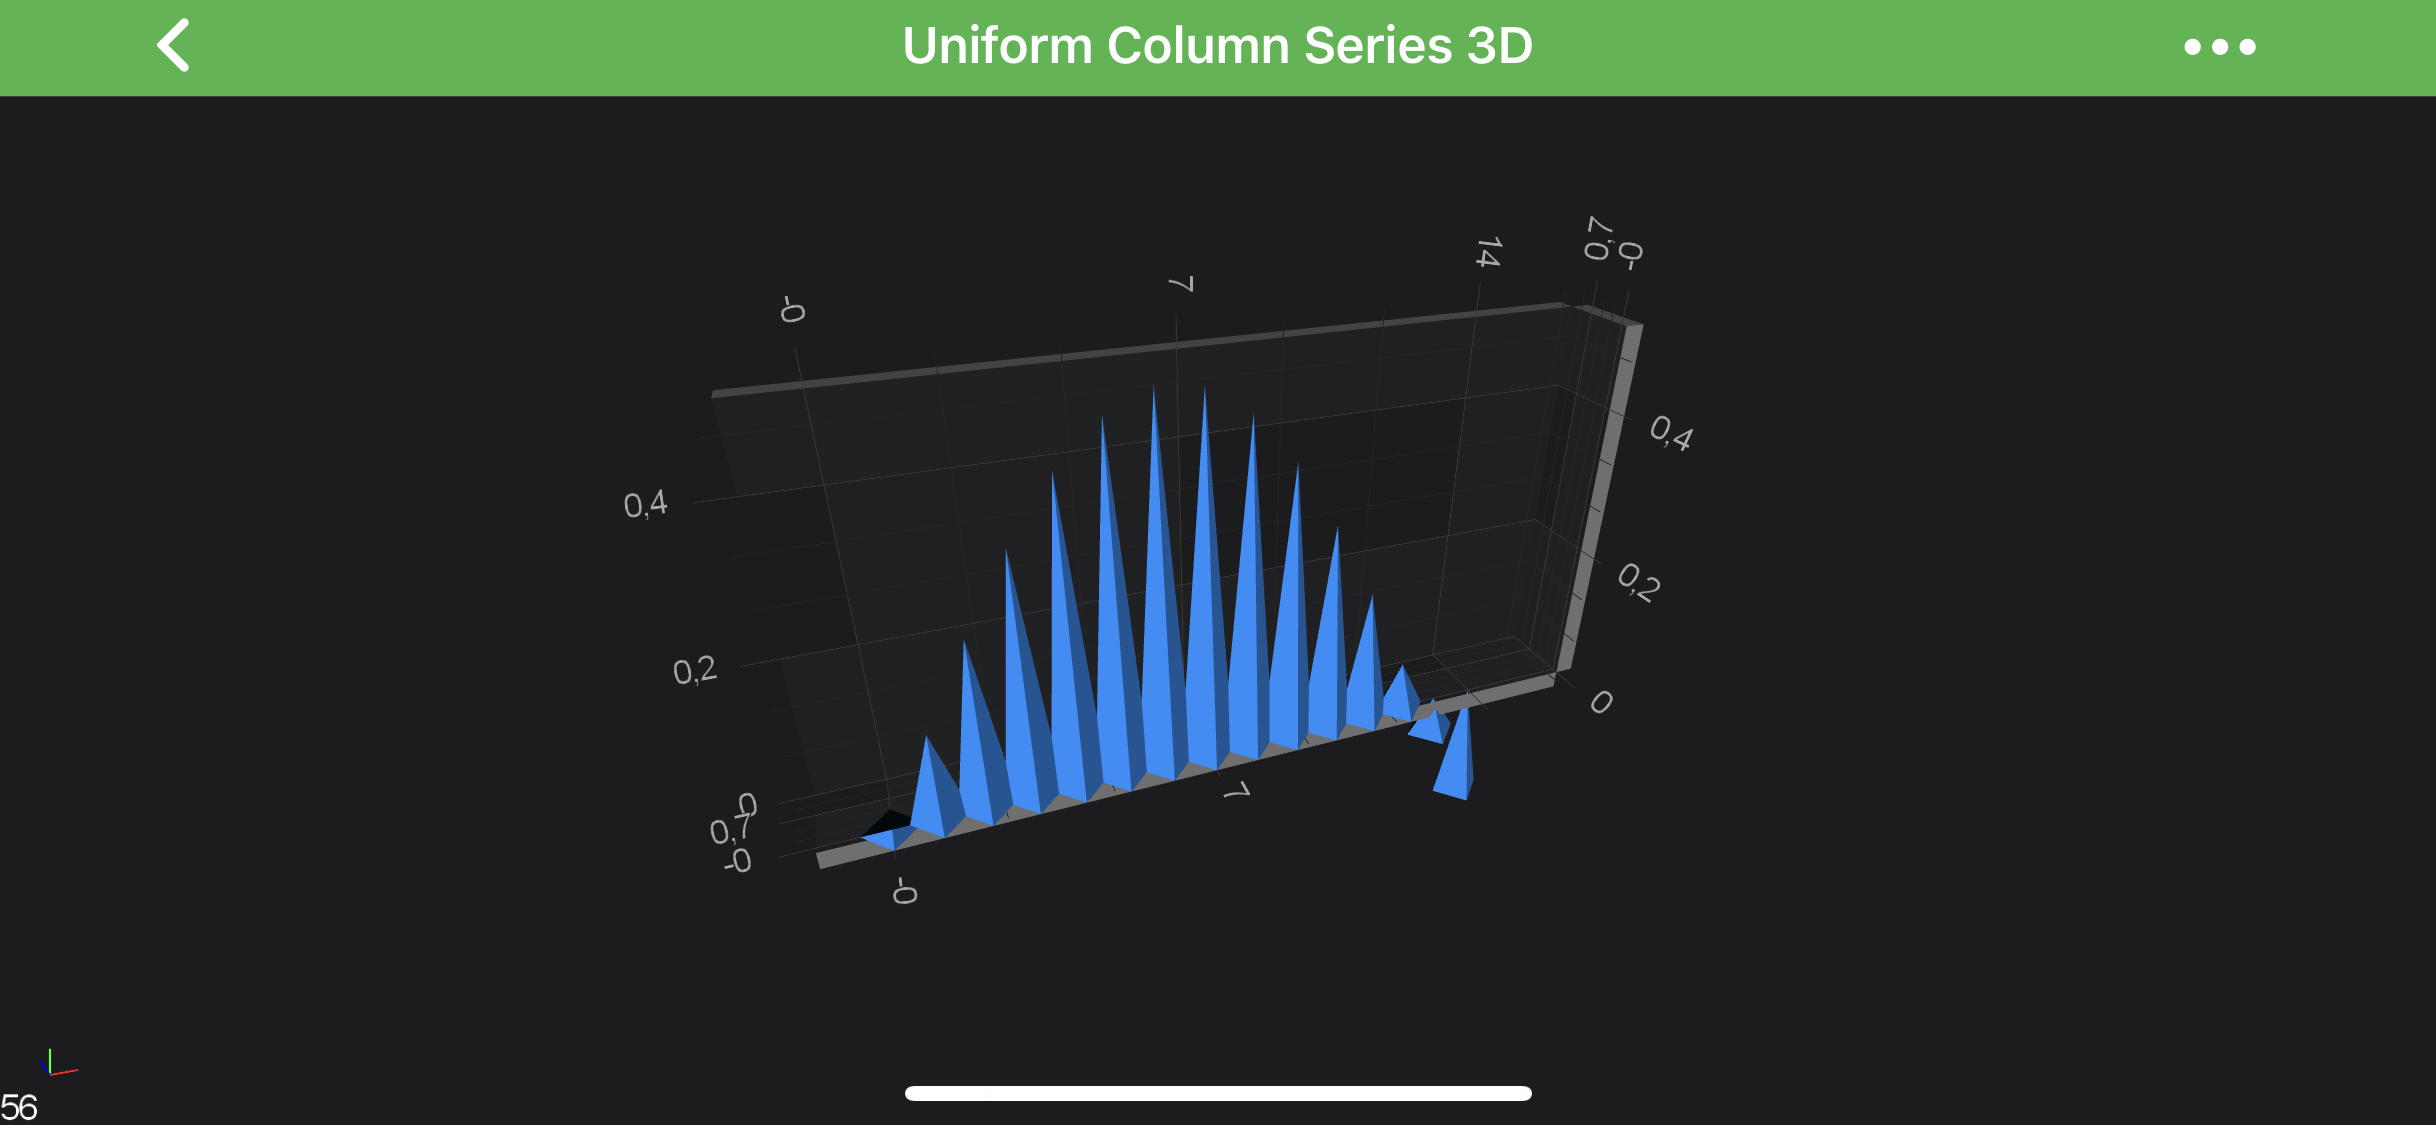
Single Row Column 3D Charts
You might also want to create a Single-Row of 3D Columns.
It’s easily achievable via providing SCIUniformGridDataSeries3D with size of 1 in Z-Direction and update the worldDimensions like below:
SCIUniformGridDataSeries3D *ds = [[SCIUniformGridDataSeries3D alloc] initWithXType:SCIDataType_Double yType:SCIDataType_Double zType:SCIDataType_Double xSize:ColumnsCount zSize:1];
for (int x = 0; x < ColumnsCount; x++) {
for (int z = 0; z < 1; z++) {
double y = sin(x * 0.25) / ((z + 1) * 2);
[ds updateYValue:@(y) atXIndex:x zIndex:z];
}
}
...
[self.surface.worldDimensions assignX:200 y:100 z:20];
let ds = SCIUniformGridDataSeries3D(xType: .double, yType: .double, zType: .double, xSize: Count, zSize: 1)
for x in 0 ..< Count {
for z in 0 ..< 1 {
let y = sin(Double(x) * 0.25) / Double((z + 1) * 2)
ds.update(y: y, atX: x, z: z)
}
}
...
self.surface.worldDimensions.assignX(200, y: 100, z: 20)
var dataSeries3D = new UniformGridDataSeries3D<double, double, double>(count, 1);
for (int x = 0; x < count; x++)
{
for (int z = 0; z < 1; z++)
{
var y = Math.Sin(x * .2) / ((z + 1) * 2);
dataSeries3D.UpdateYAt(x, z, y);
}
}
...
Surface.WorldDimensions.AssignX(200, 100, 20);
and results in the following chart:
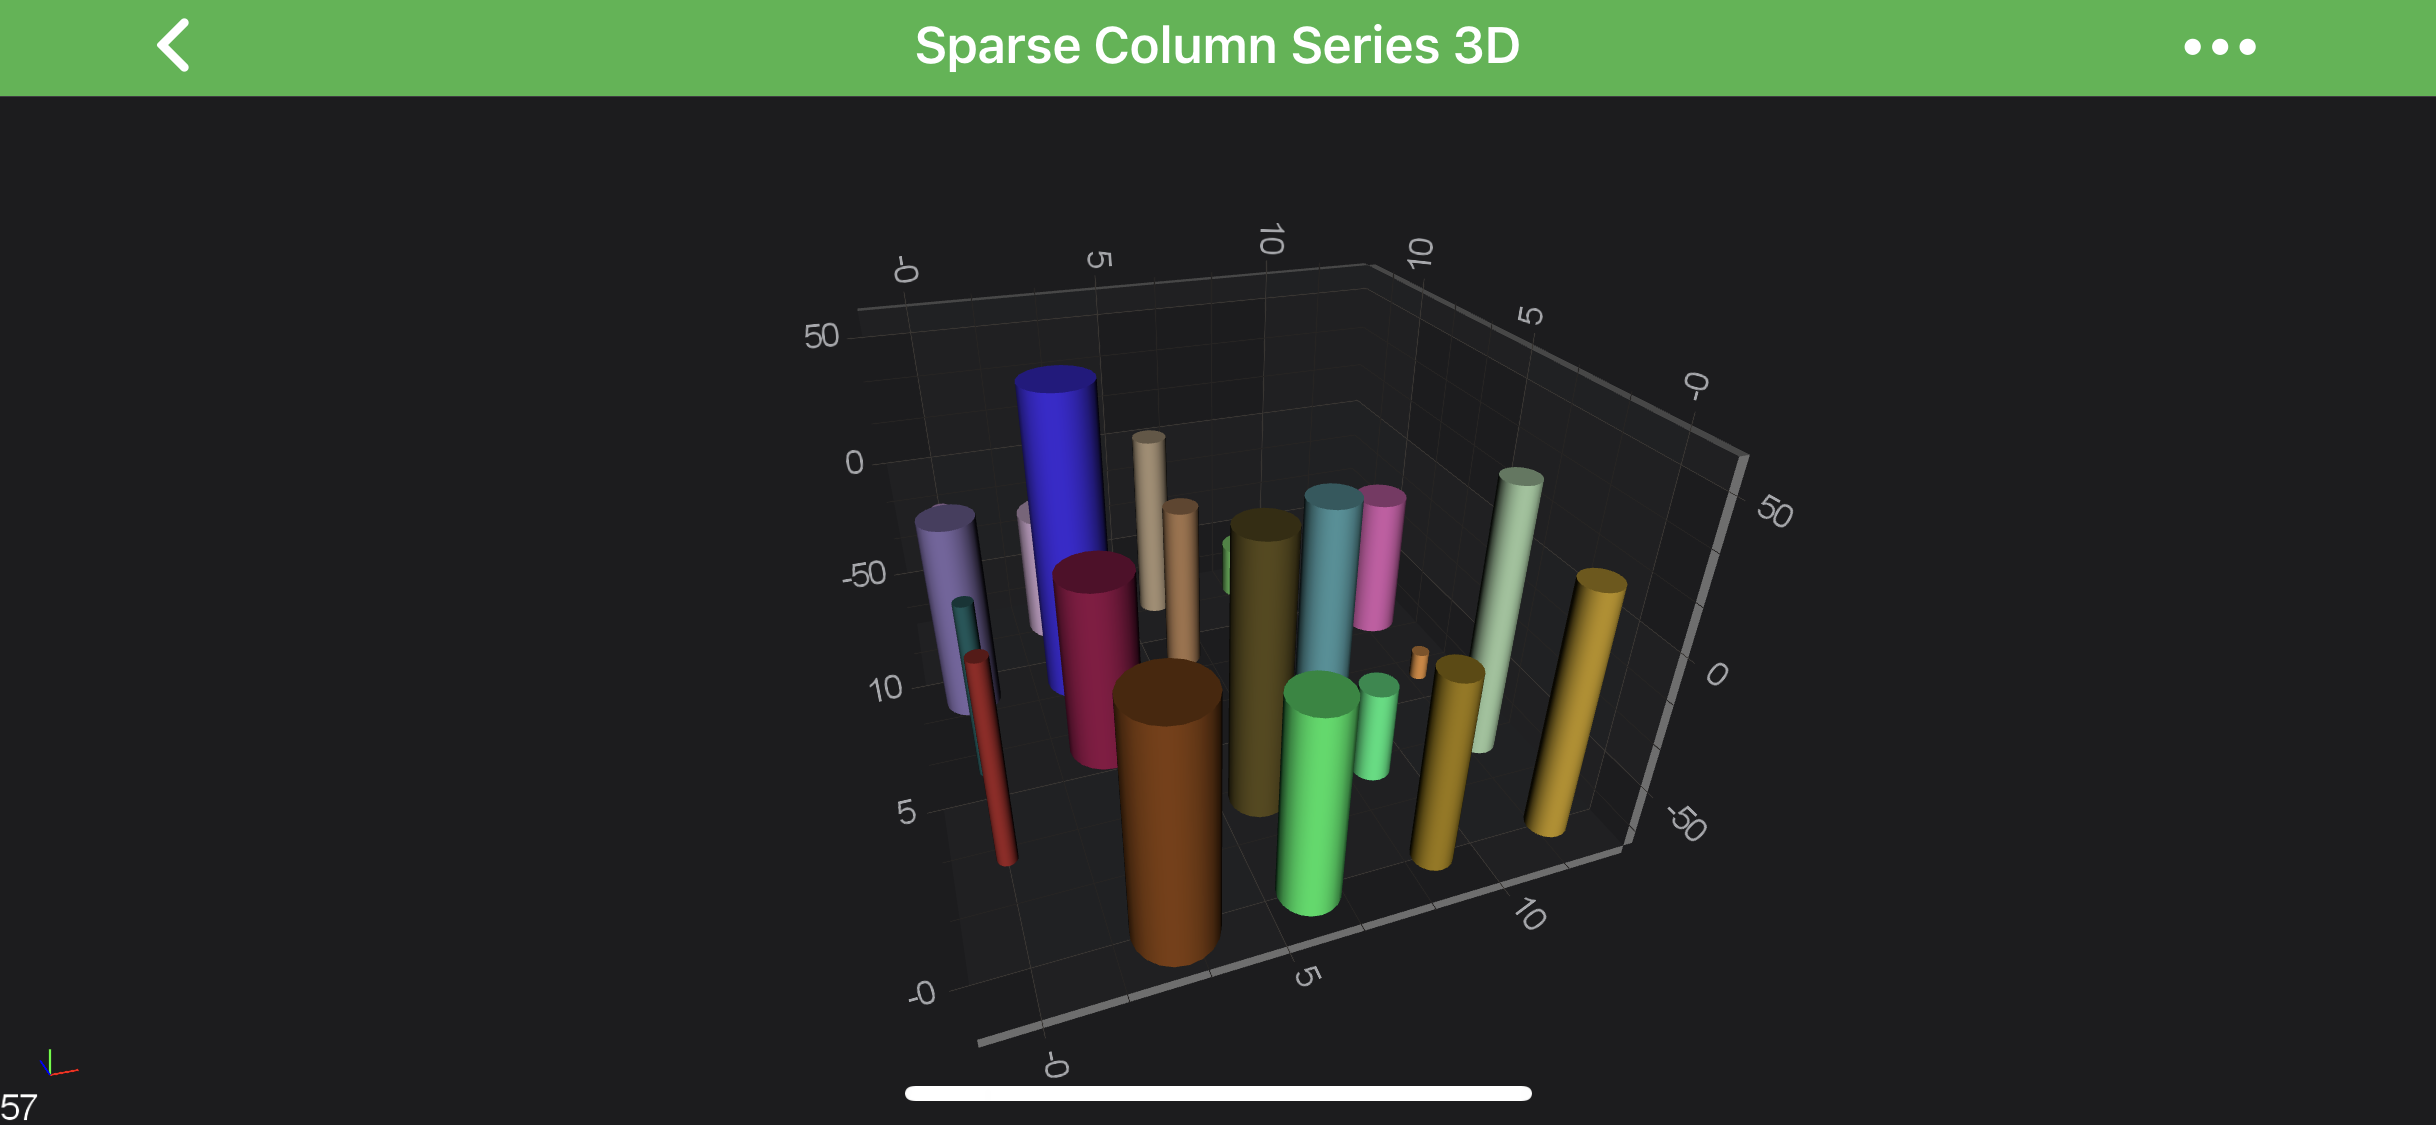
Non-Uniform Column Series 3D
In order to create Non-Uniform Column Series 3D - you will need to provide the SCIXyzDataSeries3D with points.
let dataSeries = SCIXyzDataSeries3D(xType: .double, yType: .double, zType: .double)
let pointMetaDataProvider = SCIPointMetadataProvider3D()
for i in 1 ..< Count {
for j in 1 ..< Count {
if (i != j) && (i % 3) == 0 && (j % 3) == 0 {
let y = SCDDataManager.getGaussianRandomNumber(5, stdDev: 1.5)
dataSeries.append(x: i, y: y, z: j)
let metadata = SCIPointMetadata3D(vertexColor: SCDDataManager.randomColor(), andScale: SCDDataManager.randomScale())
pointMetaDataProvider.metadata.add(metadata)
}
}
}
let rs = SCIColumnRenderableSeries3D()
rs.dataSeries = dataSeries
rs.metadataProvider = pointMetaDataProvider
var dataSeries3D = new XyzDataSeries3D<double, double, double>();
var metadataProvider = new SCIPointMetadataProvider3D();
for (int i = 0; i < count; i++)
{
for (int j = 0; j < count; j++)
{
if (i != j && i % 2 == 0 && j % 2 == 0)
{
var y = dataManager.GetGaussianRandomNumber(5, 1.5);
dataSeries3D.Append(i, y, j);
var metadata = new SCIPointMetadata3D((uint)dataManager.GetRandomColor().ToArgb());
metadataProvider.Metadata.Add(metadata);
}
}
}
var rSeries3D = new SCIColumnRenderableSeries3D
{
DataSeries = dataSeries3D,
MetadataProvider = metadataProvider
};
 View on GitHub