 View on GitHub
iOS & macOS Charting Documentation - SciChart iOS & macOS Charts SDK v4.x
The Surface Mesh 3D Chart Type
The surface mesh renders a two-dimensional array as a heightmap.
In SciChart it’s defined by the SCISurfaceMeshRenderableSeries3D class and provides a number of configurable chart types in SciChart 3D, including:
- dynamic real-time Surfaces (terrains or height maps).
- texturing of surfaces or terrains or height maps.
- Non-uniform or uniform grid spacing.
- Contour mapping or wireframe on terrain or height maps.
NOTE: Examples of the Surface Mesh 3D Series can be found in the SciChart iOS Examples Suite as well as on GitHub:
In the Surface Mesh 3D Series, the data is stored in the SCIUniformGridDataSeries3D.
This represents a 2-dimensional grid, typically of type double.
Some important points which is mandatory to understand while configuring the Surface Meshes:
- The double values which are stored in the
SCIUniformGridDataSeries3Dcorrespond to the heights on the chart (theY-Axis). They are transformed into chart World Coordinates via theISCIChartSurface3D.yAxis. - The
ZandXData-Value are defined by the StartX, StepX, StartZ and StepZ properties onSCIUniformGridDataSeries3D. These are transformed into World Coordinates via theISCIChartSurface3D.xAxisandISCIChartSurface3D.zAxisrespectively. - The Colours on the SurfaceMesh are defined by the
SCIMeshColorPalette. More on this in the following sections.
The SCISurfaceMeshRenderableSeries3D is highly configurable, so please read on the Configuring Surface Mesh 3D Series section.
Create a Surface Mesh Series 3D
In order to create Uniform Surface Mesh 3D - you will need to provide the SCIUniformGridDataSeries3D with N x M array of points.
The above graph is rendered with the following code:
Configuring Surface Mesh 3D Series
There are several properties which affect rendering of the SCISurfaceMeshRenderableSeries3D and those are listed below:
| Property | Description |
|---|---|
SCIContourMeshRenderableSeries3DBase.highlight |
Changes the lighting algorithm to make cells appear lighter. |
SCIContourMeshRenderableSeries3DBase.meshColorPalette |
defines the SCIMeshColorPalette which is used to calculate color from data value. See the Applying Palettes to the 3D Surface Meshes section for more information. |
SCIContourMeshRenderableSeries3DBase.meshPaletteMode |
Changes how the heightmap is applied. See the Applying Palettes to the 3D Surface Meshes section for more information. |
SCISurfaceMeshRenderableSeries3D.heightScaleFactor |
Applies a constant scaling factor to the heights, e.g. setting to 0 will make the surface mesh flat. |
SCISurfaceMeshRenderableSeries3D.yOffset |
Applies a constant offset heights, e.g. setting to 1 will move the SurfaceMesh 1-Data-Value in the Y-direction. |
The effect of these properties are demonstrated in the images below.
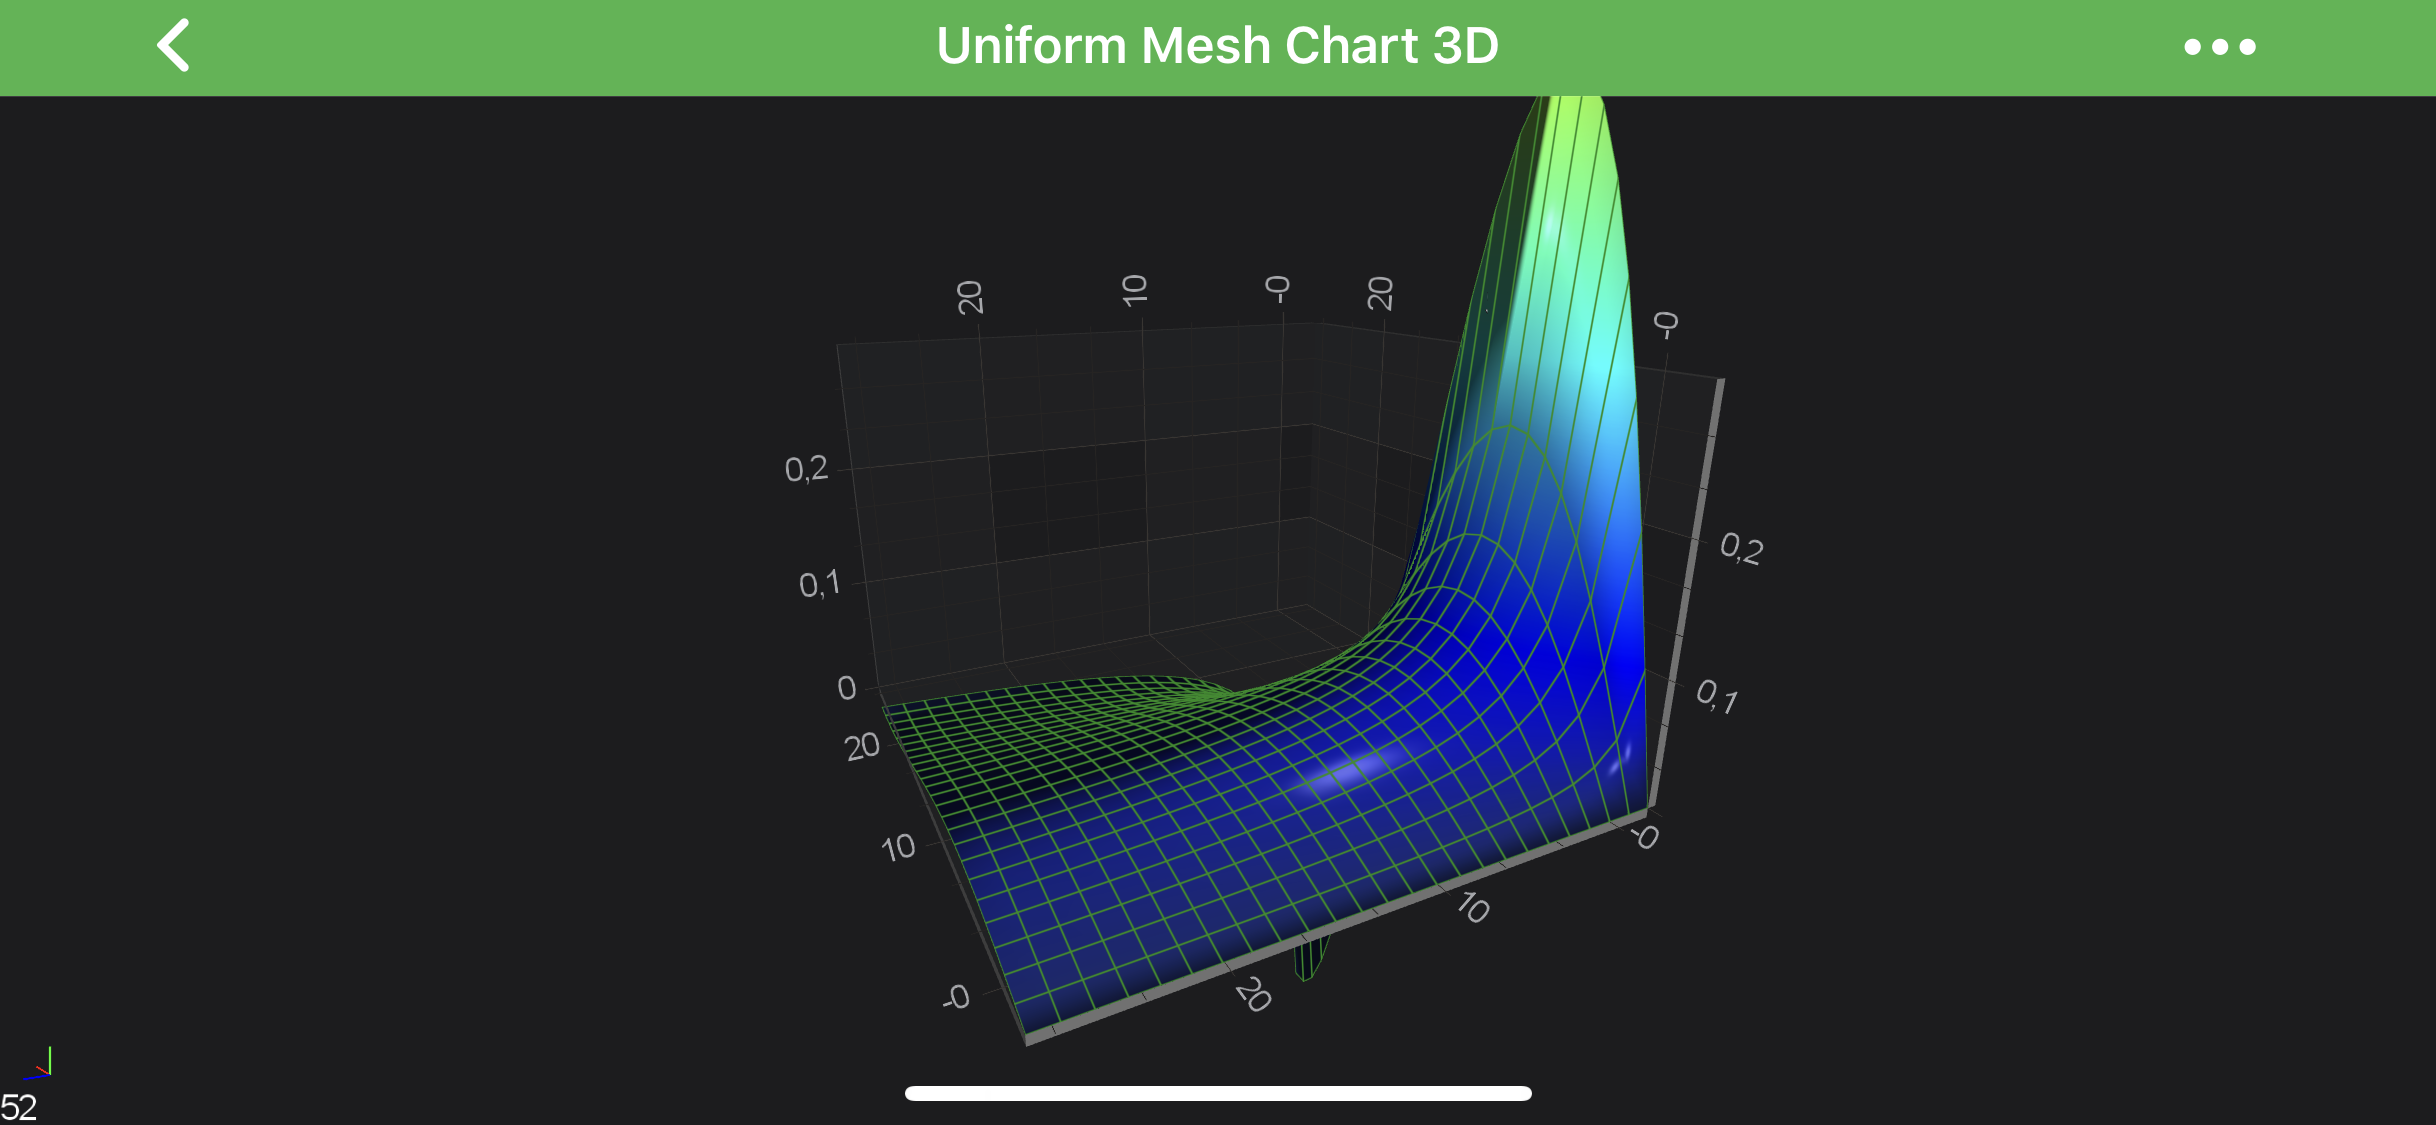
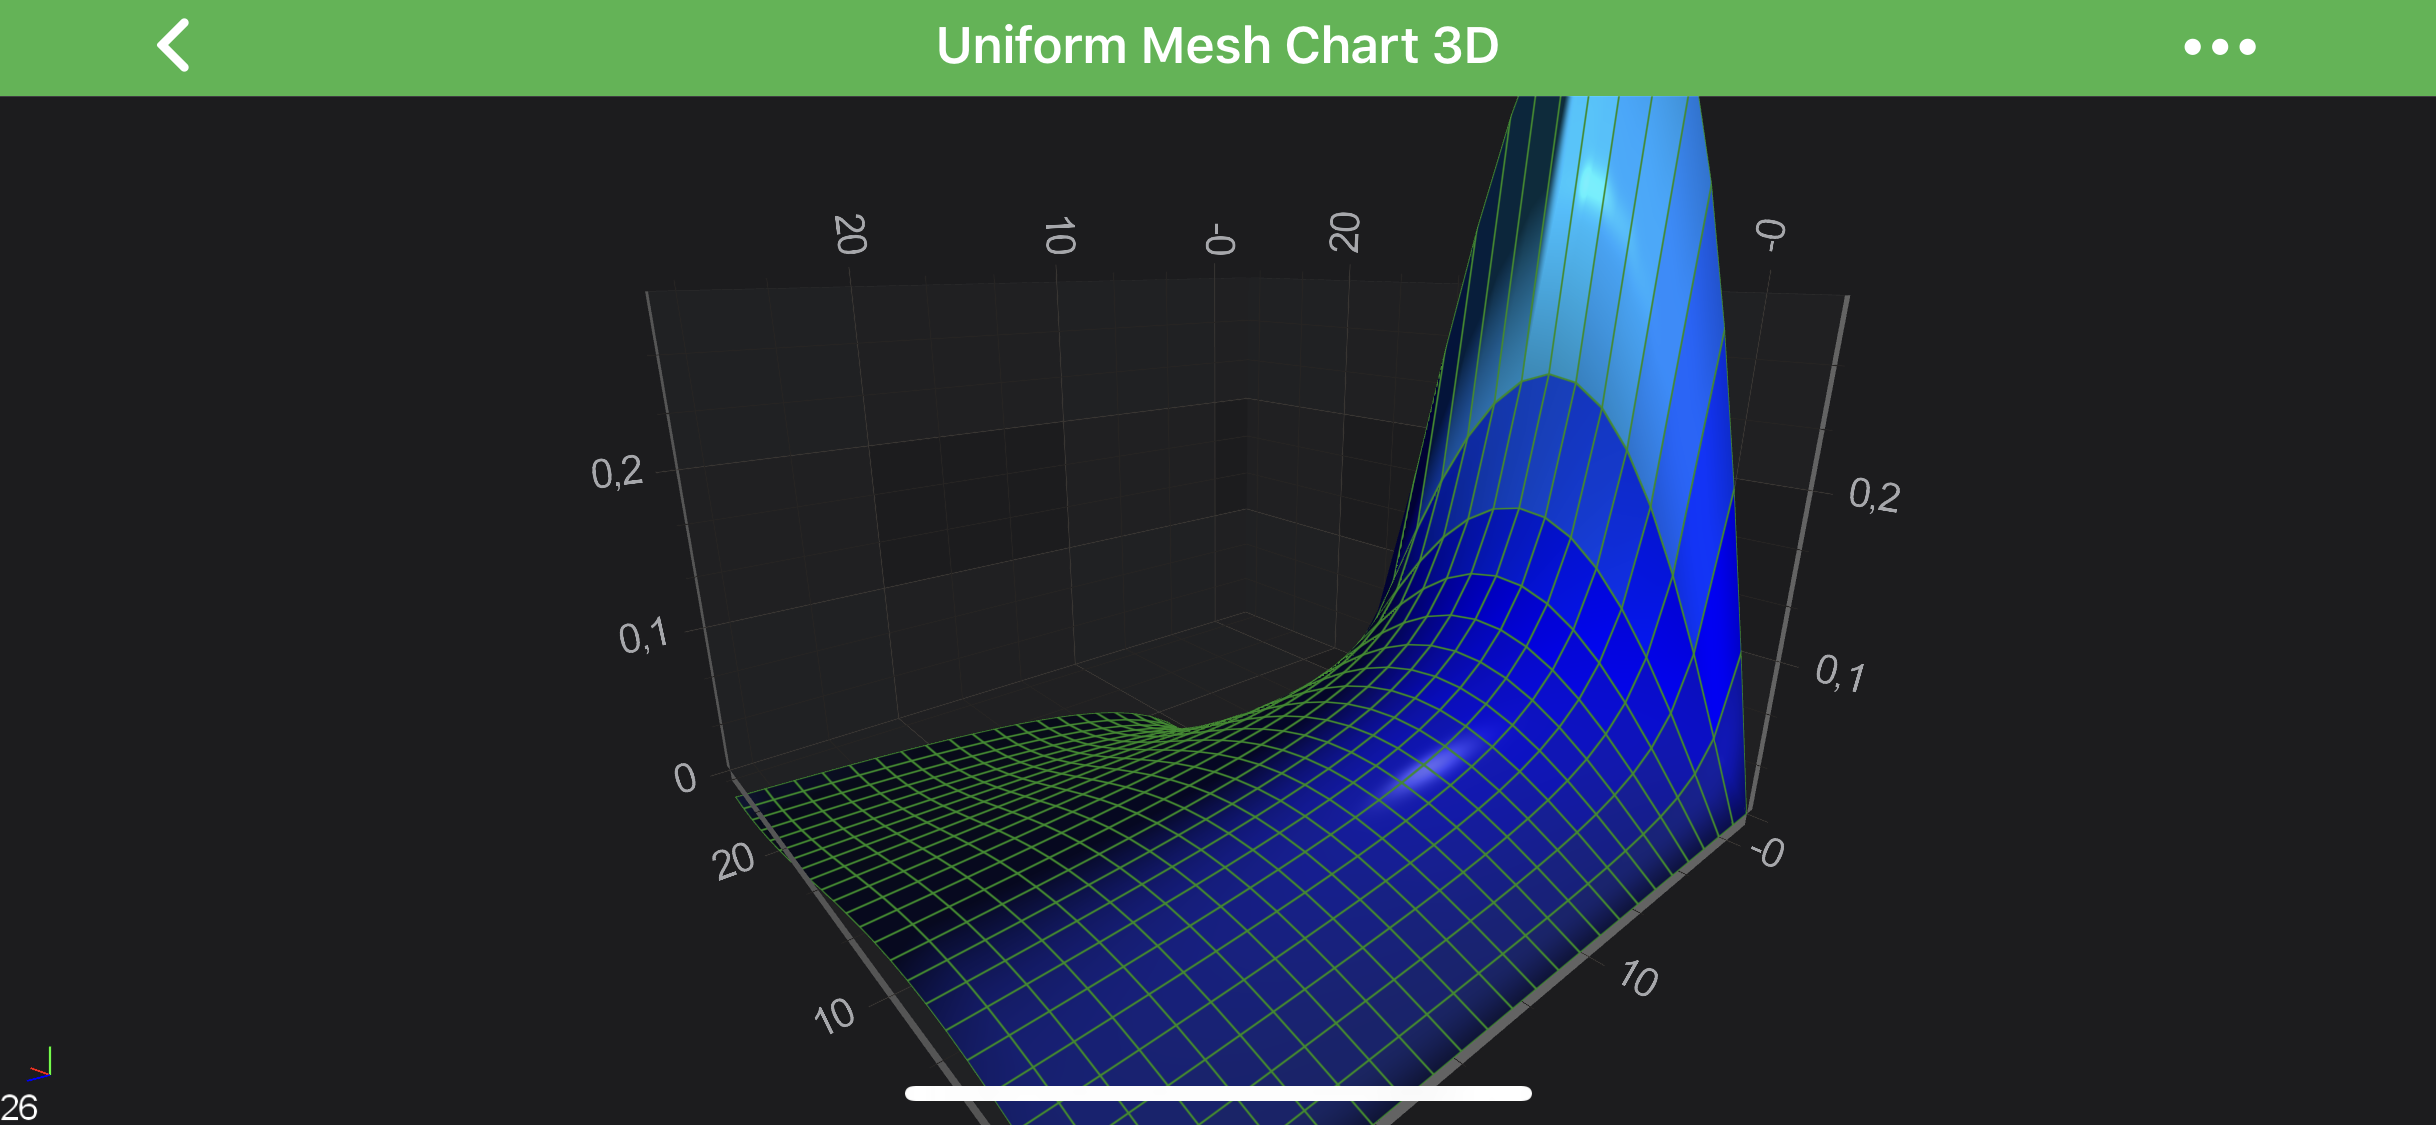
| Highlight = 0 | Highlight = 1 |
|---|---|
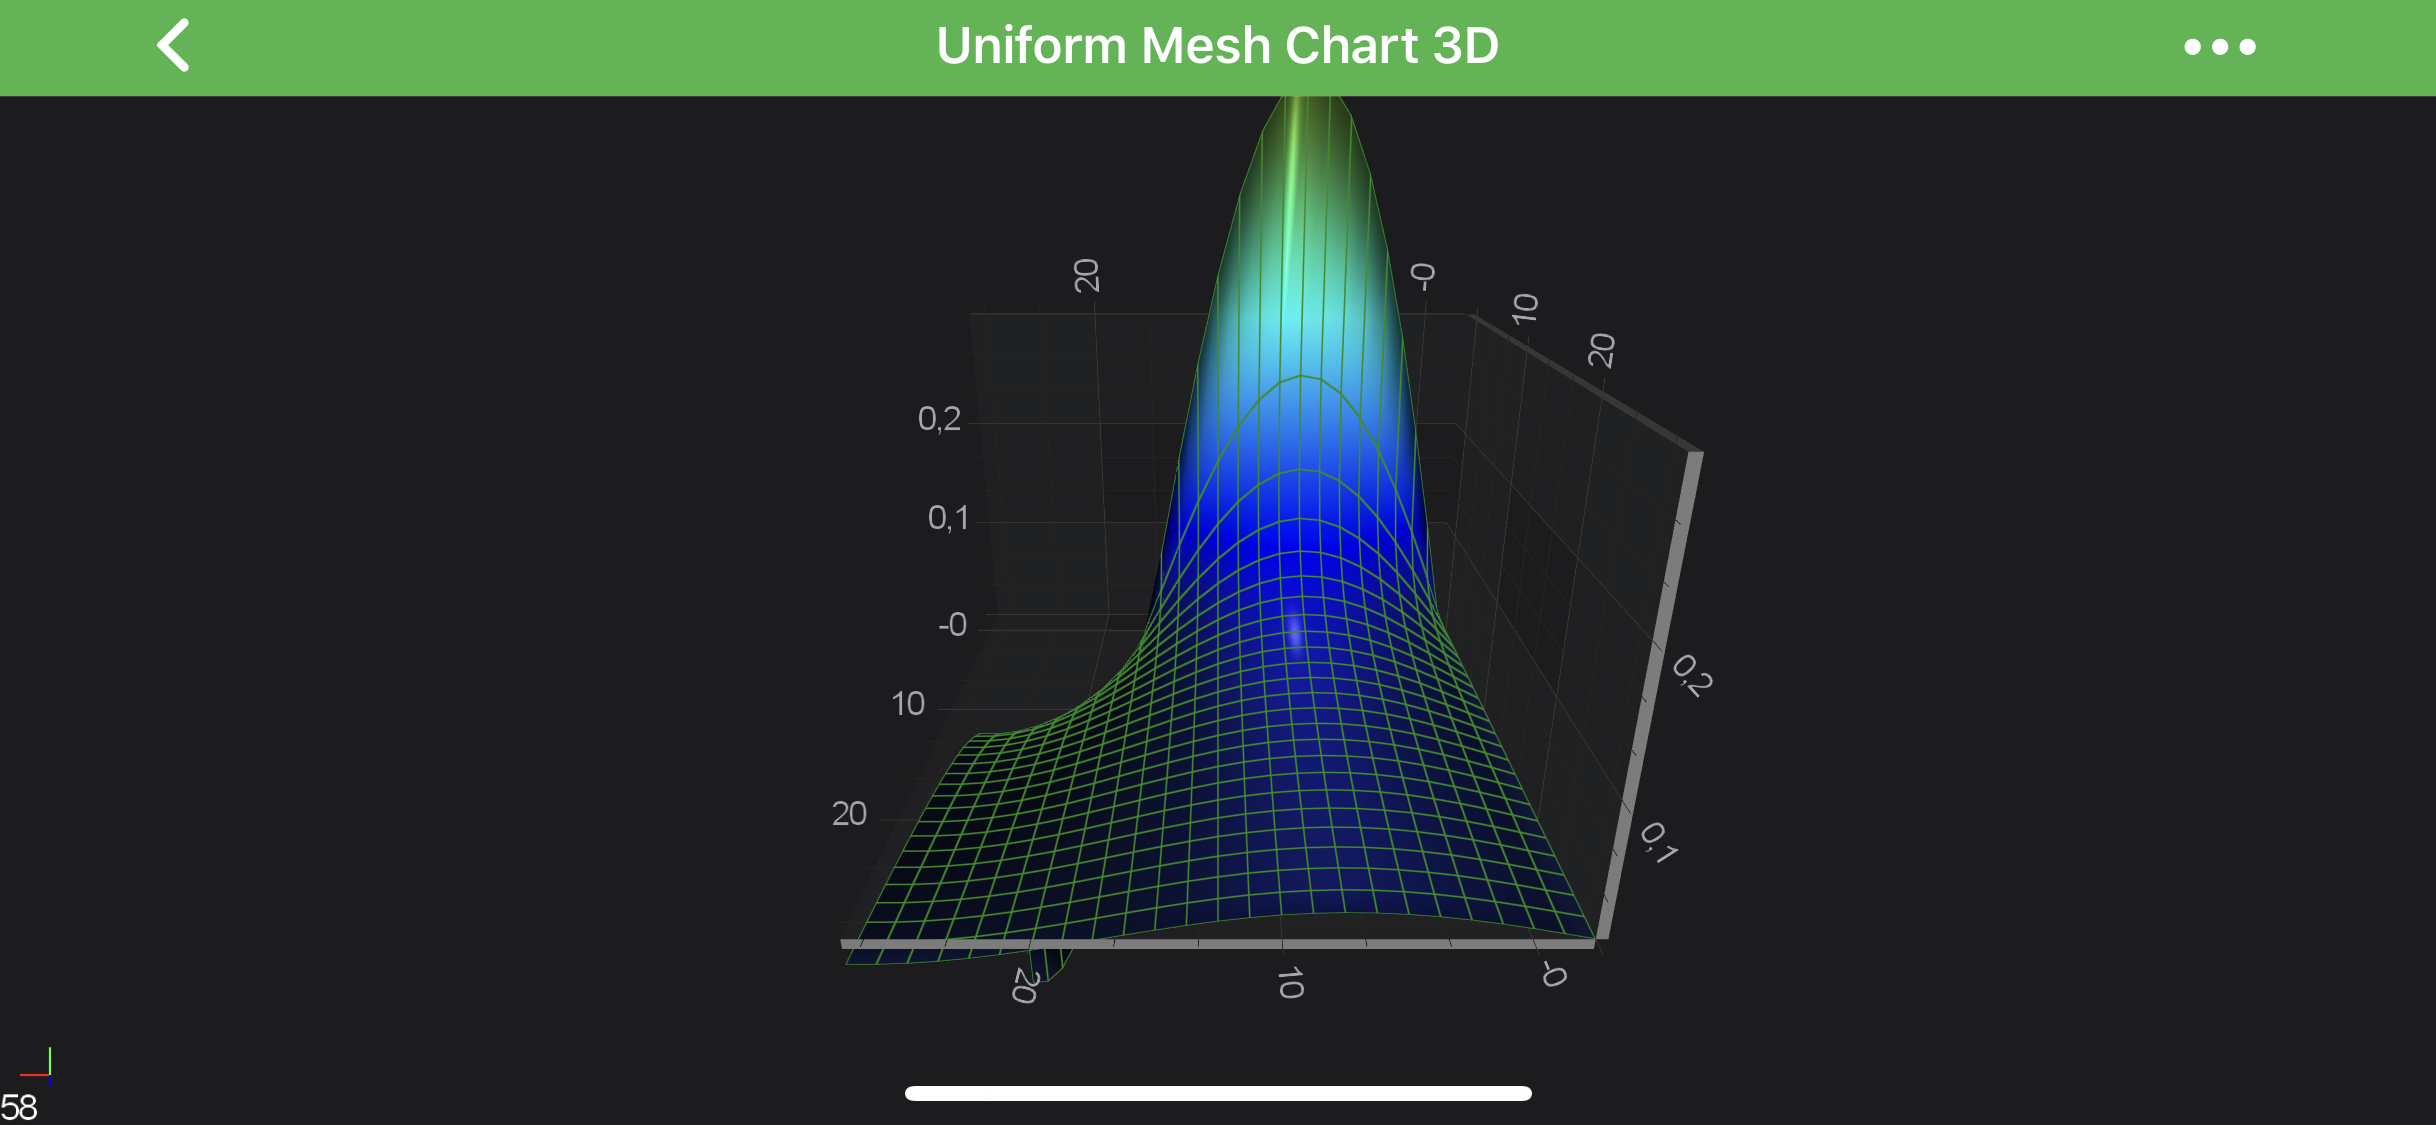 |
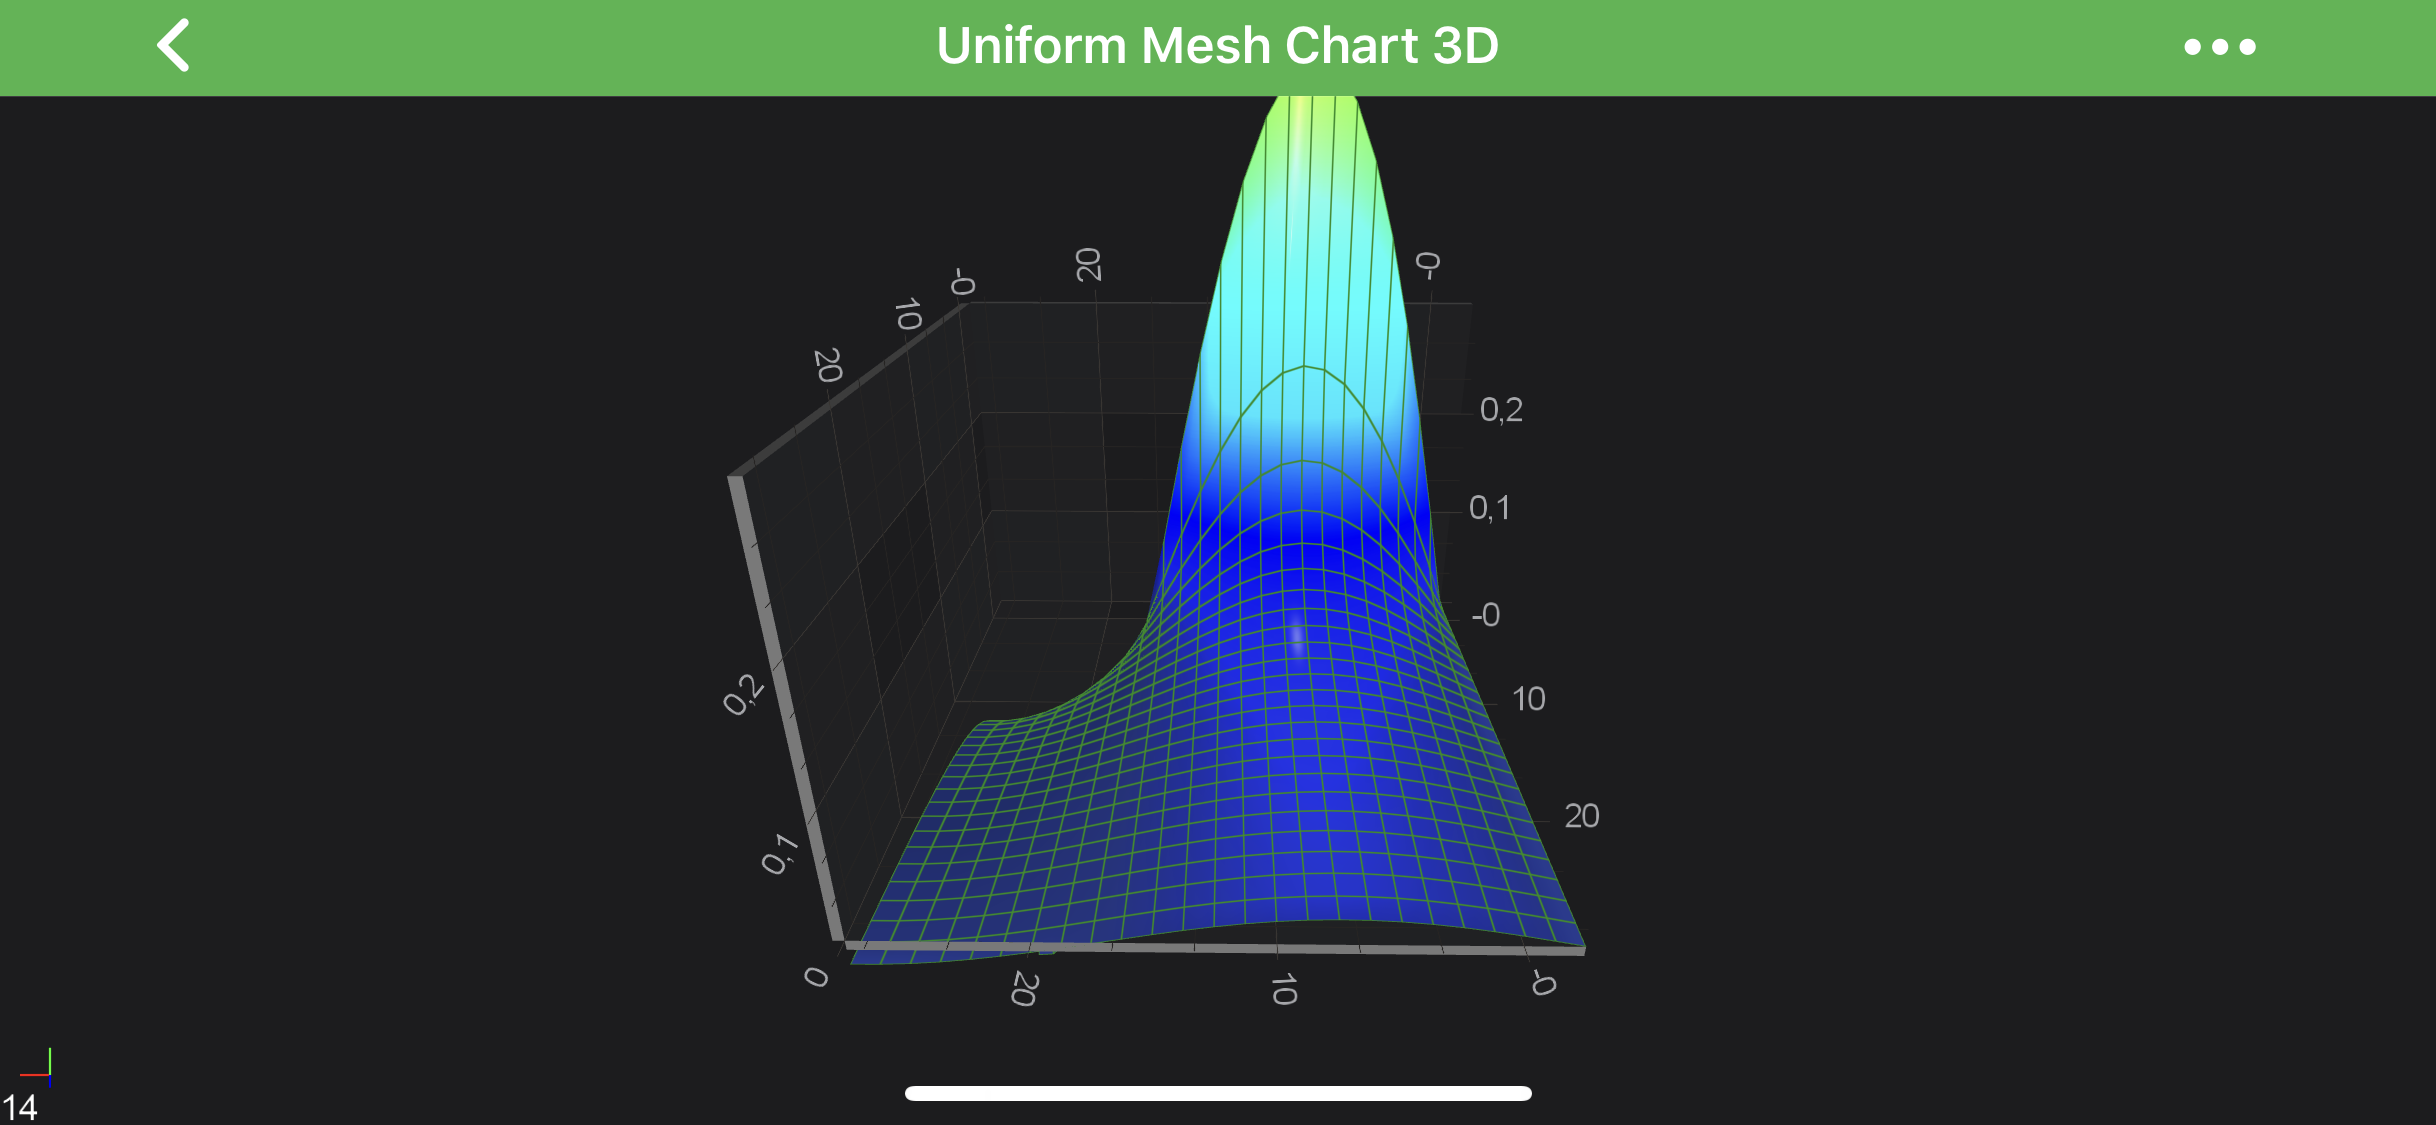 |
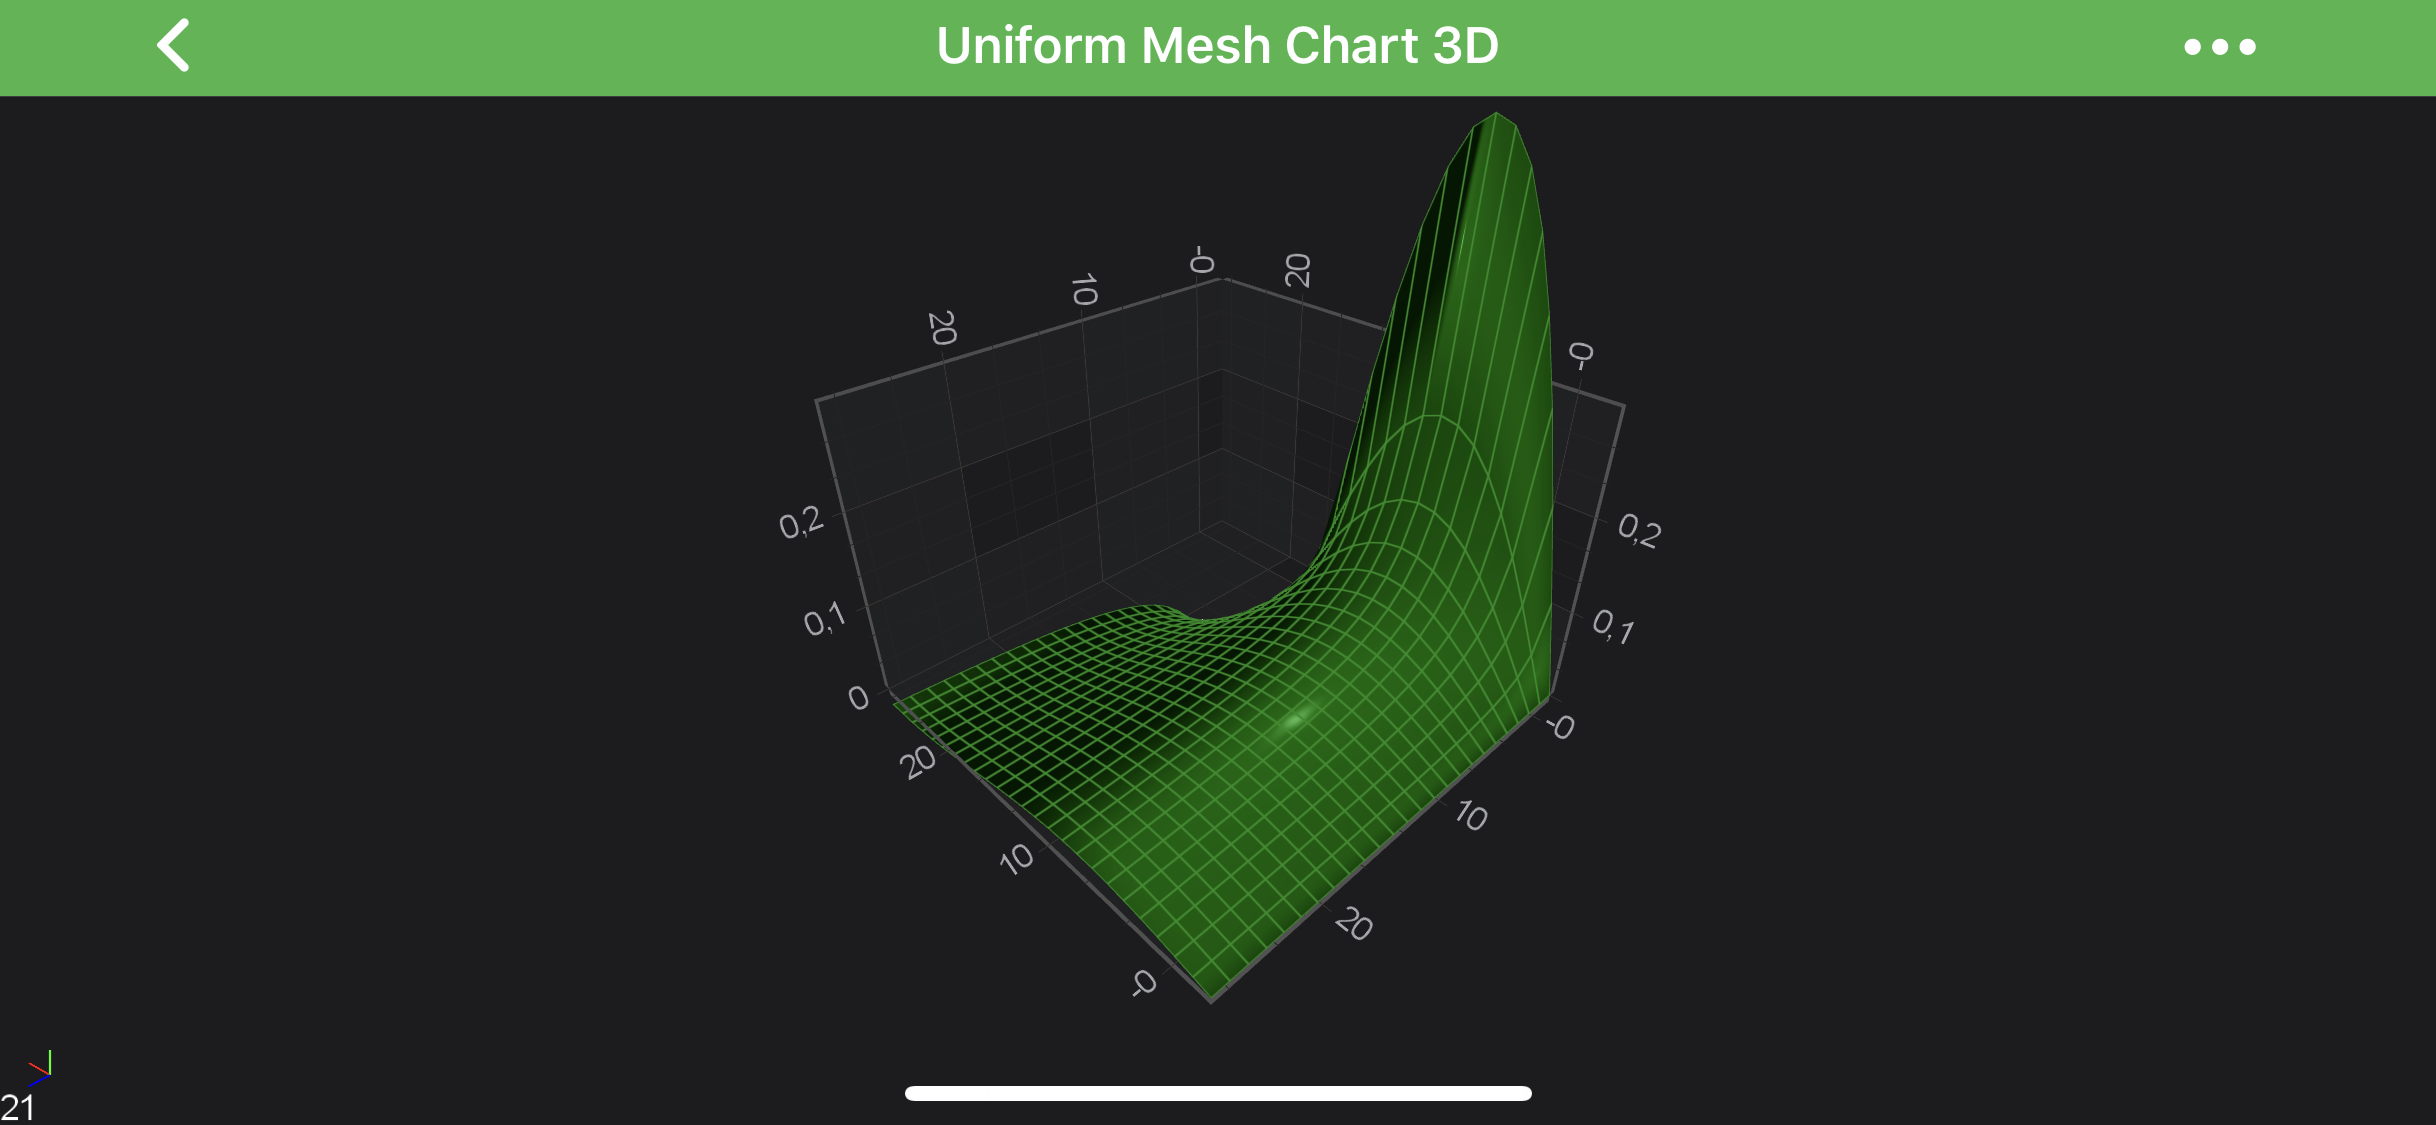
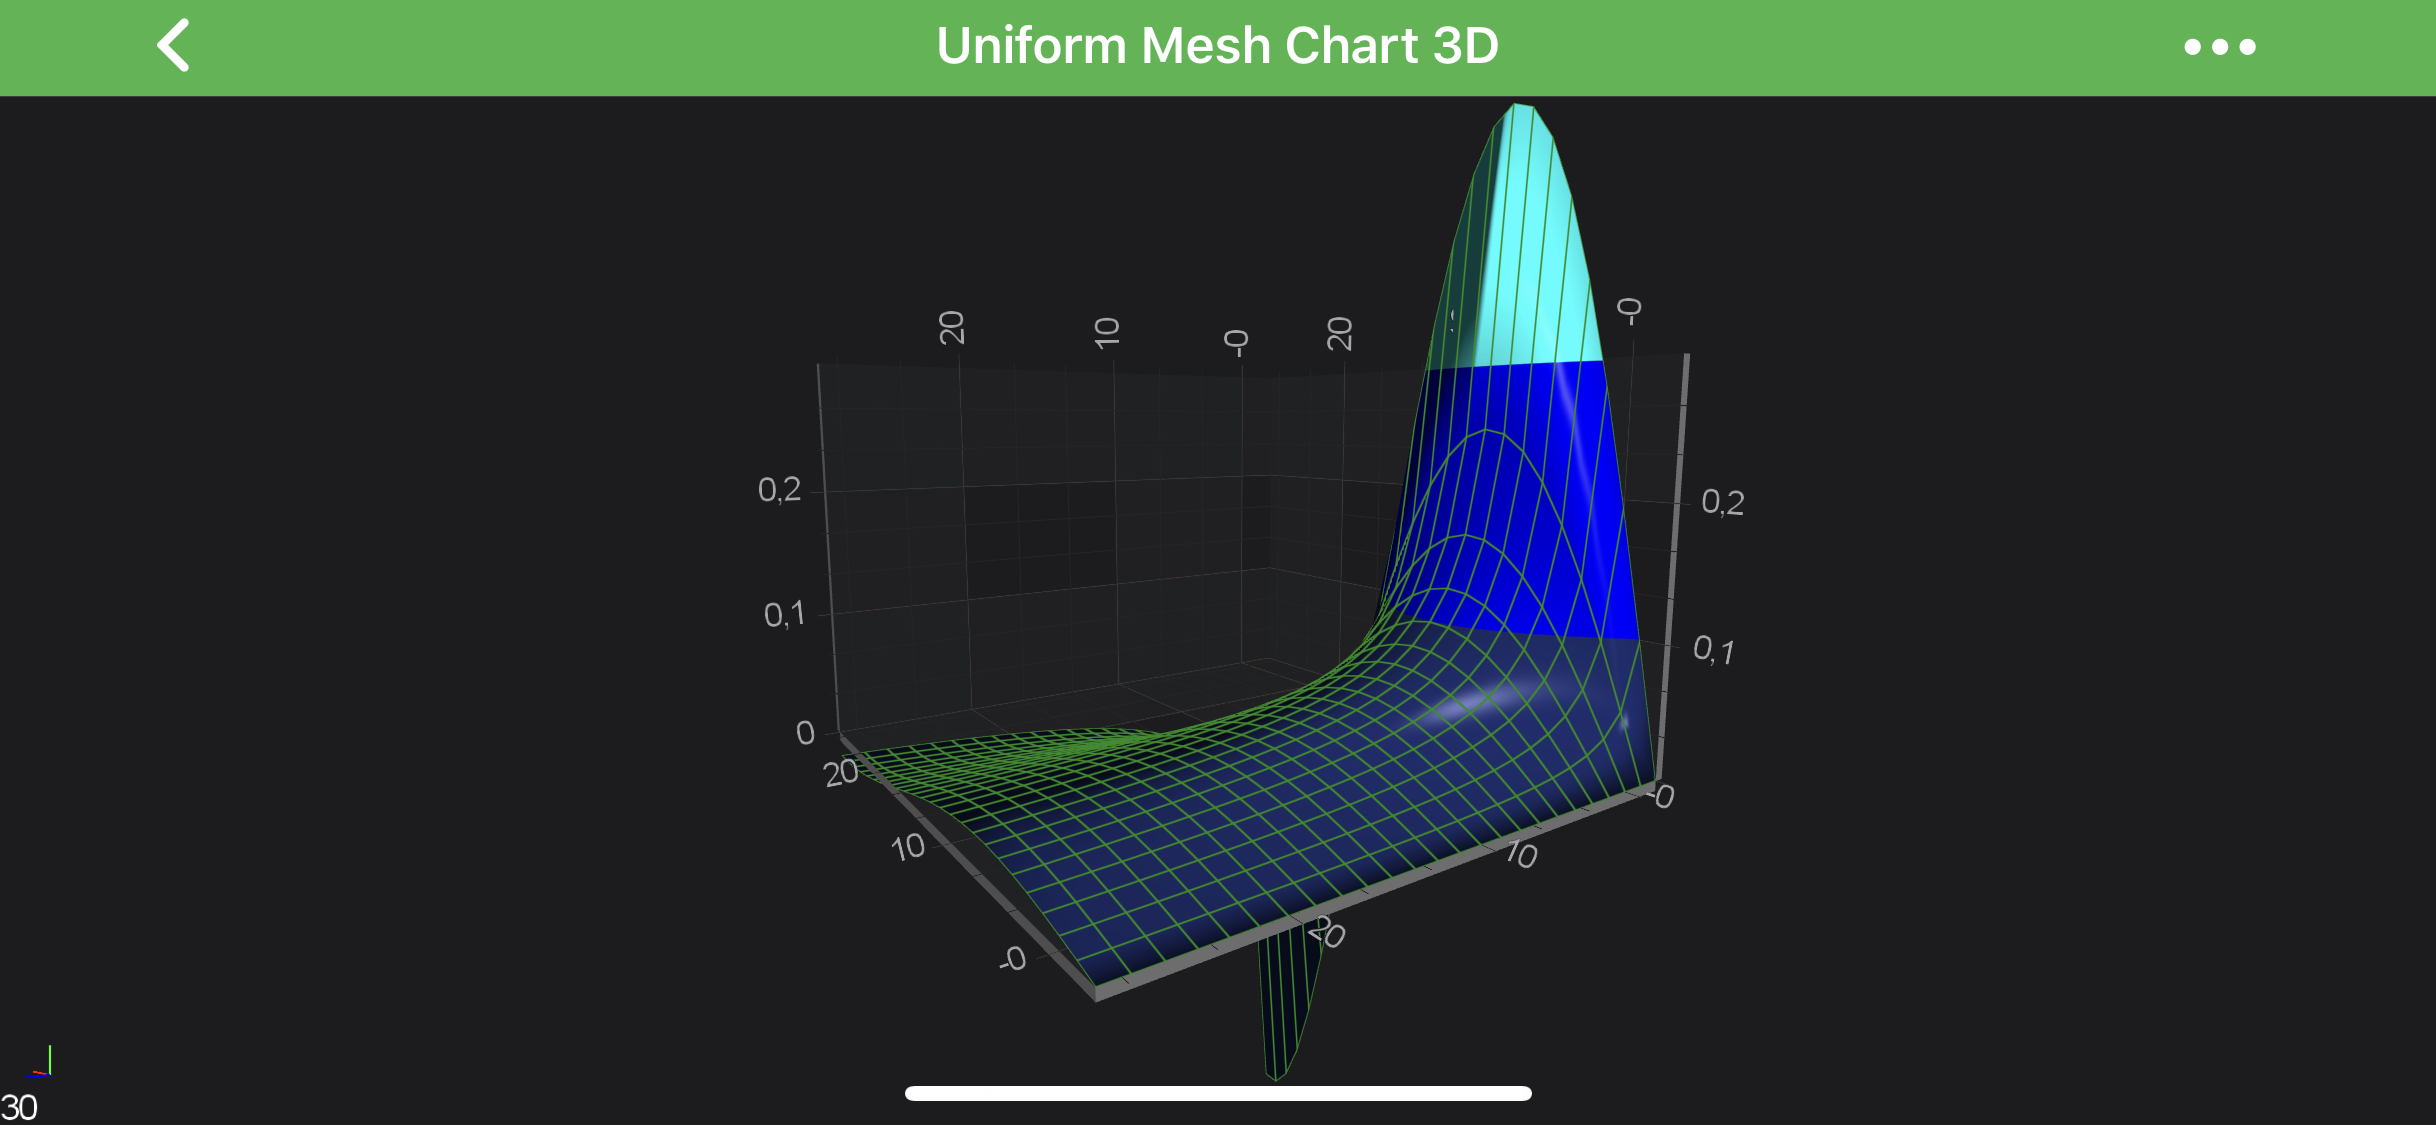
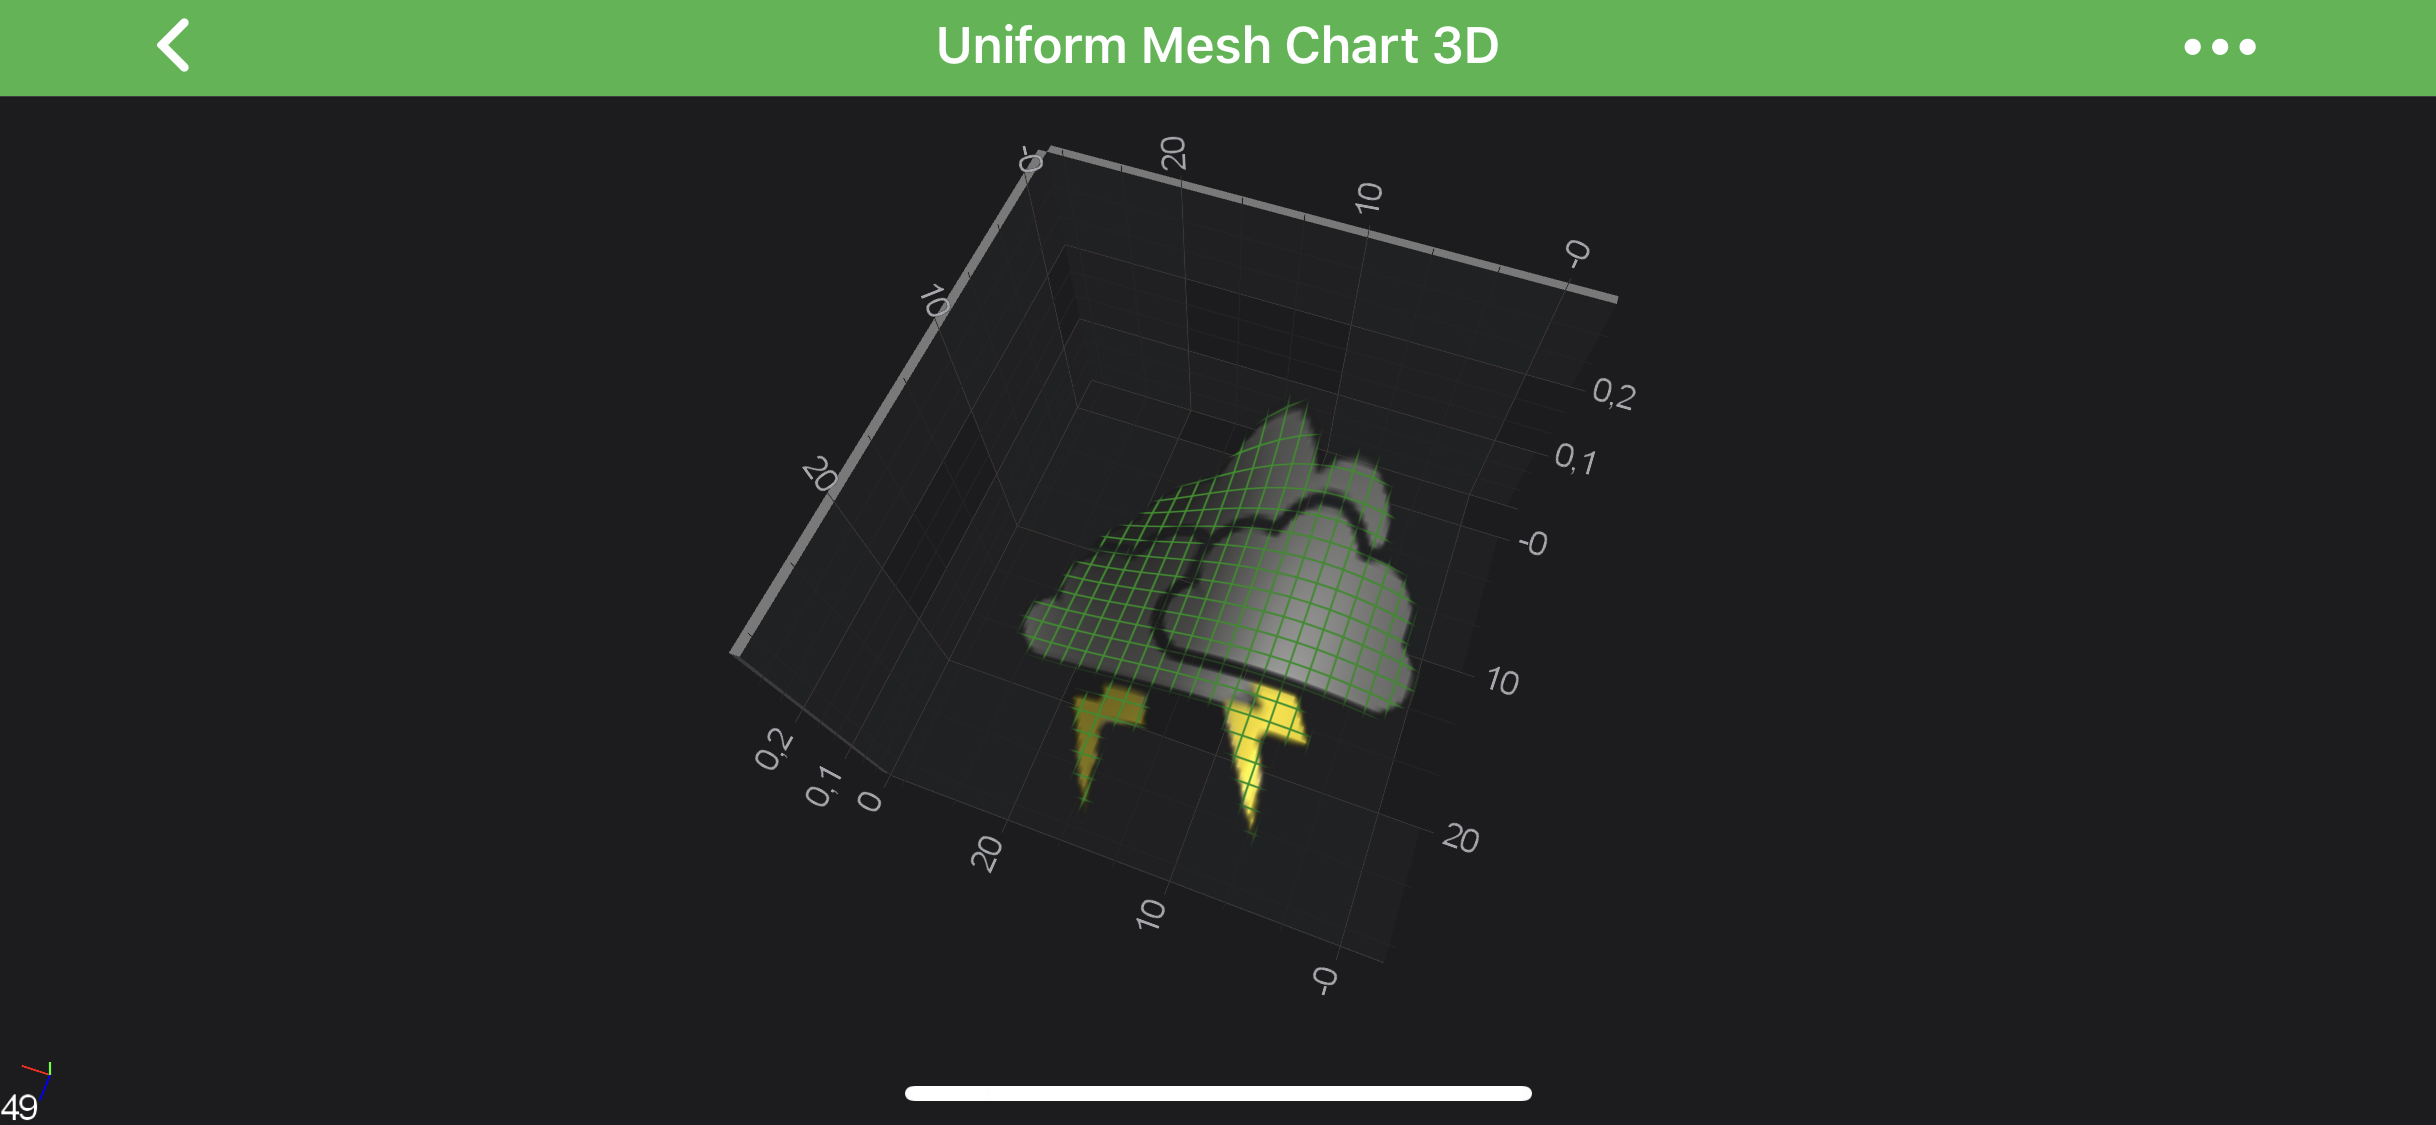
| HeightScaleFactor = 0 | meshPaletteMode = HeightMapSolidCells |
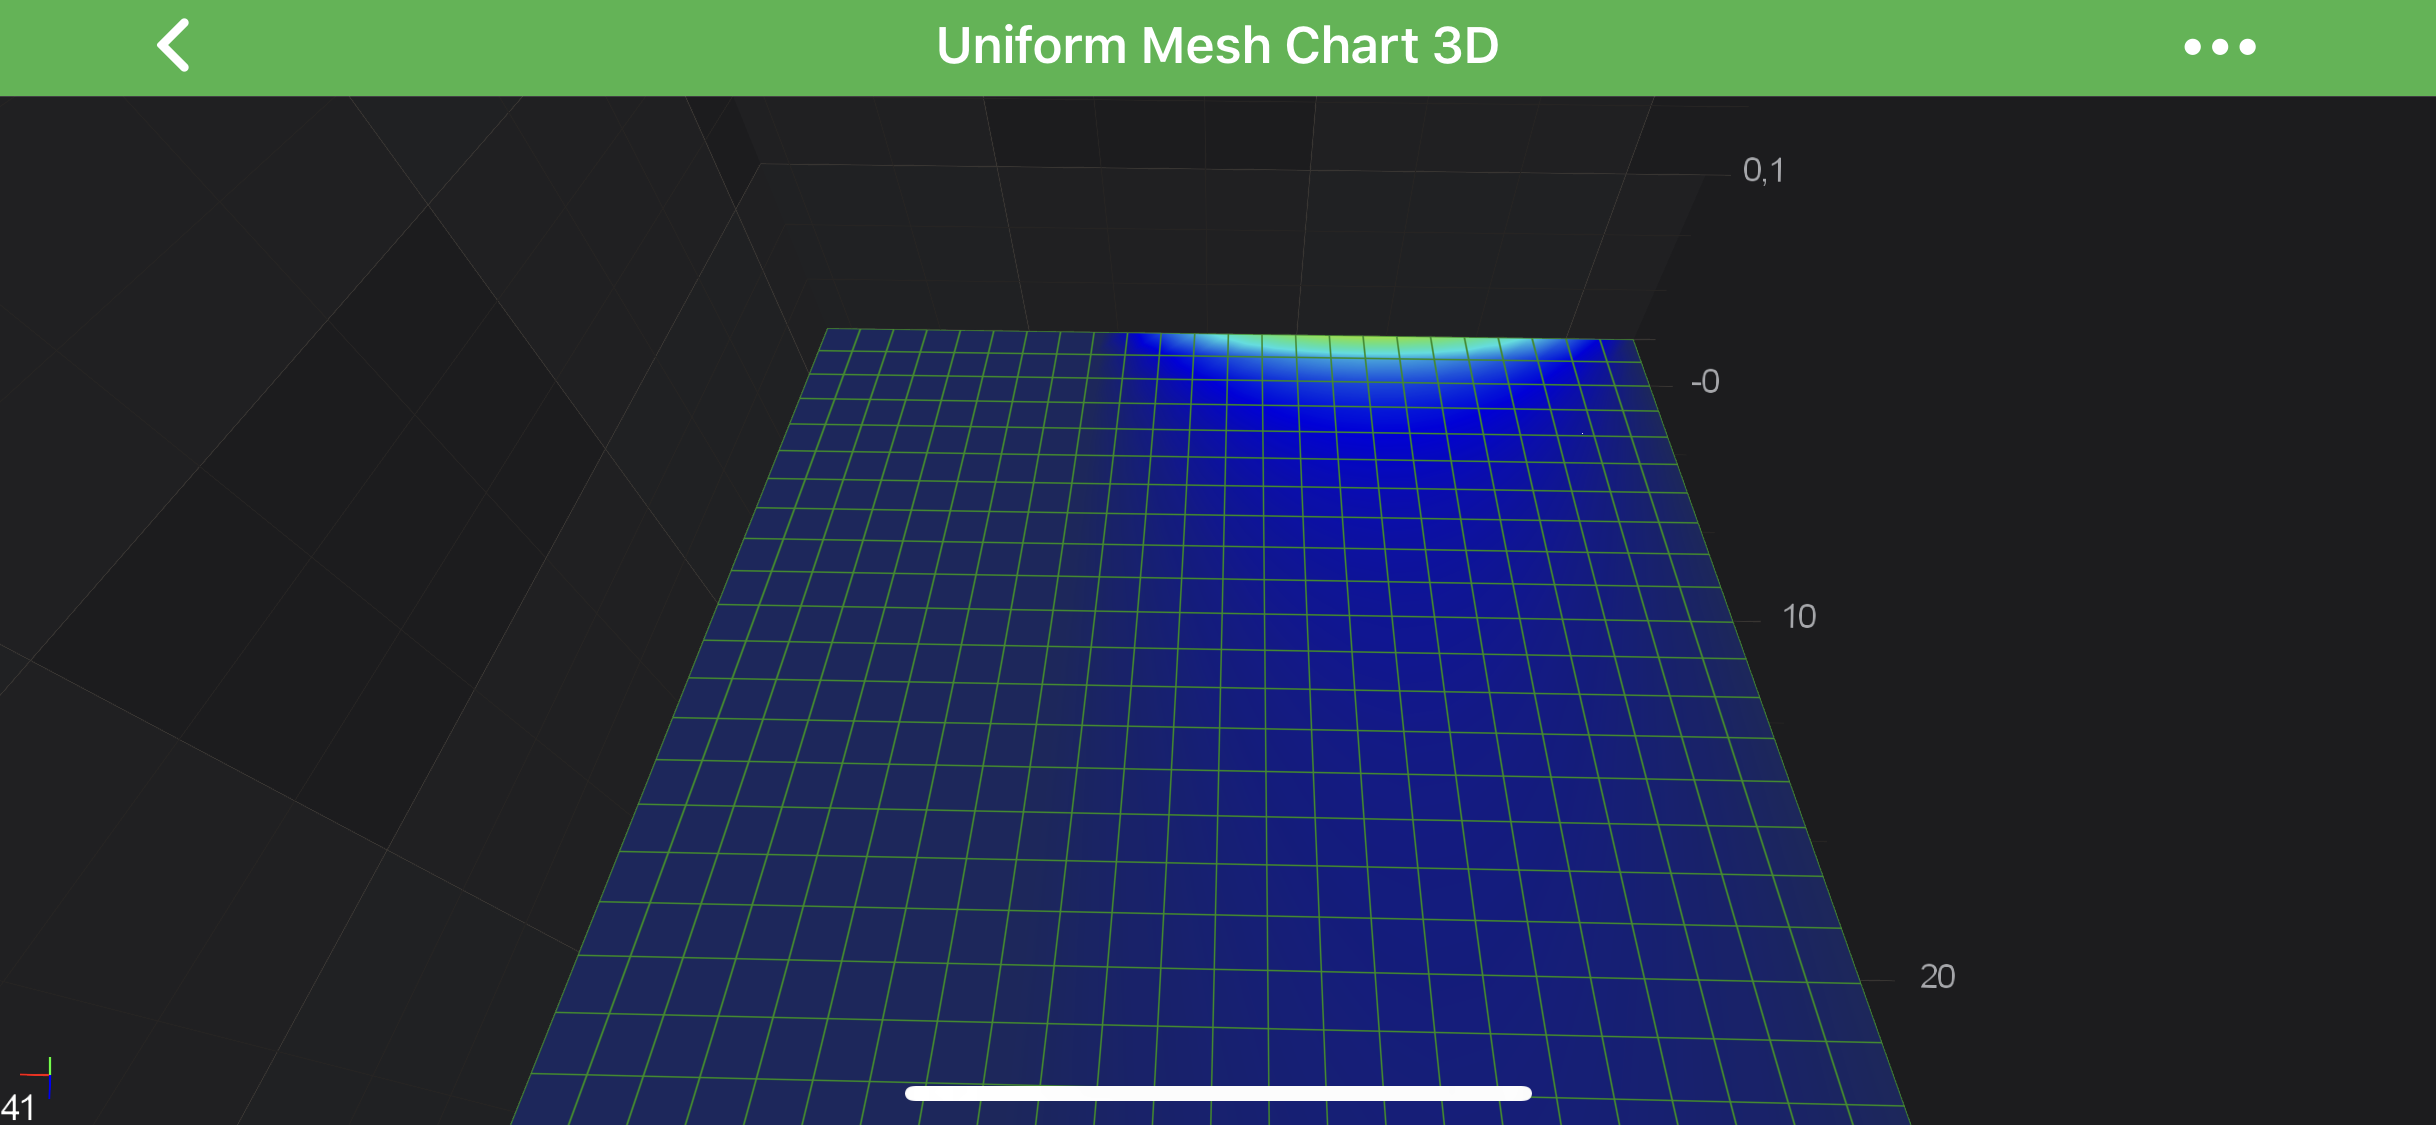 |
 |
Applying Palettes to the 3D Surface Meshes
The SCISurfaceMeshRenderableSeries3D accepts color palettes via the SCIContourMeshRenderableSeries3DBase.meshColorPalette property.
There are several palettes available out of the box, including the following:
- SCISolidColorBrushPalette - applies a solid color to all cells in the mesh
- SCIGradientColorPalette - maps a linear gradient to the mesh.
- SCIBrushColorPalette - maps a
SCIBrushStyleto the mesh. For example, this can be used to map an image via theSCITextureBrushStyletype. - Custom Palette - maps a custom Texture to the mesh.
Read on to learn more about each of these options.
In addition, rendering all of the above palettes can be affected by the SCIMeshPaletteMode.
See the Mesh Palette Modes section below for more information.
Mesh Palette Modes
The SCIContourMeshRenderableSeries3DBase.meshPaletteMode property changes how the palette is applied to the Mesh.
Possible SCIMeshPaletteMode are listed in the table below:
| Mode | Description |
|---|---|
heightMapInterpolated |
the palette is applied in the Y-direction (vertically). |
heightMapSolidCells |
same as heightMapInterpolated but no interpolation. Use this if you want each cell have a separate colour. |
textured |
palette is applied to the mesh in the XZ plane. Imagine the palette is stretched over the mesh itself. |
texturedSolidCells |
same as textured but no interpolation. Use this if you want each cell have a separate colour. |
Solid Color Palette
The Solid palette if provided by the SCISolidColorBrushPalette class. It’s quite simple, let’s dig into declaration:
Gradient Color Palette
The SCIGradientColorPalette can be used to map a Gradient Brush set of colors to heights in the Surface Mesh.
The mapping is similar to that performed by the Heatmap Series in 2D Charts.
Given the following code:
Colors are mapped onto Y-values as follows:
SCISurfaceMeshRenderableSeries3D.minimumare drawn with the gradient stop color at offset 0.SCISurfaceMeshRenderableSeries3D.maximumare drawn with the gradient stop color at offset 1.- All other values are linearly interpolated (including
Y-Valuesoutside of minimum and maximum values).
It’s also possible to specify whether gradient is stepped or not. See code which creates stepped palette below:
And the difference is showed below:
| Linear Gradient | Stepped Gradient (isStepped = YES) |
|---|---|
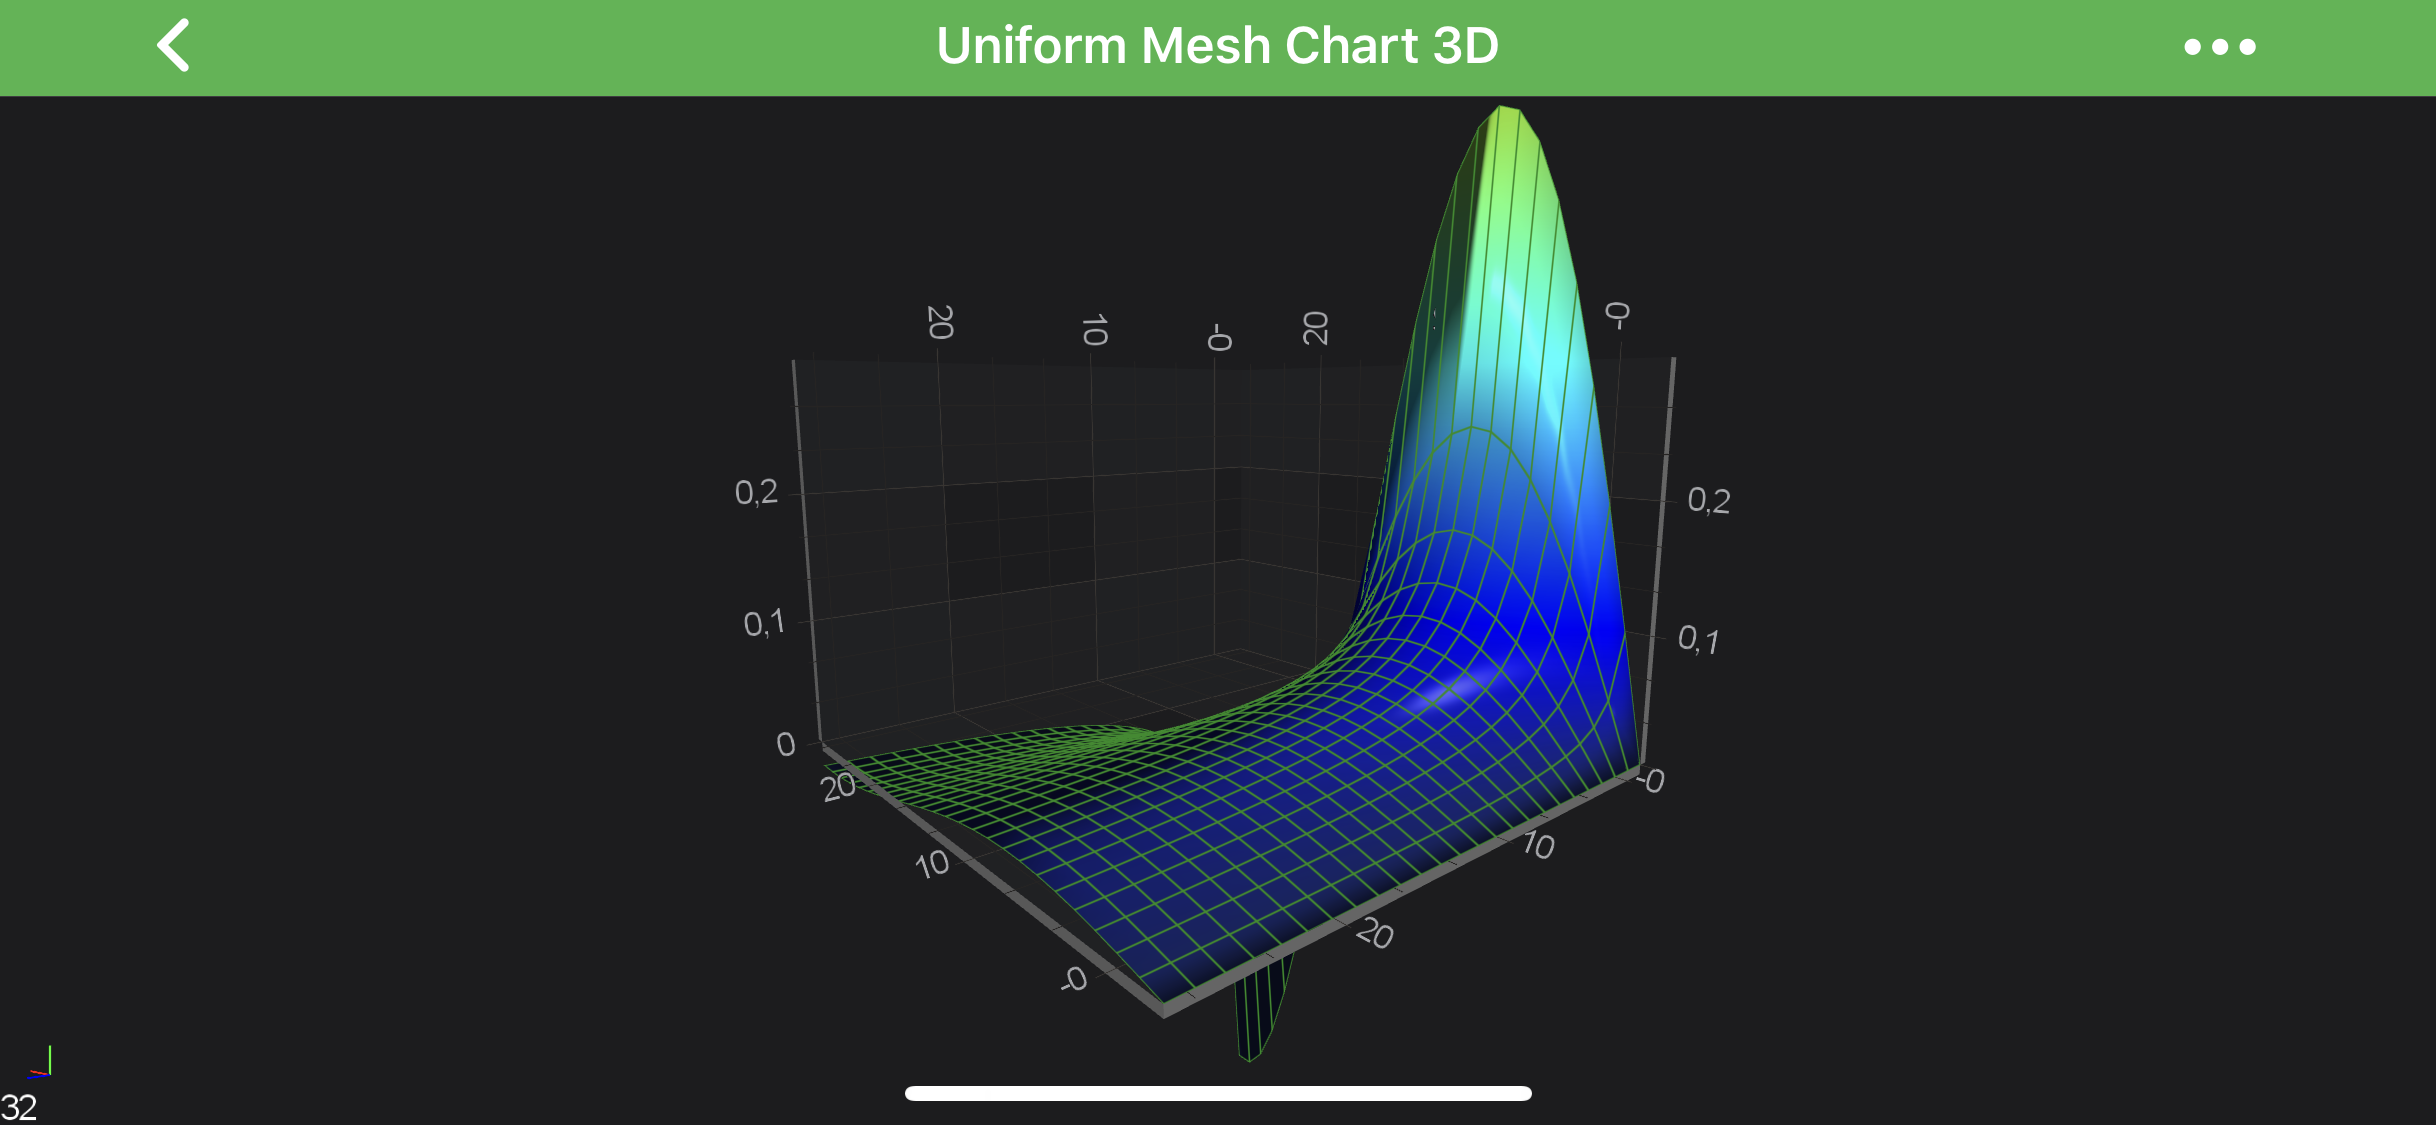 |
 |
Brush Color Palette
A texture can be applied to the SurfaceMesh and mapped over it in the XZ plane plane by using a combination of the following:
SCIBrushColorPaletteSCIMeshPaletteMode.SCIMeshPaletteMode_TexturedSCIContourMeshRenderableSeries3DBase.meshColorPaletteSize
See the code below:
Create a Custom Palette
In addition to all of the above, you can create your own custom Color Palette by inheriting SCIMeshColorPalette and overriding the -[SCIMeshColorPalette getTextureWithWidth:height:] method.
For example, see the following code snippet:
The palette is applied to a SCISurfaceMeshRenderableSeries3D as in the above examples.
NOTE: You might noticed helped extension, which allows to create
ISCITexture2Ddirectly from yourSCIBitmap--[SCIBitmap createTexture]
Surface Mesh 3D Wireframe and Contours
In SciChart, the 3D Surface Mesh can be configured to draw with Contours and/or Wireframe.
That is added optionally ans configured via the SCIContourMeshRenderableSeries3DBase.drawMeshAs property.
See the possible options in the table below:
| Option | Surface | Wireframe | Contours |
|---|---|---|---|
SolidMesh |
+ | ||
Wireframe |
+ | ||
Contours |
+ | ||
SolidWireframe |
+ | + | |
SolidWithContours |
+ | + | |
SolidWireframeWithContours |
+ | + | + |
Wireframe and Contours can be configured via the following properties:
SCIContourMeshRenderableSeries3DBase.contourStrokeThickness- defines the thickness of the contour line.SCIContourMeshRenderableSeries3DBase.contourStroke- defines the stroke color of the contours, which may optionally include opacity.SCIContourMeshRenderableSeries3DBase.contourOffset- defines the offset of contours fromY-values, defaults to 0.SCIContourMeshRenderableSeries3DBase.contourInterval- defines theY-valueintervals between contours.SCIContourMeshRenderableSeries3DBase.strokeThickness- defines the thickness of the wireframe line.SCIContourMeshRenderableSeries3DBase.stroke- defines the stroke color of the wireframe, which may optionally include opacity.
Some examples are shown below:
| Bare Wireframe | Solid Surface With Contours |
|---|---|
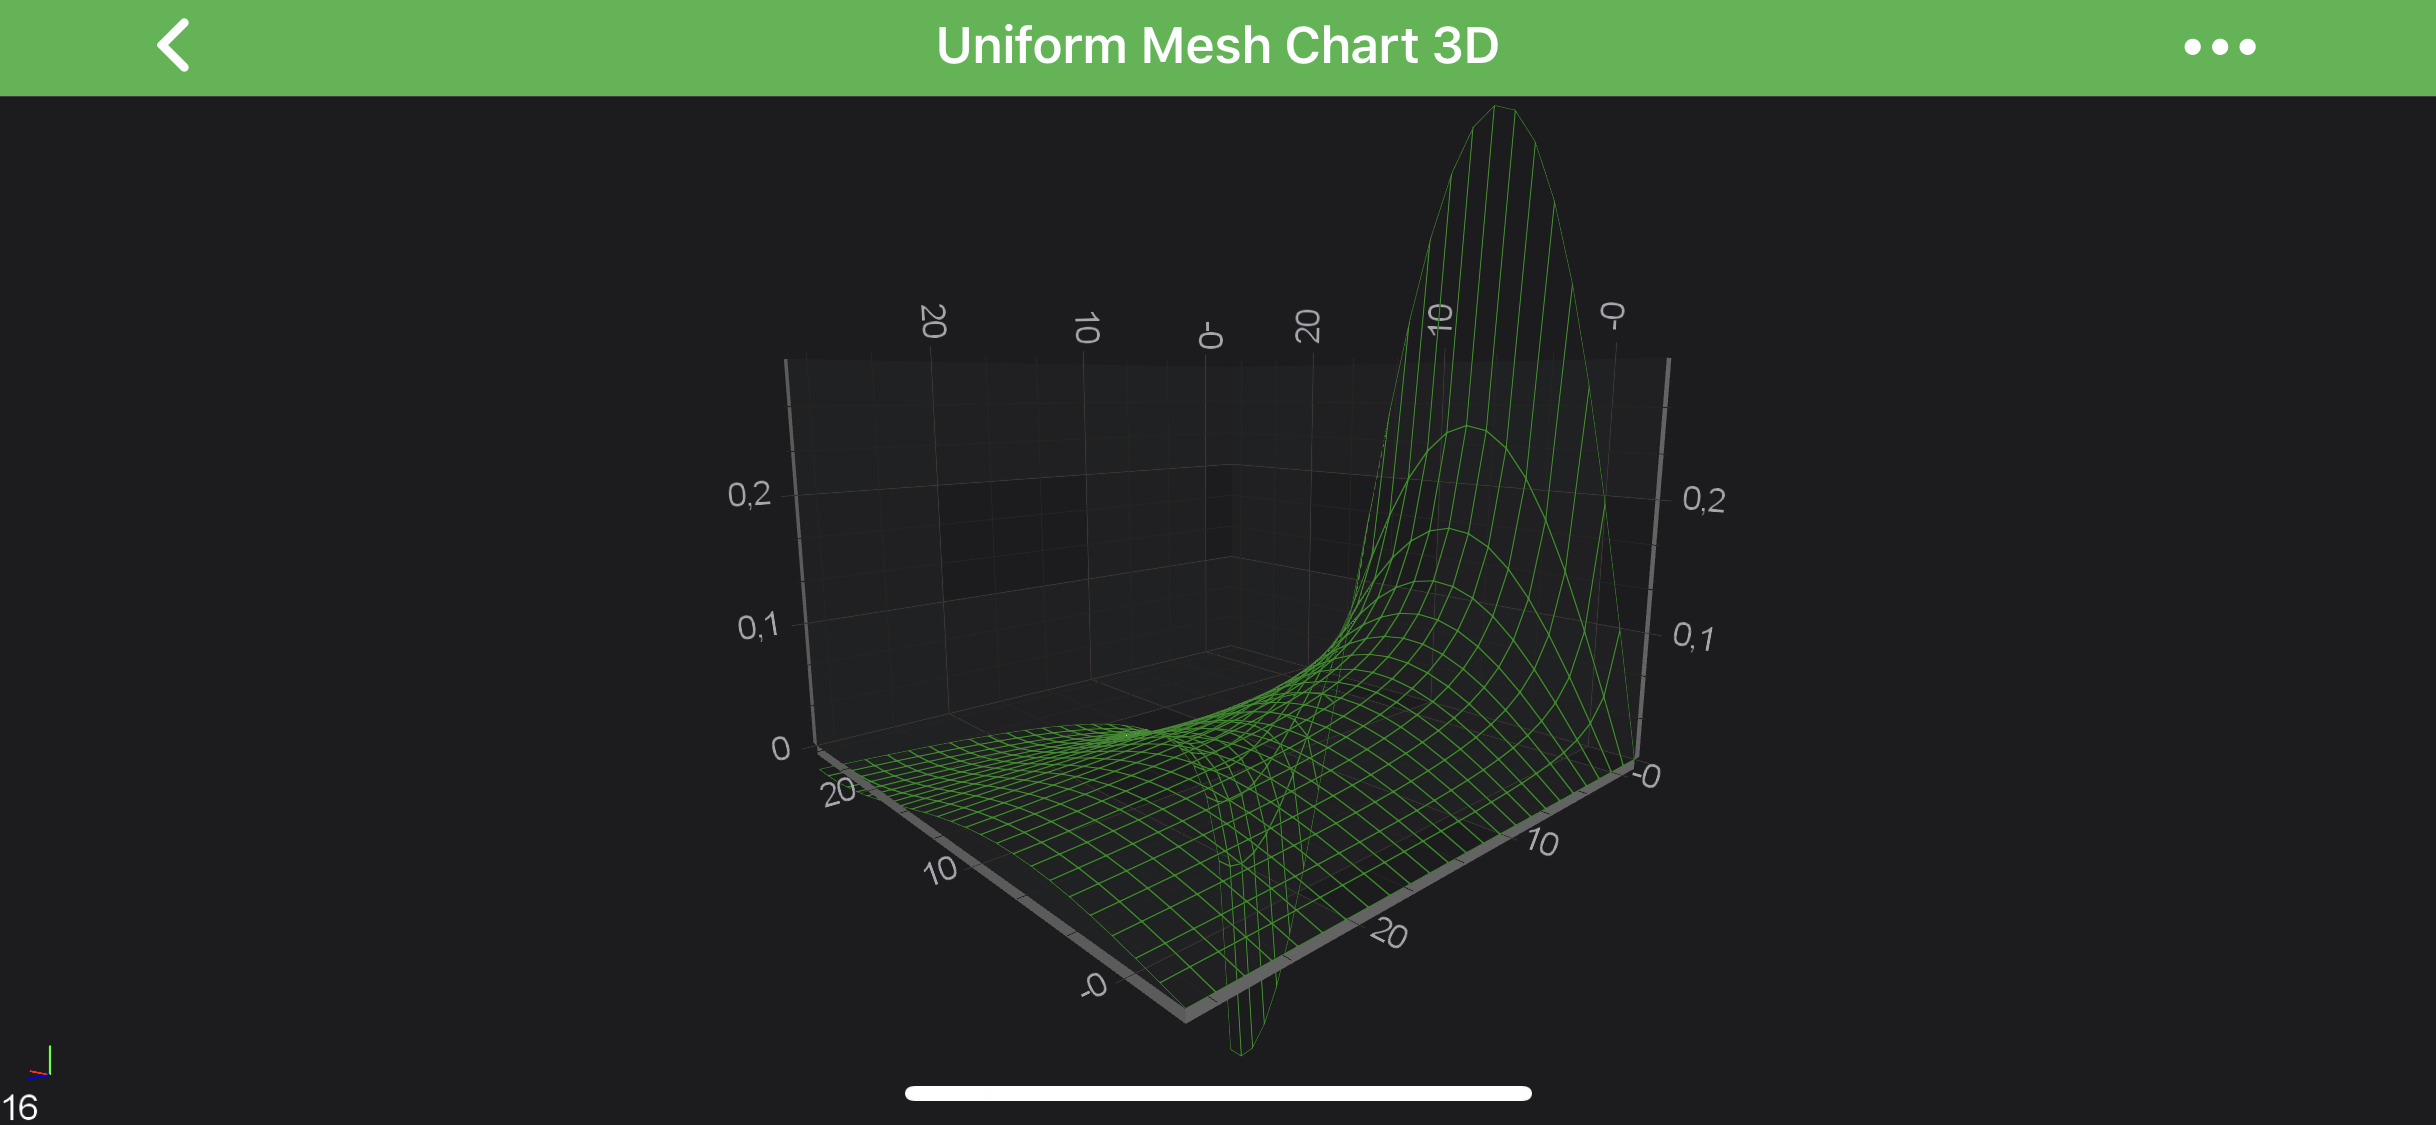 |
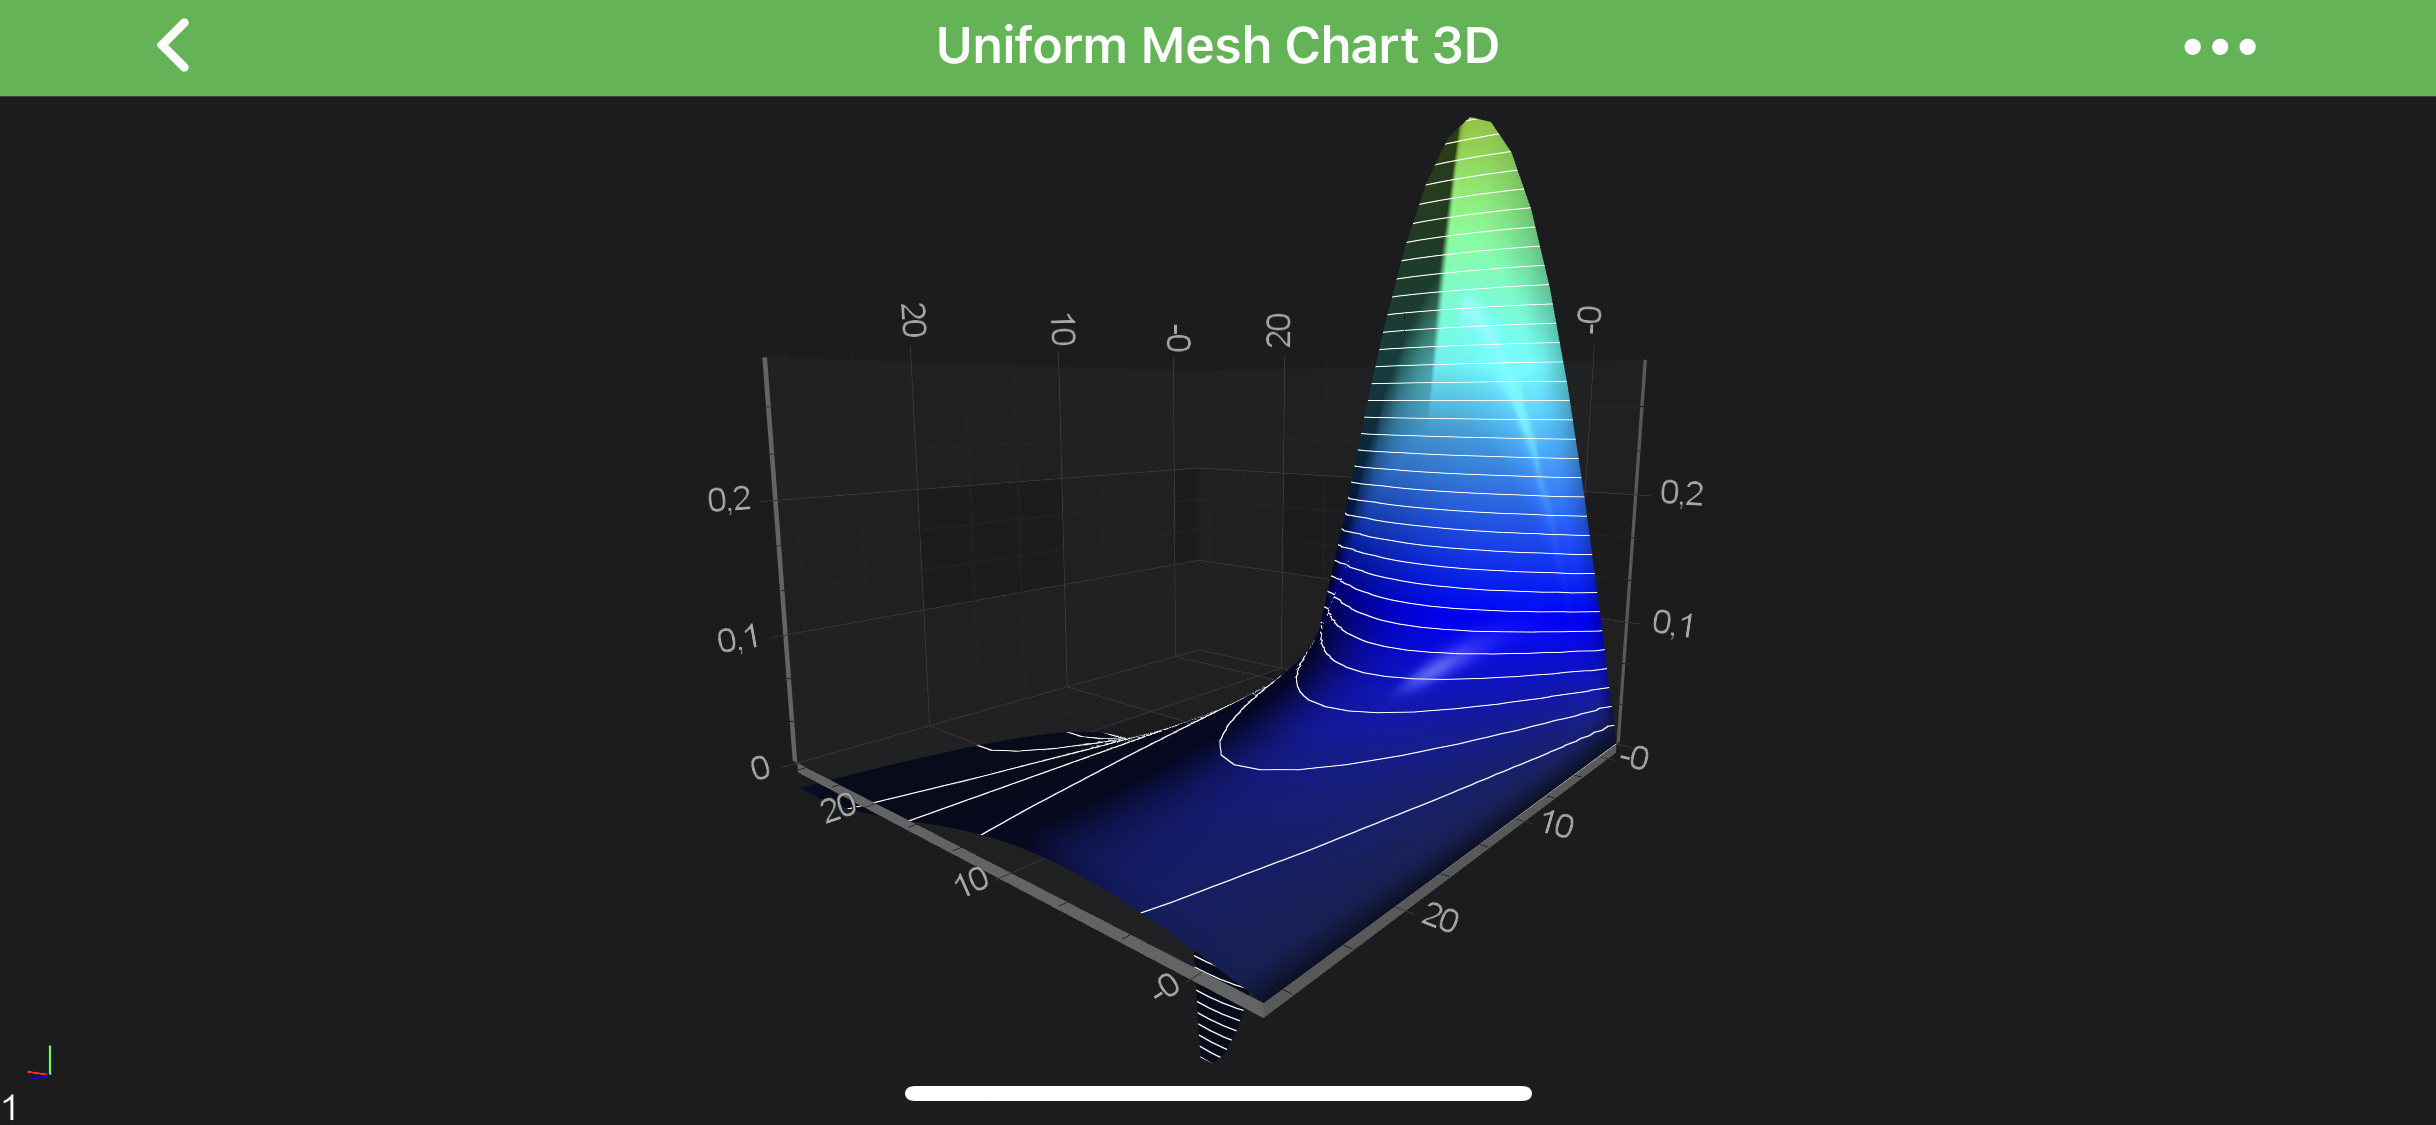 |
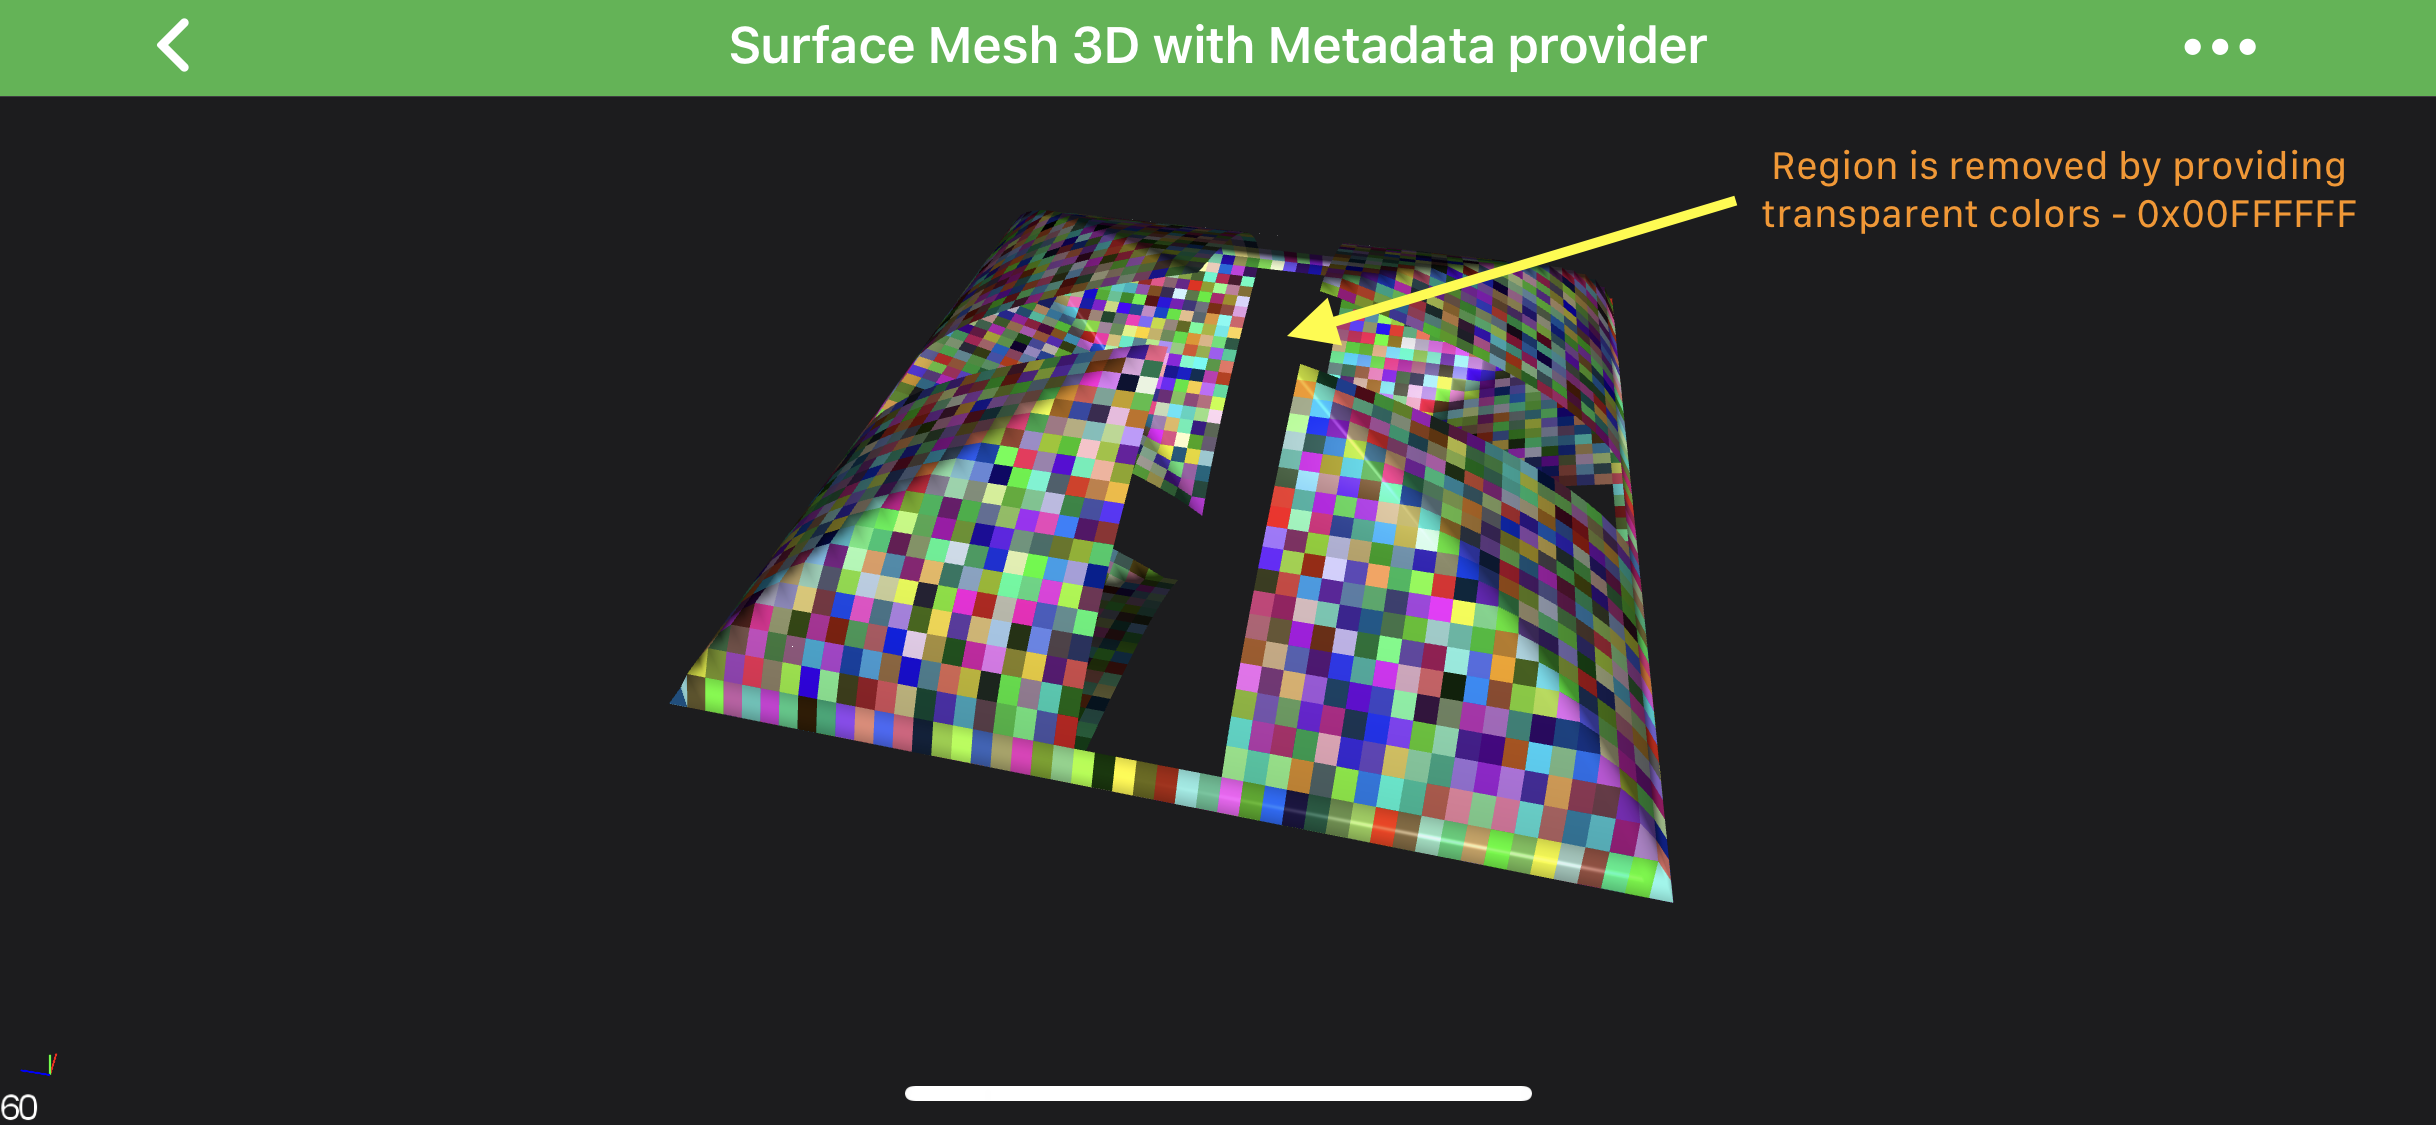
Overriding Surface Mesh 3D Specific Cell Colors
In addition to the custom palettes, heightmaps, textures - you can override a specific cell or cells in the SCISurfaceMeshRenderableSeries3D by using the MetadataProvider API.
For example it can be used for one of the following:
- remove specific cells or mark them as NULL by overriding the cell color to be Transparent.
- mark regions of interest, say certain cells in a value range, or with index must be colored differently.
- with higher resolution meshes, you can change the shape of the mesh to circular (approx) by removing cells outside of a region.
It is showcased in our Surface mesh 3D with Metadata provider example. Let’s see a code snippet from it, which shows how to implement the custom MetadataProvider:
NOTE: For more information about custom MetadataProviders - please refer to the MetadataProvider API article.
NOTE: Examples of using MetadataProvider API can be found in the SciChart iOS Examples Suite as well as on GitHub: