 View on GitHub
iOS & macOS Charting Documentation - SciChart iOS & macOS Charts SDK v4.x
Axis APIs - Value Axis vs. Category Axis
SciChart 2D iOS Features several axis types which could be Value or Category. All inherit from SCIAxisBase.
So what’s the difference between Value and Category Axes? An explanation is given below.
Given the data:
| Age (X-Axis) | Cats | Dogs | Fish |
|---|---|---|---|
| 1 | 7 | 7 | 8 |
| 9 | 6 | 5 | 7 |
| 10 | 5 | 4 | 3 |
| 20 | 4 | 3 | 2 |
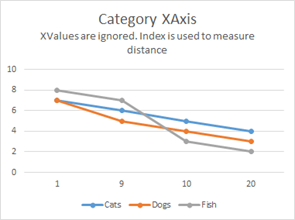
A Value X-Axis and Category X-Axis would display the data differently:
| Category X-Axis | Value X-Axis |
|---|---|
 |
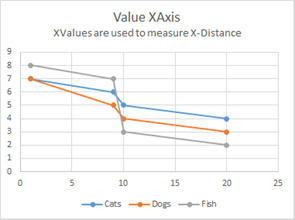 |
The fundamental difference is a Value-Axis uses the X-Value to compute distance on the XAxis, whereas a Category-Axis uses the X-Index. Value-Axis are primarily used in scientific software where Category–Axis are typically used in financial software (e.g. stock charts).
SciChart features both Value-Axis and Category-Axis types.
| Axis Type | Value or Category Axis |
|---|---|
| SCINumericAxis | Value Axis |
| SCILogarithmicNumericAxis | Value Axis |
| SCIDateAxis | Value Axis |
| SCIIndexDateAxis | Value Axis |
| SCICategoryDateAxis | Category Axis |
For more information, refer to the Axis APIs article.