In general case, the position of an SCIVerticalLineAnnotation can only be defined by the ISCIAnnotation.x1 value, which will lead to full-height vertical line at X1 coordinate.
Despite the above, it is possible to specify Y1 and Y2 coordinates for the line ends, but it will work differently while combined with different SCIAlignment.
SCIVerticalLineAnnotation.verticalAlignment property can consume the following values:
SCIAlignment.SCIAlignment_Top - the Y1 coordinate will be applied to the bottom end of a line. The line appears pinned to the top side.
SCIAlignment.SCIAlignment_Bottom - the Y1 coordinate will be applied to the top end of a line. The line appears pinned to the bottom side.
// Assume a surface has been created and configured somewhere
id<ISCIChartSurface> surface;
// Create a Vertical Lines
SCIVerticalLineAnnotation *verticalLine1 = [SCIVerticalLineAnnotation new];
SCIVerticalLineAnnotation *verticalLine2 = [SCIVerticalLineAnnotation new];
// Allow to interact with the annotation in run-time
verticalLine1.isEditable = YES;
verticalLine2.isEditable = YES;
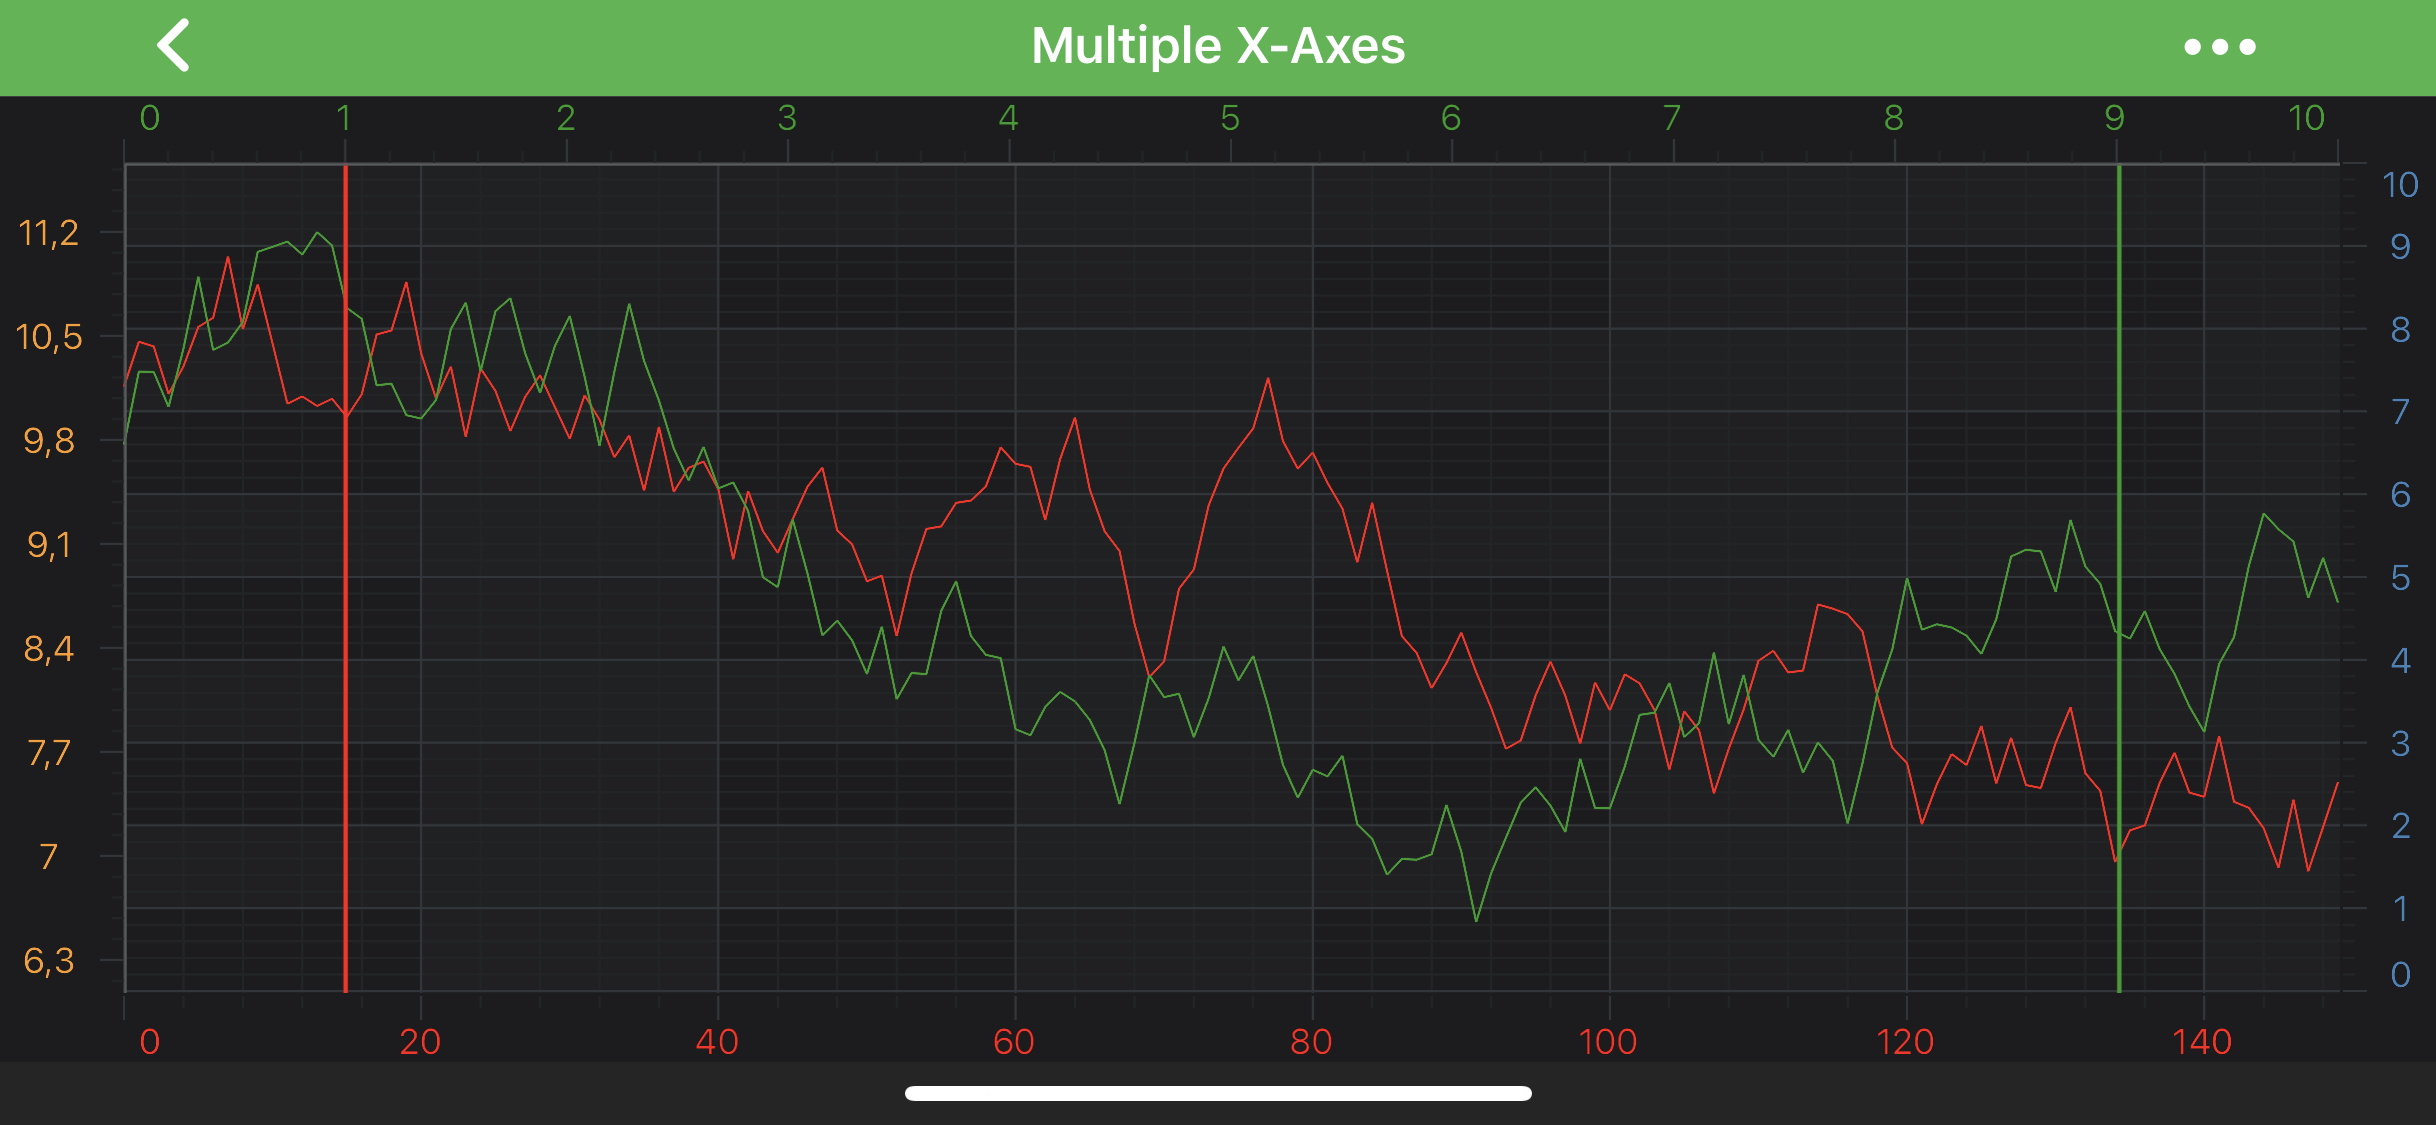
// In a multi-axis scenario, specify the XAxisId and YAxisId
verticalLine1.xAxisId = BottomAxisId;
verticalLine1.yAxisId = RightAxisId;
verticalLine2.xAxisId = BottomAxisId;
verticalLine2.yAxisId = RightAxisId;
// Specify a desired position by setting coordinates and mode
verticalLine1.coordinateMode = SCIAnnotationCoordinateMode_RelativeX;
verticalLine2.coordinateMode = SCIAnnotationCoordinateMode_RelativeX;
verticalLine1.x1 = @(0.1);
verticalLine2.x1 = @(0.9);
// Specify the border color for the annotation
verticalLine1.stroke = [[SCISolidPenStyle alloc] initWithColorCode:0xFFFF1919 thickness:2];
verticalLine2.stroke = [[SCISolidPenStyle alloc] initWithColorCode:0xFF279B27 thickness:2];
// Add the annotation to the Annotations collection of the surface
[self.surface.annotations addAll:verticalLine1, verticalLine2, nil];
// Assume a surface has been created and configured somewhere
let surface: ISCIChartSurface
// Create a Vertical Lines
let verticalLine1 = SCIVerticalLineAnnotation()
let verticalLine2 = SCIVerticalLineAnnotation()
// Allow to interact with the annotation in run-time
verticalLine1.isEditable = true
verticalLine2.isEditable = true
// In a multi-axis scenario, specify the XAxisId and YAxisId
verticalLine1.xAxisId = BottomAxisId
verticalLine1.yAxisId = RightAxisId
verticalLine2.xAxisId = BottomAxisId
verticalLine2.yAxisId = RightAxisId
// Specify a desired position by setting coordinates
verticalLine1.coordinateMode = .relativeX
verticalLine2.coordinateMode = .relativeX
verticalLine1.set(x1: 0.1)
verticalLine2.set(x1: 0.9)
// Specify the stroke color for the annotation
verticalLine1.stroke = SCISolidPenStyle(colorCode: 0xFFFF1919, thickness: 2)
verticalLine2.stroke = SCISolidPenStyle(colorCode: 0xFF279B27, thickness: 2)
// Add the annotation to the Annotations collection of the surface
self.surface.annotations.add(verticalLine1)
self.surface.annotations.add(verticalLine2)
// Assume a surface has been created and configured somewhere
IISCIChartSurface surface;
// Create a Vertical Lines
var verticalLine1 = new SCIVerticalLineAnnotation();
var verticalLine2 = new SCIVerticalLineAnnotation();
// Allow to interact with the annotation in run-time
verticalLine1.IsEditable = true;
verticalLine2.IsEditable = true;
// In a multi-axis scenario, specify the XAxisId and YAxisId
verticalLine1.XAxisId = BottomAxisId;
verticalLine1.YAxisId = RightAxisId;
verticalLine2.XAxisId = BottomAxisId;
verticalLine2.YAxisId = RightAxisId;
// Specify a desired position by setting coordinates
verticalLine1.CoordinateMode = SCIAnnotationCoordinateMode.RelativeX;
verticalLine2.CoordinateMode = SCIAnnotationCoordinateMode.RelativeX;
verticalLine1.X1Value = 0.1;
verticalLine2.X1Value = 0.9;
// Specify the stroke color for the annotation
verticalLine1.Stroke = new SCISolidPenStyle(0xFFFF1919, 2);
verticalLine2.Stroke = new SCISolidPenStyle(0xFF279B27, 2);
// Add the annotation to the Annotations collection of the surface
Surface.Annotations.Add(verticalLine1);
Surface.Annotations.Add(verticalLine2);
NOTE: To learn more about other Annotation Types, available out of the box in SciChart, please find the comprehensive list in the Annotation APIs article.
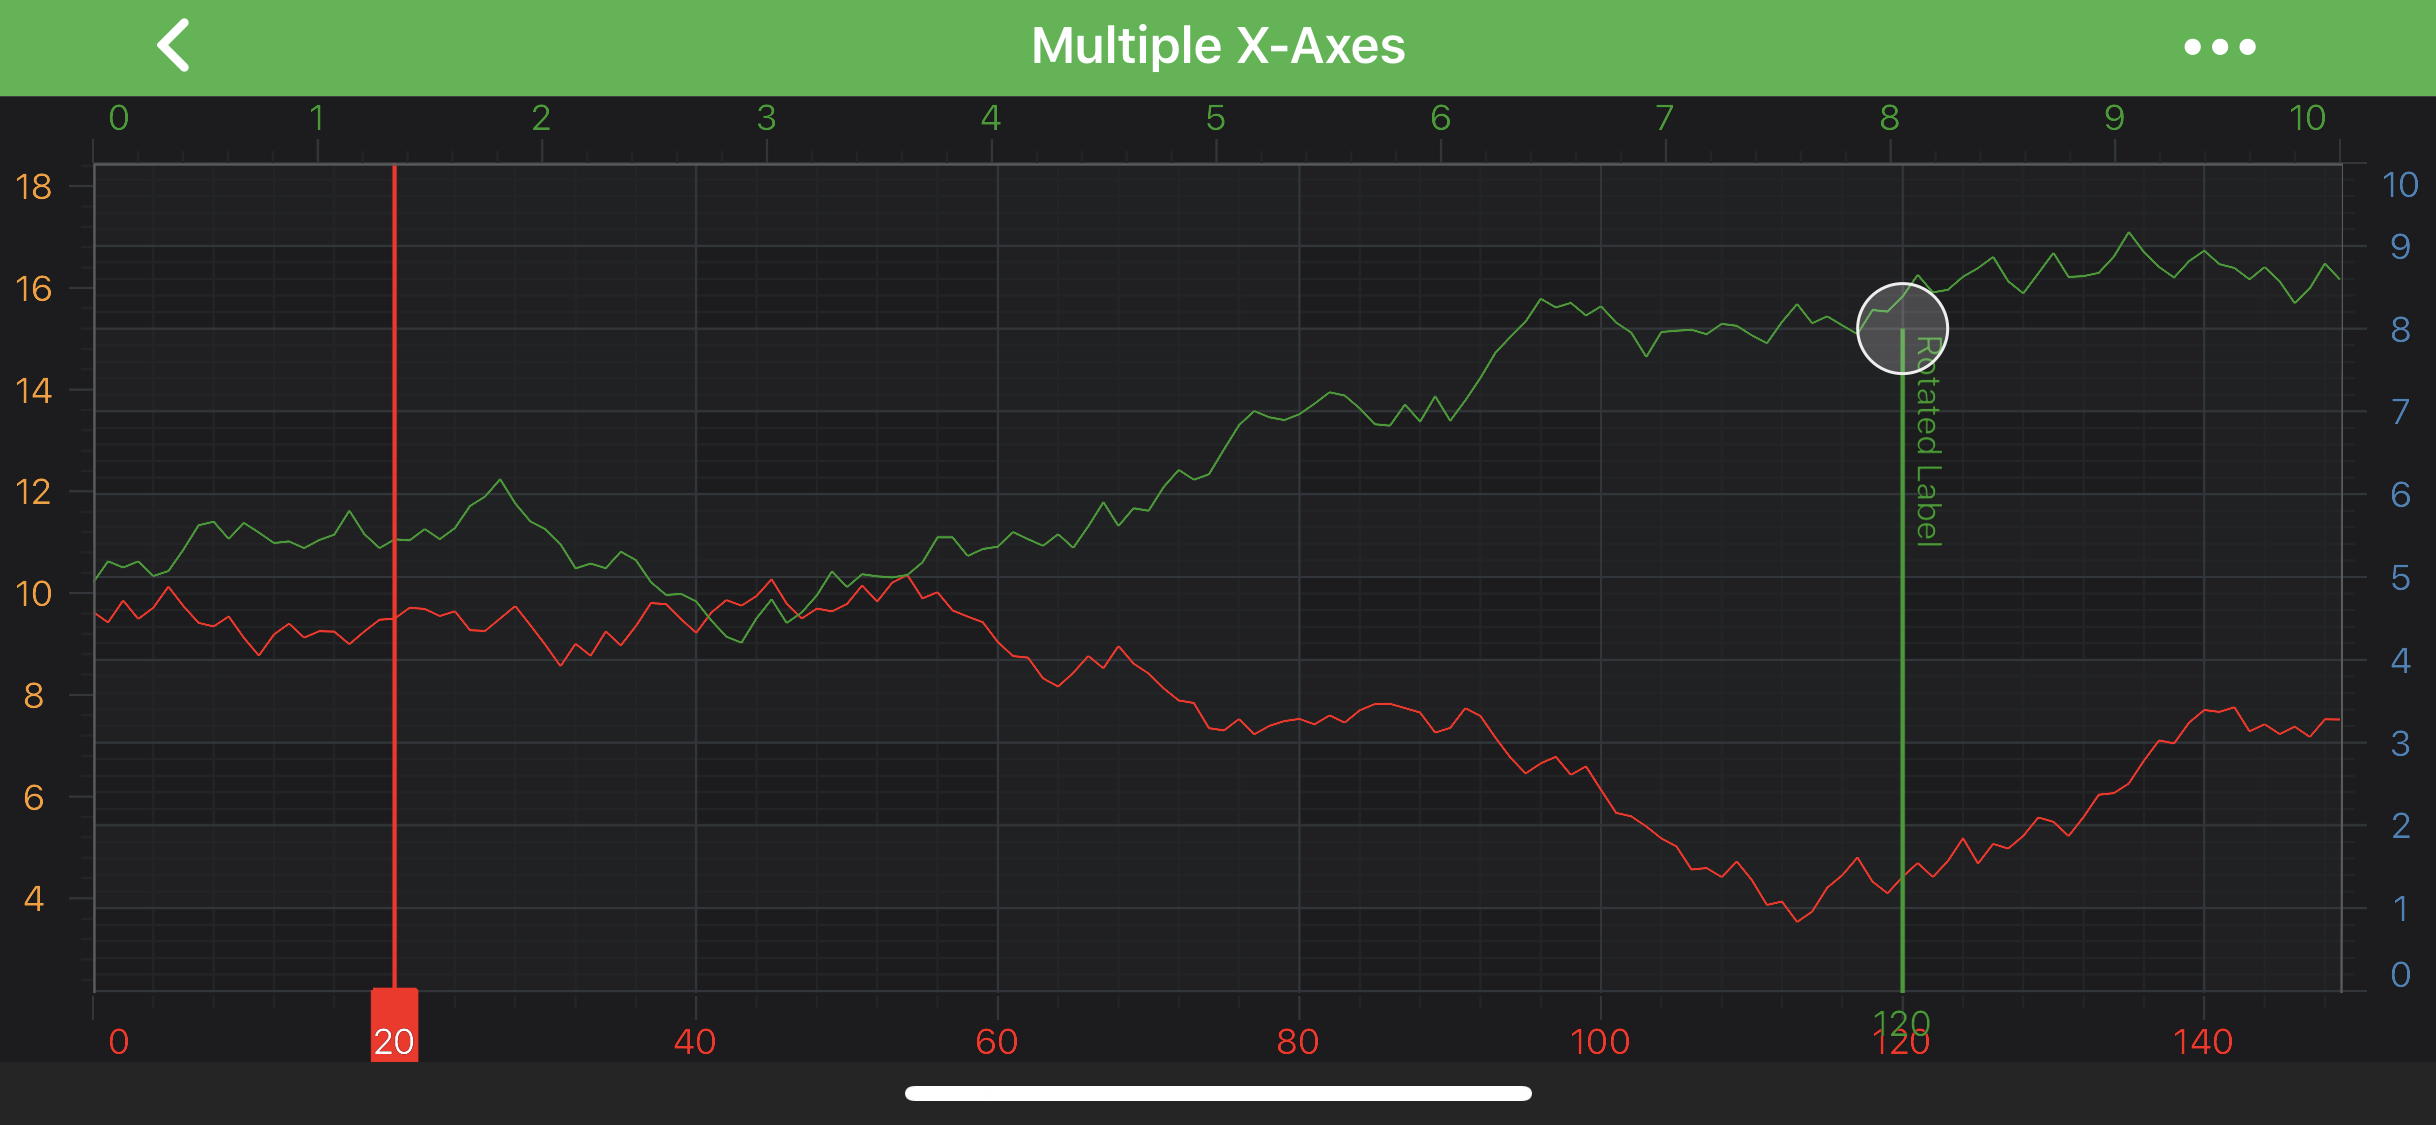
let annotationLabel = SCIAnnotationLabel()
annotationLabel.labelPlacement = .axis
verticalLine.annotationLabels.add(annotationLabel)
var annotationLabel = new SCIAnnotationLabel();
annotationLabel.LabelPlacement = SCILabelPlacement.Axis;
verticalLine.AnnotationLabels.Add(annotationLabel);
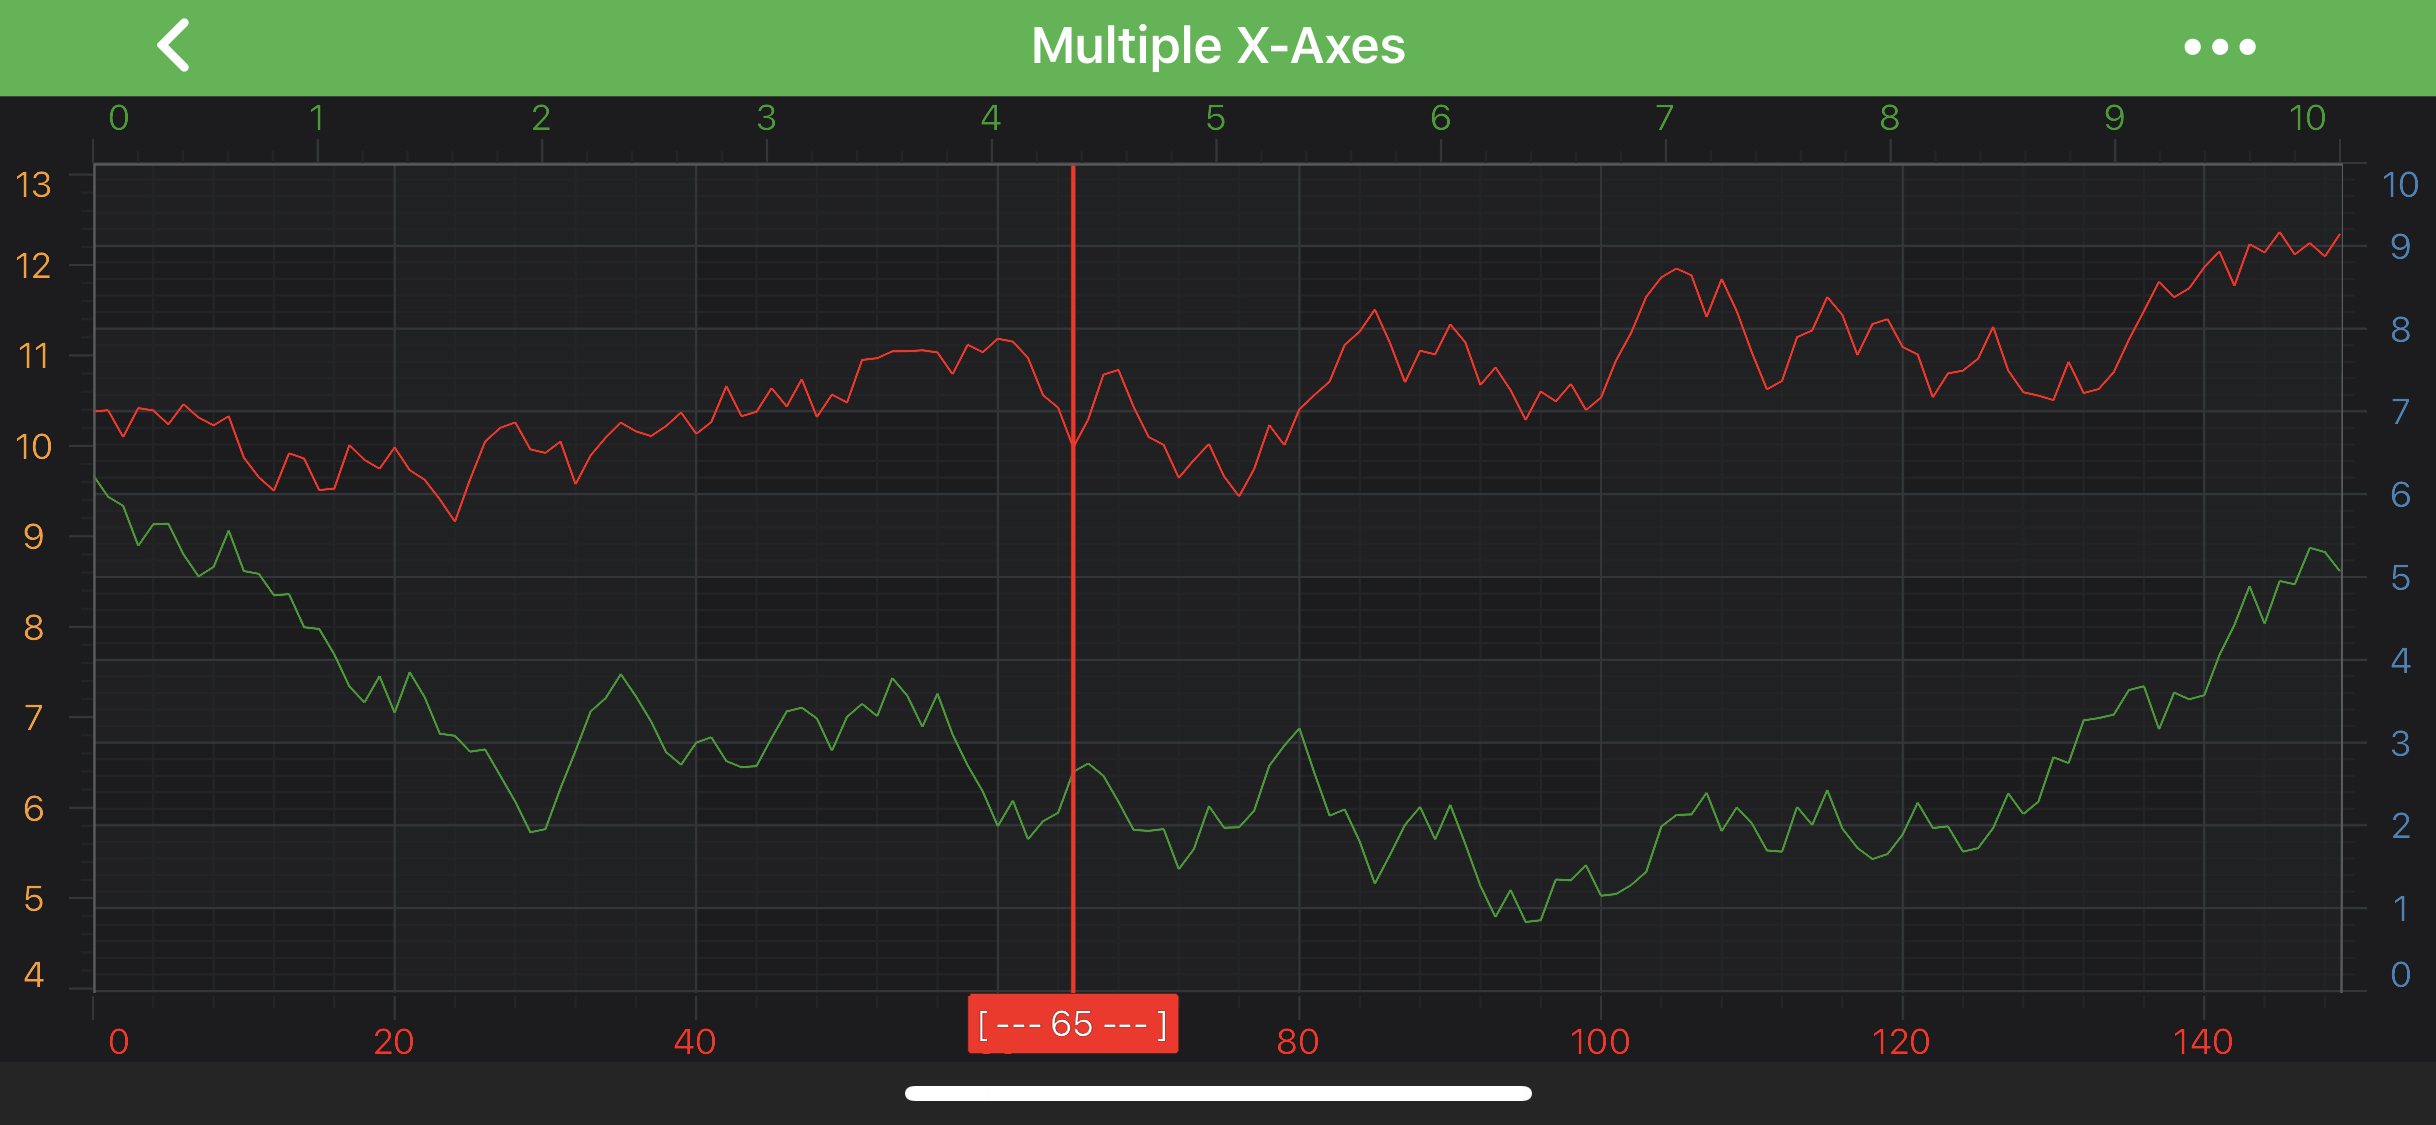
Let’s see a short example which shows how to use the above:
// Declare custom ISCIFormattedValueProvider
@interface AnnotationValueProvider: NSObject<ISCIFormattedValueProvider>
@end
@implementation AnnotationValueProvider
- (id)formatValueWithAxisInfo:(SCIAxisInfo *)axisInfo {
return axisInfo != nil ? [NSString stringWithFormat:@“[ — %@ — ]”, axisInfo.axisFormattedDataValue] : nil;
}
@end
…
// Create a Vertical Lines
SCIVerticalLineAnnotation *verticalLine = [SCIVerticalLineAnnotation new];
// In a multi-axis scenario, specify the XAxisId and YAxisId
verticalLine.xAxisId = BottomAxisId;
verticalLine.yAxisId = RightAxisId;
// Specify a desired position by setting coordinates and mode
verticalLine.x1 = @(65);
// Specify the border color for the annotation
verticalLine.stroke = [[SCISolidPenStyle alloc] initWithColorCode:0xFFFF1919 thickness:2];
// Provide custom ISCIFormattedValueProvider for the annotation
verticalLine.formattedLabelValueProvider = [AnnotationValueProvider new];
// Provide the Axis Label
SCIAnnotationLabel *axisAnnotationLabel = [SCIAnnotationLabel new];
axisAnnotationLabel.labelPlacement = SCILabelPlacement_Axis;
[verticalLine.annotationLabels add:axisAnnotationLabel];
// Add the annotation to the Annotations collection of the surface
[self.surface.annotations add:verticalLine];
// Declare custom ISCIFormattedValueProvider
class AnnotationValueProvider: ISCIFormattedValueProvider {
func formatValue(with axisInfo: SCIAxisInfo!) -> ISCIString! {
return axisInfo != nil ? NSString(string: “[ — \(axisInfo.axisFormattedDataValue!) — ]”) : nil;
}
}
…
// Create a Vertical Lines
let verticalLine = SCIVerticalLineAnnotation()
// In a multi-axis scenario, specify the XAxisId and YAxisId
verticalLine.xAxisId = BottomAxisId
verticalLine.yAxisId = RightAxisId
// Specify a desired position by setting coordinates and mode
verticalLine.set(x1: 65)
// Specify the border color for the annotation
verticalLine.stroke = SCISolidPenStyle(colorCode: 0xFFFF1919, thickness: 2)
// Provide custom ISCIFormattedValueProvider for the annotation
verticalLine.formattedLabelValueProvider = AnnotationValueProvider()
// Provide the Axis Label
let axisAnnotationLabel = SCIAnnotationLabel()
axisAnnotationLabel.labelPlacement = .axis
verticalLine.annotationLabels.add(axisAnnotationLabel)
// Add the annotation to the Annotations collection of the surface
self.surface.annotations.add(verticalLine)
// Declare custom ISCIFormattedValueProvider
class AnnotationValueProvider : ISCIFormattedValueProvider
{
public override IISCIString FormatValueWithAxisInfo(SCIAxisInfo axisInfo)
{
return axisInfo != null ? $“[ — {axisInfo.AxisFormattedDataValue} — ]”.ToSciString() : null;
}
}
…
// Create a Vertical Lines
var verticalLine = new SCIVerticalLineAnnotation();
// In a multi-axis scenario, specify the XAxisId and YAxisId
verticalLine.XAxisId = TopAxisId;
verticalLine.YAxisId = RightAxisId;
// Specify a desired position by setting coordinates
verticalLine.X1Value = 65;
// Specify the stroke color for the annotation
verticalLine.Stroke = new SCISolidPenStyle(0xFFFF1919, 2);
// Provide custom ISCIFormattedValueProvider for the annotation
verticalLine.FormattedLabelValueProvider = new AnnotationValueProvider();
// Provide the Axis Label
var axisAnnotationLabel = new SCIAnnotationLabel();
axisAnnotationLabel.LabelPlacement = SCILabelPlacement.Axis;
verticalLine.AnnotationLabels.Add(axisAnnotationLabel);
// Add the annotation to the Annotations collection of the surface
Surface.Annotations.Add(verticalLine);
This will result in the following:
NOTE: To learn more about other Annotation Types, available out of the box in SciChart, please find the comprehensive list in the Annotation APIs article.
 View on GitHub