Playing around with SciChart iOS Examples Suite is great, but you are probably interested in creating your own application by adding some charts! Let’s get started and create our first SciChart iOS App using Objective C.
Setup XCode project
Assuming you’ve prepared development environment and created “Single View App” in either Objective-C, Swift or even Xamarin.iOS - next step should be integrating SciChart.framework. The easiest way of doing so is by using CocoaPods. Add the following to your Podfile, and then run pod install
source'https://github.com/ABTSoftware/PodSpecs.git'platform:ios,'8.0'use_frameworks!target'YourTargetName'do# Use the latest available Versionpod'SciChart'end
NOTE: You can also get the extensive sample app downloading the SciChart iOS Trial package, which can be used for manual integration of SciChart.framework.
Set the License Key
Before you build and run the application, you will need to apply a trial or purchased license key. You can find full instructions on the page Licensing SciChart iOS.
You can fetch a Trial License Key directly from the Downloads page following instructions from Licensing SciChart iOS. Or, if you have purchased SciChart iOS, you can find the full purchased license keys at your SciChart Account Page.
The root 2D chart view is called the SCIChartSurface. This is the UIKitUIView you will be adding to your applications wherever you need a chart. You can add more than one SCIChartSurface, you can configure them independently, and you can link them together.
Since this is a Quick Start Example, we will use the one instance of SCIChartSurface, so let’s start by declaring one!
Declaring a SciChartSurface Instance
There few ways of adding SCIChartSurface to your application. We will look more closely into the following:
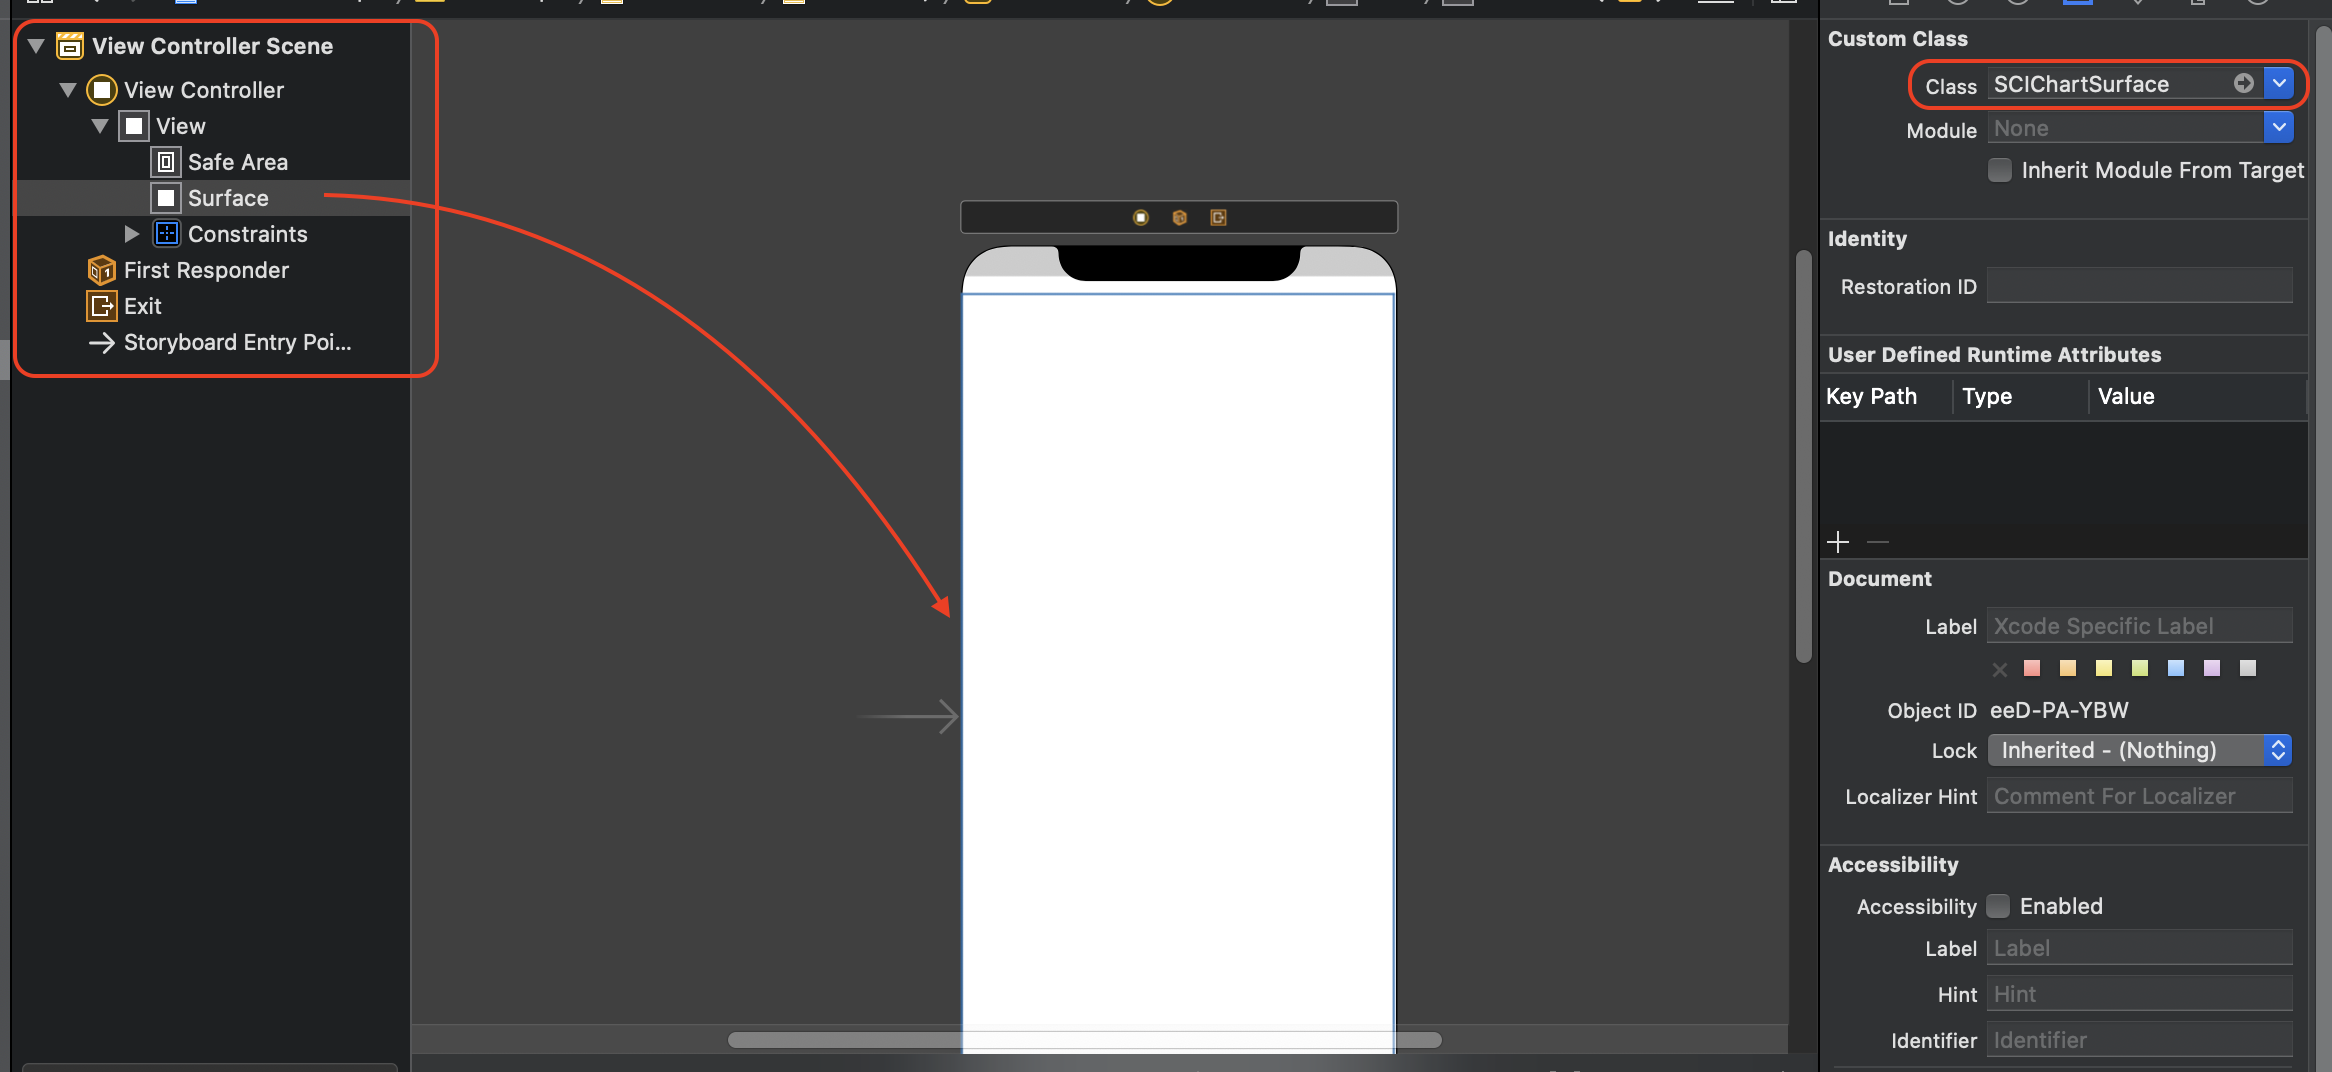
Open up our .storyboard file. Add UIView onto the ViewController and set it’s class to the SCIChartSurface. Then add an IBOutlet for your SCIChartSurface in your ViewController code to be able to manipulate with it later on.
Adding SCIChartSurface purely from code
In your ViewController you will need to import SciChart and instantiate the SCIChartSurface. See the code below:
Once you have added a SCIChartSurface into your ViewController, you will not see anything drawn because you need to add axes.
This is an important thing here - two axes X and Y has to be added to your surface. This is a bare minimum to see a drawn grid on your device.
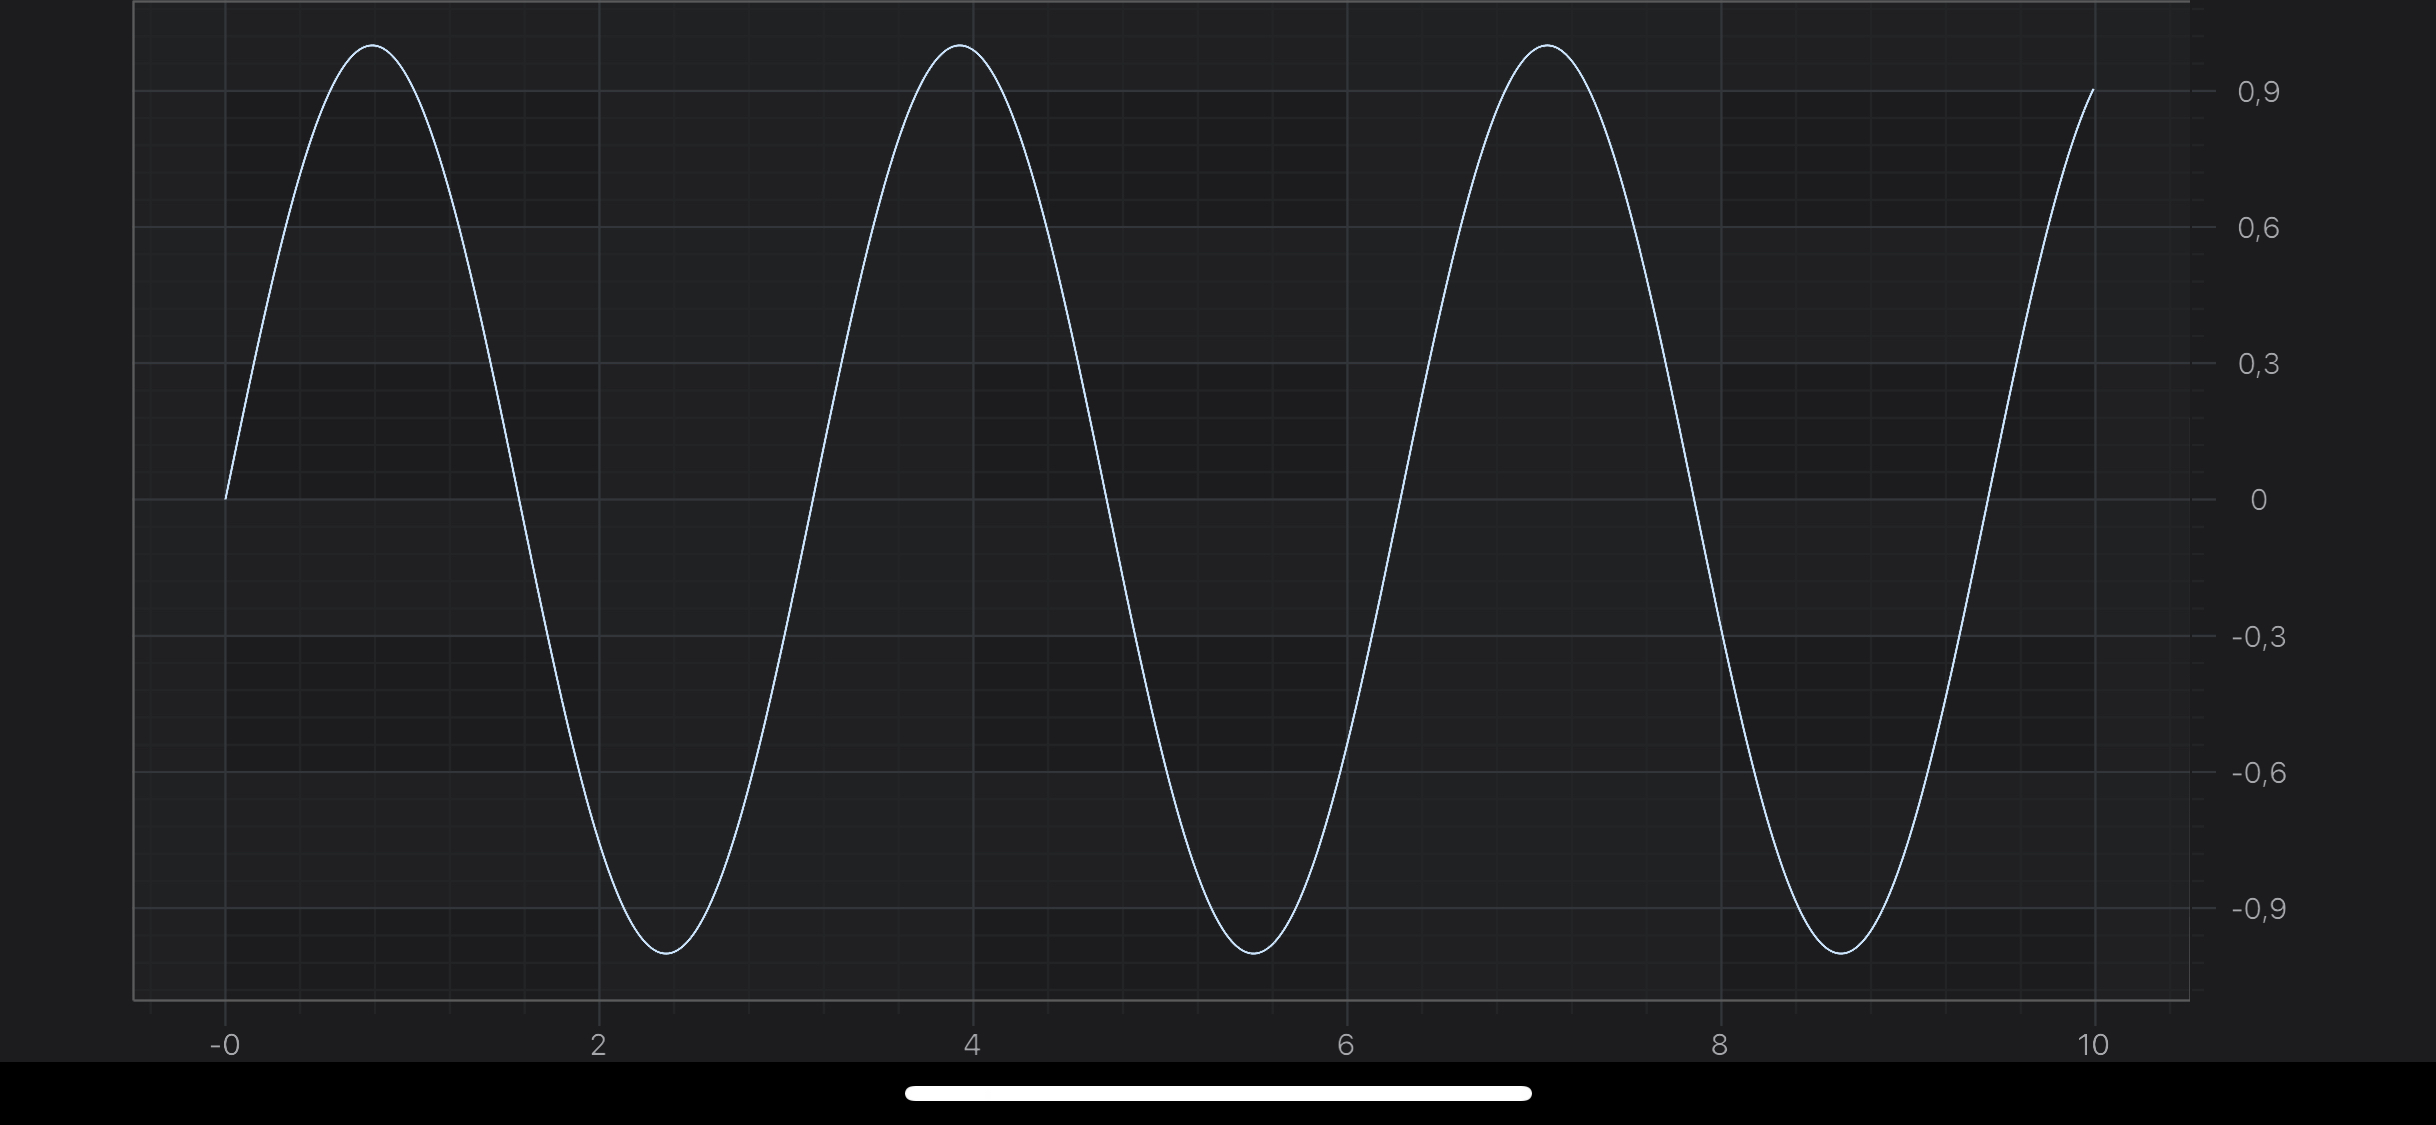
Now, we would like to see something more than just an empty grid, e.g. Line Chart.
So let’s add some RenderableSeries with appropriate DataSeries to our surface:
const int count = 1000;
SCIDoubleValues *xValues = [[SCIDoubleValues alloc] initWithCapacity:count];
SCIDoubleValues *yValues = [[SCIDoubleValues alloc] initWithCapacity:count];
for (int i = 0; i < count; i++) {
double x = 10.0 * i / count;
double y = sin(2 * x);
[xValues add:x];
[yValues add:y];
}
id<ISCIXyDataSeries> dataSeries = [[SCIXyDataSeries alloc] initWithXType:SCIDataType_Double yType:SCIDataType_Double];
[dataSeries appendValuesX:xValues y:yValues];
id<ISCIRenderableSeries> rSeries = [SCIFastLineRenderableSeries new];
rSeries.dataSeries = dataSeries;
[self.surface.renderableSeries add:rSeries];
let count = 1000
let xValues = SCIDoubleValues(capacity: count)
let yValues = SCIDoubleValues(capacity: count)
for i in 0 ..< count {
let x: Double = 10.0 * Double(i) / Double(count)
let y: Double = sin(2 * x)
xValues.add(x)
yValues.add(y)
}
let dataSeries = SCIXyDataSeries(xType: .double, yType: .double)
dataSeries.append(x: xValues, y: yValues)
let renderableSeries = SCIFastLineRenderableSeries()
renderableSeries.dataSeries = dataSeries
self.surface.renderableSeries.add(renderableSeries)
var count = 1000;
var xValues = new SCIDoubleValues(count);
var yValues = new SCIDoubleValues(count);
for (int i = 0; i < count; i++)
{
var x = 10.0 * i / count;
var y = Math.Sin(2 * x);
xValues.Add(x);
yValues.Add(y);
}
var dataSeries = new XyDataSeries();
dataSeries.AppendValues(xValues, yValues);
var renderableSeries = new SCIFastLineRenderableSeries();
renderableSeries.DataSeries = dataSeries;
Surface.RenderableSeries.Add(renderableSeries);
NOTE: You might have noticed, that we used SCIDoubleValues while appending points to ISCIXyDataSeries. That’s the recommended way of appending data, due to better performance, comparing to adding points one by one. You can use -[ISCIXyDataSeries appendX:y:] if you want though.
Final example code
So let’s see what we’ve managed to get. Let’s see the listing from the ViewController below:
import UIKit
import SciChart
class ViewController: UIViewController {
// Surface is added in Storyboard
@IBOutlet weak var surface: SCIChartSurface!
override func viewDidLoad() {
super.viewDidLoad()
let xAxis = SCINumericAxis()
xAxis.growBy = SCIDoubleRange(min: 0.05, max: 0.05)
let yAxis = SCINumericAxis()
yAxis.growBy = SCIDoubleRange(min: 0.05, max: 0.05)
let count = 1000
let xValues = SCIDoubleValues(capacity: count)
let yValues = SCIDoubleValues(capacity: count)
for i in 0 ..< count {
let x: Double = 10.0 * Double(i) / Double(count)
let y: Double = sin(2 * x)
xValues.add(x)
yValues.add(y)
}
let dataSeries = SCIXyDataSeries(xType: .double, yType: .double)
dataSeries.append(x: xValues, y: yValues)
let renderableSeries = SCIFastLineRenderableSeries()
renderableSeries.dataSeries = dataSeries
SCIUpdateSuspender.usingWith(self.surface) {
self.surface.xAxes.add(xAxis)
self.surface.yAxes.add(yAxis)
self.surface.renderableSeries.add(renderableSeries)
}
}
}
public class ViewController : UIViewController
{
// Surface is added in Storyboard
public SCIChartSurface Surface;
public override void ViewDidLoad()
{
base.ViewDidLoad();
var xAxis = new SCINumericAxis { GrowBy = new SCIDoubleRange(0.05, 0.05) };
var yAxis = new SCINumericAxis { GrowBy = new SCIDoubleRange(0.05, 0.05) };
var count = 1000;
var xValues = new SCIDoubleValues(count);
var yValues = new SCIDoubleValues(count);
for (int i = 0; i < count; i++)
{
var x = 10.0 * i / count;
var y = Math.Sin(2 * x);
xValues.Add(x);
yValues.Add(y);
}
var dataSeries = new XyDataSeries();
dataSeries.AppendValues(xValues, yValues);
var renderableSeries = new SCIFastLineRenderableSeries();
renderableSeries.DataSeries = dataSeries;
using (Surface.SuspendUpdates())
{
Surface.XAxes.Add(xAxis);
Surface.YAxes.Add(yAxis);
Surface.RenderableSeries.Add(renderableSeries);
}
}
}
NOTE: Please note that we’ve added axes and renderableSeries to SCIChartSurface inside +[SCIUpdateSuspender usingWithSuspendable:withBlock:] block. This allows you to suspend surface instance, and refresh it only one time after you finished all needed operations. That’s highly recommended technique if you want to omit performance decrease due to triggering refreshes on every operation which could be performed in one batch.
The SCIChartSurface3D Type
The root 3D chart view is called the SCIChartSurface3D. This is the UIKitUIView which you will be adding to your applications wherever you need a 3D chart You can add more than one SCIChartSurface3D, you can configure them independently and you can link them together.
Since this is a Quick Start Example, we will use the one instance of SCIChartSurface3D, so let’s start by declaring one!
Once you have added a SCIChartSurface3D into your ViewController, you will not see anything drawn because you need to add axes.
This is an important thing here - three axes X, Y, and Z has to be added to your surface. This is a bare minimum to see a drawn grid on your device.
Surface.XAxis = new SCINumericAxis3D();
Surface.YAxis = new SCINumericAxis3D();
Surface.ZAxis = new SCINumericAxis3D();
Adding 3D Renderable Series
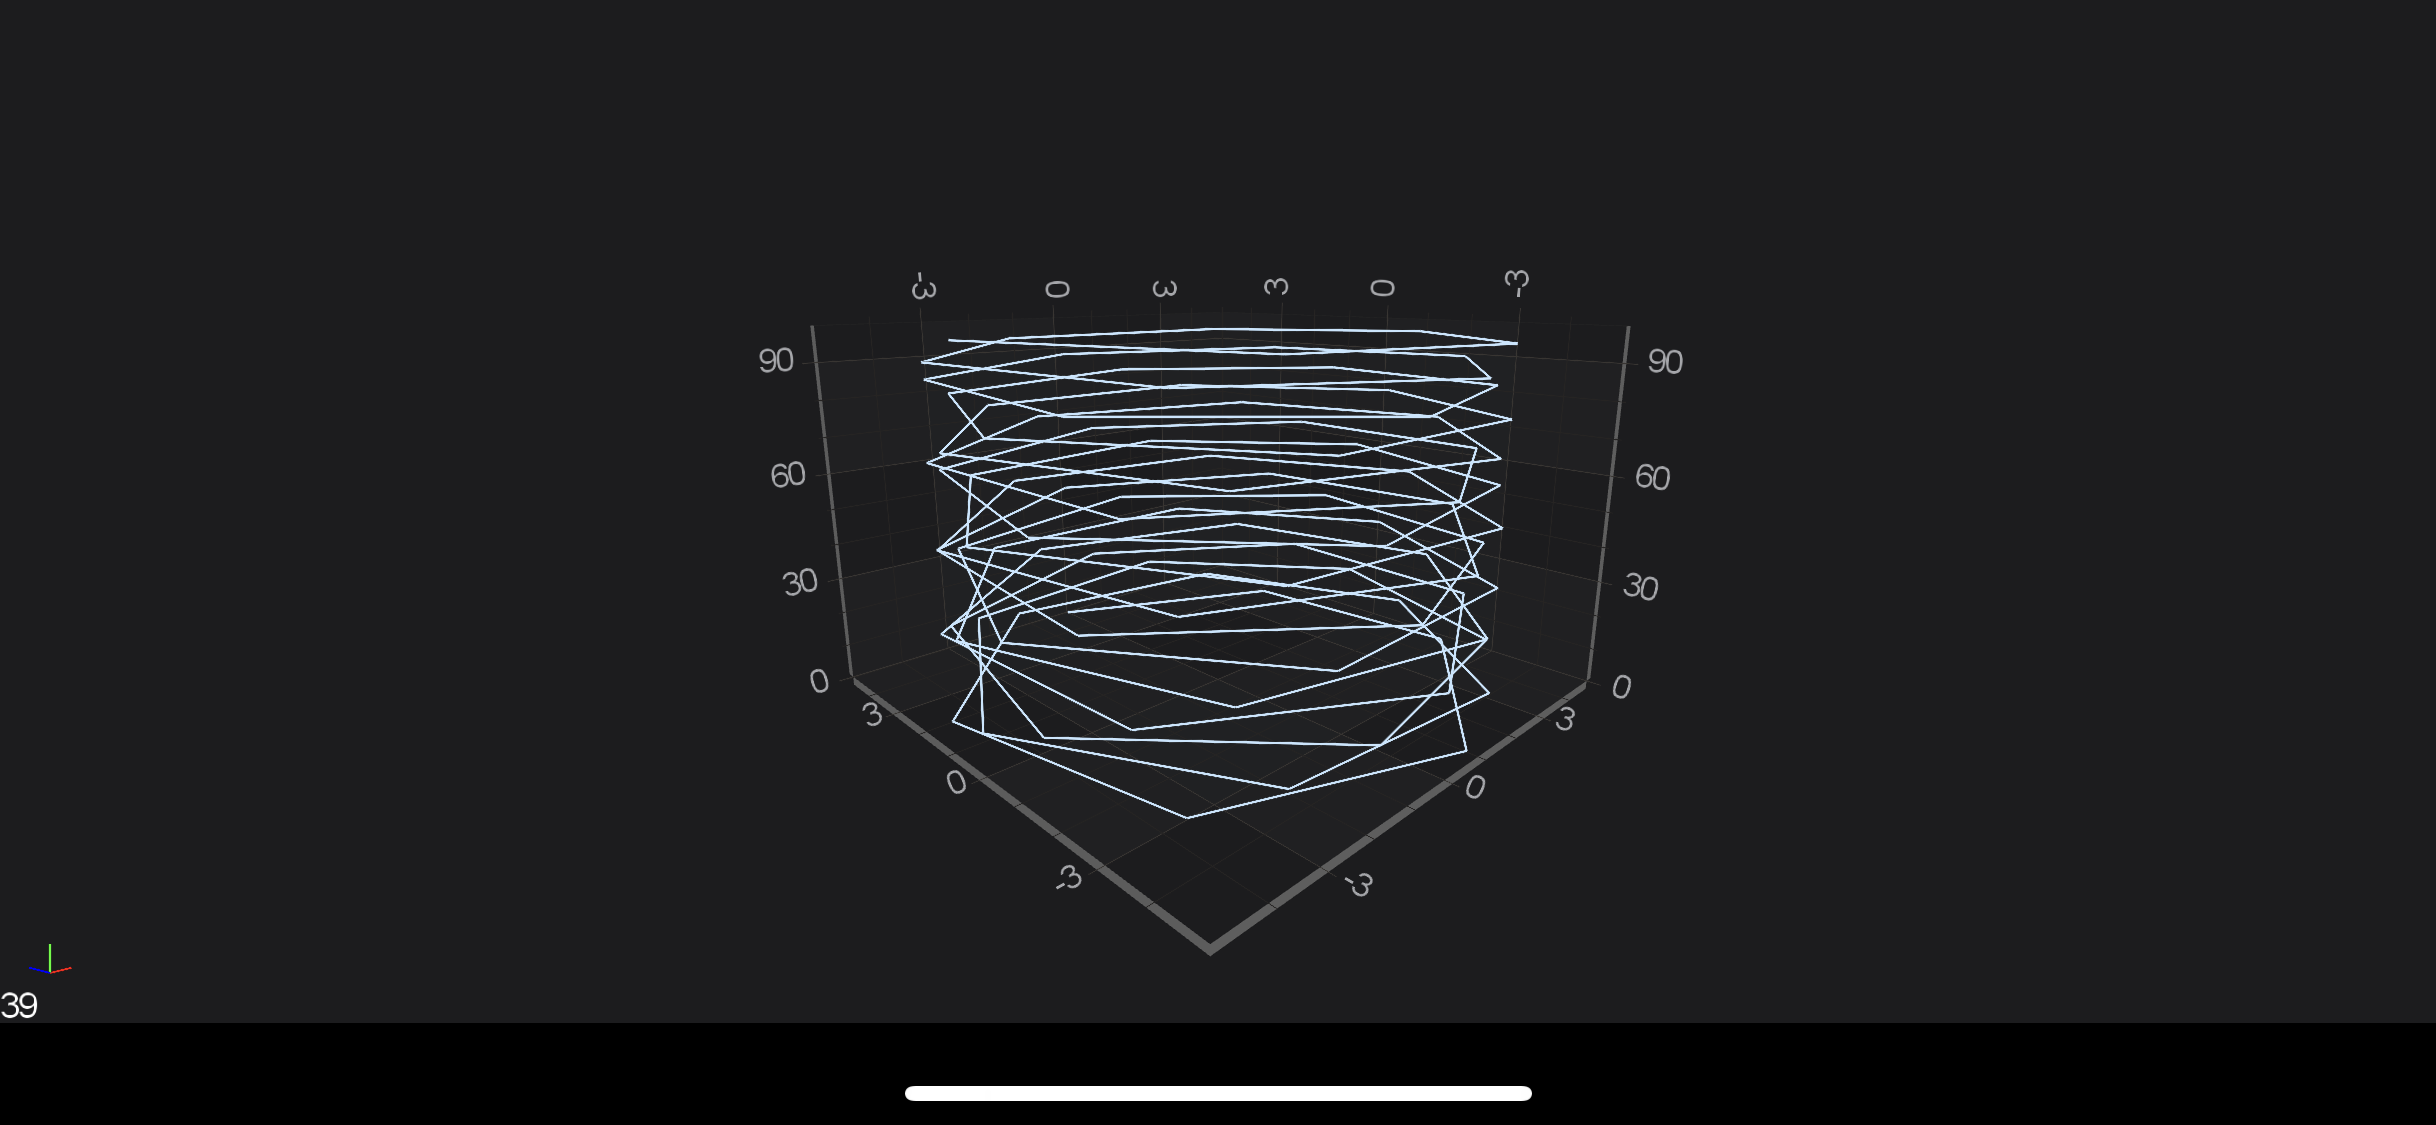
Now, we would like to see something more than just an empty grid, e.g. Scatter 3D Chart.
So let’s add some RenderableSeries3D with appropriate DataSeries 3D to our surface:
SCIXyzDataSeries3D *dataSeries = [[SCIXyzDataSeries3D alloc] initWithXType:SCIDataType_Double yType:SCIDataType_Double zType:SCIDataType_Double];
for (int i = 0; i < 100; ++i) {
double x = 5 * sin(i);
double y = i;
double z = 5 * cos(i);
[dataSeries appendX:@(x) y:@(y) z:@(z)];
}
SCIPointLineRenderableSeries3D *rSeries = [SCIPointLineRenderableSeries3D new];
rSeries.dataSeries = dataSeries;
rSeries.strokeThickness = 3.0;
[self.surface.renderableSeries add:rSeries];
let dataSeries = SCIXyzDataSeries3D(xType: .double, yType: .double, zType: .double)
for i in 0 ..< 100 {
let x = 5 * sin(Double(i))
let y = Double(i)
let z = 5 * cos(Double(i))
dataSeries.append(x: x, y: y, z: z)
}
let rSeries = SCIPointLineRenderableSeries3D()
rSeries.dataSeries = dataSeries
rSeries.strokeThickness = 3.0
self.surface.renderableSeries.add(rSeries)
var dataSeries = new XyzDataSeries3D();
for (int i = 0; i < 100; i++)
{
double x = 5 * Math.Sin(i);
double y = i;
double z = 5 * Math.Cos(i);
dataSeries.Append(x, y, z);
}
var rSeries = new SCIPointLineRenderableSeries3D { DataSeries = dataSeries, StrokeThickness = 3f };
Surface.RenderableSeries.Add(rSeries);
Final example 3D code
So let’s see what we’ve managed to get. Let’s see the listing from the ViewController below:
import UIKit
import SciChart
class ViewController: UIViewController {
// Surface is added in Storyboard
@IBOutlet weak var surface: SCIChartSurface3D!
override func viewDidLoad() {
super.viewDidLoad()
let dataSeries = SCIXyzDataSeries3D(xType: .double, yType: .double, zType: .double)
for i in 0 ..< 100 {
let x = 5 * sin(Double(i))
let y = Double(i)
let z = 5 * cos(Double(i))
dataSeries.append(x: x, y: y, z: z)
}
let rSeries = SCIPointLineRenderableSeries3D()
rSeries.dataSeries = dataSeries
rSeries.strokeThickness = 3.0
SCIUpdateSuspender.usingWith(self.surface) {
self.surface.xAxis = SCINumericAxis3D()
self.surface.yAxis = SCINumericAxis3D()
self.surface.zAxis = SCINumericAxis3D()
self.surface.renderableSeries.add(rSeries)
}
}
}
public class ViewController : UIViewController
{
// Surface is added in Storyboard
public SCIChartSurface3D Surface;
public override void ViewDidLoad()
{
base.ViewDidLoad();
var dataSeries = new XyzDataSeries3D();
for (int i = 0; i < 100; i++)
{
double x = 5 * Math.Sin(i);
double y = i;
double z = 5 * Math.Cos(i);
dataSeries.Append(x, y, z);
}
var rSeries = new SCIPointLineRenderableSeries3D { DataSeries = dataSeries, StrokeThickness = 3f };
using (Surface.SuspendUpdates())
{
Surface.XAxis = new SCINumericAxis3D();
Surface.YAxis = new SCINumericAxis3D();
Surface.ZAxis = new SCINumericAxis3D();
Surface.RenderableSeries.Add(rSeries);
}
}
}
NOTE: Please note that we’ve added axes and renderableSeries to SCIChartSurface3D inside +[SCIUpdateSuspender usingWithSuspendable:withBlock:] block. This allows you to suspend surface instance, and refresh it only one time after you finished all needed operations. That’s highly recommended technique if you want to omit performance decrease due to triggering refreshes on every operation which could be performed in one batch.
We begin by declaring a SurfaceView struct, which conforms to the UIViewRepresentable protocol. Import SciChart, instantiate a SCIChartSurface, add axes, renderable series, and other elements to your SCIChartSurface as described above. Your final code will look something like this:
import SwiftUI
import SciChart
struct SurfaceView: UIViewRepresentable {
func makeUIView(context: Context) -> SCIChartSurface {
let surface = SCIChartSurface()
let xAxis = SCINumericAxis()
xAxis.growBy = SCIDoubleRange(min: 0.05, max: 0.05)
let yAxis = SCINumericAxis()
yAxis.growBy = SCIDoubleRange(min: 0.05, max: 0.05)
let count = 1000
let xValues = SCIDoubleValues(capacity: count)
let yValues = SCIDoubleValues(capacity: count)
for i in 0 ..< count {
let x: Double = 10.0 * Double(i) / Double(count)
let y: Double = sin(2 * x)
xValues.add(x)
yValues.add(y)
}
let dataSeries = SCIXyDataSeries(xType: .double, yType: .double)
dataSeries.append(x: xValues, y: yValues)
let renderableSeries = SCIFastLineRenderableSeries()
renderableSeries.dataSeries = dataSeries
SCIUpdateSuspender.usingWith(self.surface) {
self.surface.xAxes.add(xAxis)
self.surface.yAxes.add(yAxis)
self.surface.renderableSeries.add(renderableSeries)
}
return surface
}
func updateUIView(_ uiView: SCIChartSurface, context: Context) {}
}
Next, place your SurfaceView instance into your ContentView body, same as any other SwiftUI view, like this:
struct ContentView: View {
var body: some View {
SurfaceView()
}
}
SwiftUI helper functions
In the example above, we configure SCIChartSurface the old-fashioned imperative way. But you can turn this code into a set of more readable declarative functions, so it looks similar to any other SwiftUI view modifier.
The last piece of the puzzle is creating a few SCIChartSurfaceView extensions that will modify SCIChartSurface properties - X-Axes, Y-Axes, Renderable Series, and Chart Modifiers:
 View on GitHub