The Custom Free Surface 3D Chart Type
In SciChart, Custom Free Surface 3D Charts are provided by the combination of the Free Surface 3D Series and SCICustomSurfaceDataSeries3D
The location SCICustomSurfaceDataSeries3D
The shape user-defined functions Constructor any possible shape.
Some of the SCICustomSurfaceDataSeries3D Constructor
Radial Distance Function distance from the origin to the particular point on the surface differs.Azimuthal Angle Function azimuthal angle between the particular point and the unit vector of the X-Axis, projected on the XZ plane .Polar Angle Function inclination (or polar angle) between the particular point and the unit vector of the Y-Axis - Zenith
NOTE: U and V coordinates in intervals [uMin...uMax] and [vMin...vMax] respectively are passed as the arguments to each of the three functions above.
X Function position of the particular point on the surface by the X-Axis.Y Function position of the particular point on the surface by the Y-Axis.Z Function position of the particular point on the surface by the Z-Axis.
NOTE: Radial Distance, Radial Distance and Azimuthal Angle are passed as the arguments to each of the three functions above.
More information about the radial distance azimuthal polar angle Spherical coordinate system .
NOTE: Custom Free Surface 3D SciChart iOS Examples Suite as well as on GitHub :
Let’s see some examples of declaring some 3D Free Surfaces :
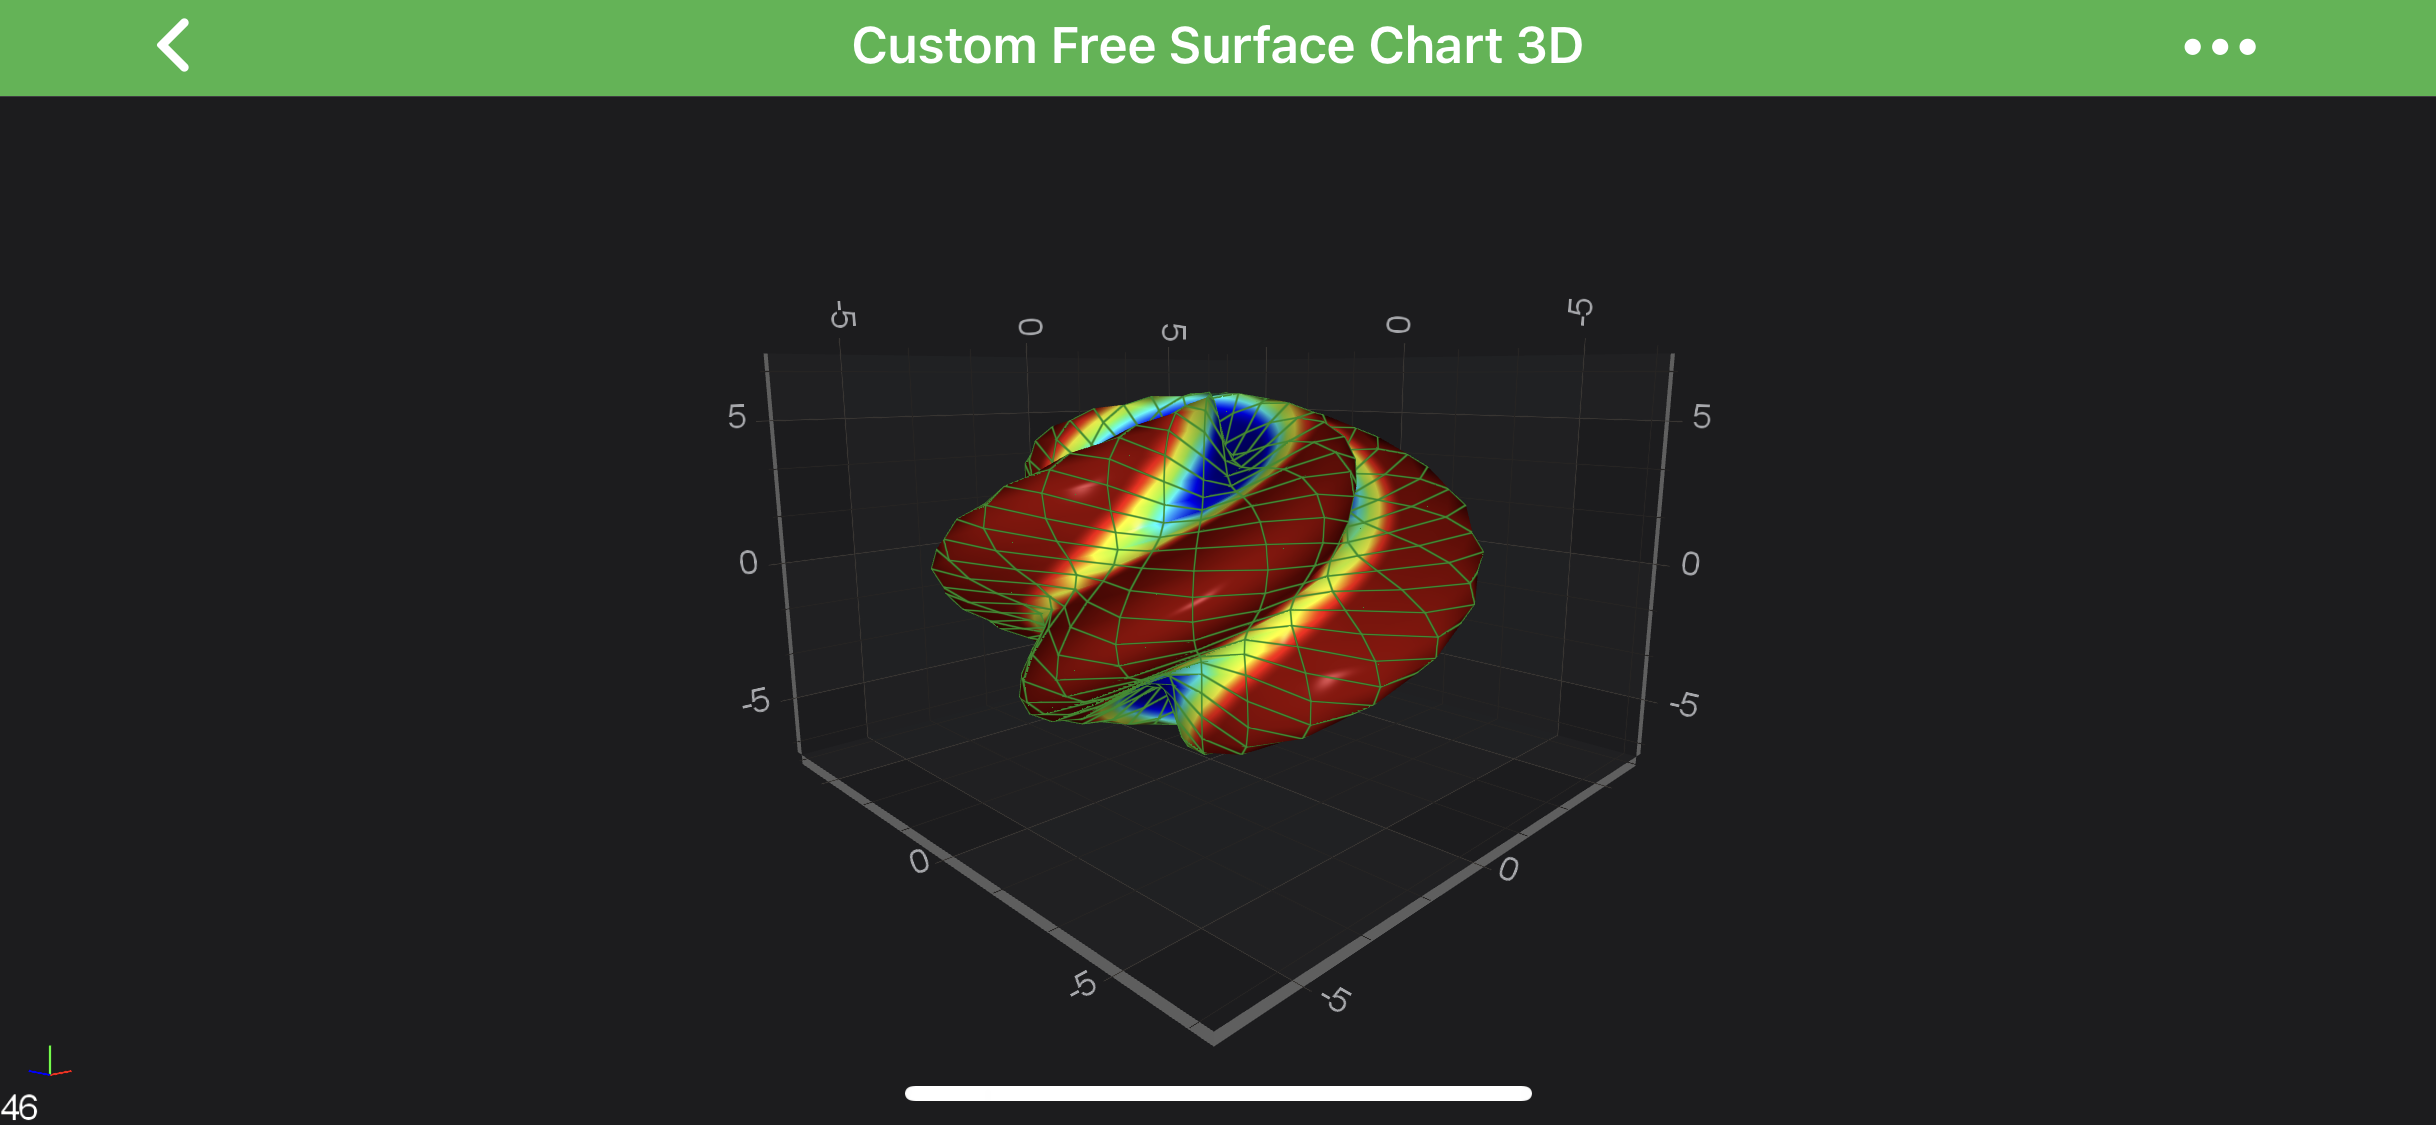
Create a Custom Free Surface 3D Chart
To create a Custom Free Surface 3D Chart like the above - use the following code:
OBJECTIVE-C
SWIFT
XAMARIN
SCIUVFunc radialDistanceFunc = ^(double u, double v) { return 5.0 + sin(5.0 * (u + v)); };
SCIUVFunc azimuthalAngleFunc = ^(double u, double v) { return u; };
SCIUVFunc polarAngleFunc = ^(double u, double v) { return v; };
SCIValueFunc xFunc = ^(double r, double theta, double phi) { return r * sin(theta) * cos(phi); };
SCIValueFunc yFunc = ^(double r, double theta, double phi) { return r * cos(theta); };
SCIValueFunc zFunc = ^(double r, double theta, double phi) { return r * sin(theta) * sin(phi); };
SCICustomSurfaceDataSeries3D *ds = [[SCICustomSurfaceDataSeries3D alloc] initWithXType:SCIDataType_Double yType:SCIDataType_Double zType:SCIDataType_Double uSize:30 vSize:30 radialDistanceFunc:radialDistanceFunc azimuthalAngleFunc:azimuthalAngleFunc polarAngleFunc:polarAngleFunc xFunc:xFunc yFunc:yFunc zFunc:zFunc];
unsigned int colors[7] = { 0xFF00008B, 0xFF0000FF, 0xFF00FFFF, 0xFFADFF2F, 0xFFFFFF00, 0xFFFF0000, 0xFF8B0000 };
float stops[7] = { 0.0, 0.1, 0.3, 0.5, 0.7, 0.9, 1.0};
SCIGradientColorPalette *palette = [[SCIGradientColorPalette alloc] initWithColors:colors stops:stops count:7];
SCIFreeSurfaceRenderableSeries3D *rs0 = [SCIFreeSurfaceRenderableSeries3D new];
rs0.dataSeries = ds;
rs0.drawMeshAs = SCIDrawMeshAs_SolidWireframe;
rs0.stroke = 0x77228B22;
rs0.contourInterval = 0.1;
rs0.contourStroke = 0x77228B22;
rs0.strokeThickness = 2.0;
rs0.lightingFactor = 0.8;
rs0.meshColorPalette = palette;
rs0.paletteMinMaxMode = SCIFreeSurfacePaletteMinMaxMode_Relative;
rs0.paletteMinimum = [[SCIVector3 alloc] initWithX:0.0 y:5.0 z:0.0];
rs0.paletteMaximum = [[SCIVector3 alloc] initWithX:0.0 y:7.0 z:0.0];
let radialDistanceFunc: SCIUVFunc = { u, v in 5.0 + sin(5.0 * (u + v)) }
let azimuthalAngleFunc: SCIUVFunc = { u, _ in u }
let polarAngleFunc: SCIUVFunc = { _, v in v }
let xFunc: SCIValueFunc = { r, theta, phi in r * sin(theta) * cos(phi) }
let yFunc: SCIValueFunc = { r, theta, phi in r * cos(theta) }
let zFunc: SCIValueFunc = { r, theta, phi in r * sin(theta) * sin(phi) }
let ds = SCICustomSurfaceDataSeries3D(xType: .double, yType: .double, zType: .double, uSize: 30, vSize: 30, radialDistanceFunc: radialDistanceFunc, azimuthalAngleFunc: azimuthalAngleFunc, polarAngleFunc: polarAngleFunc, xFunc: xFunc, yFunc: yFunc, zFunc: zFunc, uMin: 0.0, uMax: Double.pi * 2, vMin: 0, vMax: Double.pi)
let colors: [UInt32] = [0xFF00008B, 0xFF0000FF, 0xFF00FFFF, 0xFFADFF2F, 0xFFFFFF00, 0xFFFF0000, 0xFF8B0000]
let stops: [Float] = [0.0, 0.1, 0.3, 0.5, 0.7, 0.9, 1.0]
let palette = SCIGradientColorPalette(colors: colors, stops: stops, count: 7)
let rs0 = SCIFreeSurfaceRenderableSeries3D()
rs0.dataSeries = ds
rs0.drawMeshAs = .solidWireframe
rs0.stroke = 0x77228B22
rs0.contourInterval = 0.1
rs0.contourStroke = 0x77228B22
rs0.strokeThickness = 2.0
rs0.lightingFactor = 0.8
rs0.meshColorPalette = palette
rs0.paletteMinMaxMode = .relative
rs0.paletteMinimum = SCIVector3(x: 0.0, y: 5.0, z: 0.0)
rs0.paletteMaximum = SCIVector3(x: 0.0, y: 7.0, z: 0.0)
const int uSize = 40, vSize = 20;
var dataSeries3D = new CustomSurfaceDataSeries3D<double, double, double>(uSize, vSize,
(u, v) => 5.0 + Math.Sin(5 * (u + v)),
(u, v) => u,
(u, v) => v,
(r, theta, phi) => r * Math.Sin(theta) * Math.Cos(phi),
(r, theta, phi) => r * Math.Cos(theta),
(r, theta, phi) => r * Math.Sin(theta) * Math.Sin(phi));
var rSeries3D = new SCIFreeSurfaceRenderableSeries3D
{
DataSeries = dataSeries3D,
DrawMeshAs = SCIDrawMeshAs.SolidWireframe,
Stroke = 0x77228B22,
ContourInterval = 0.1f,
ContourStroke = 0x77228B22,
StrokeThickness = 1f,
MeshColorPalette = new SCIGradientColorPalette(
new[] { ColorUtil.Sapphire, ColorUtil.Blue, ColorUtil.Cyan, ColorUtil.GreenYellow, ColorUtil.Yellow, ColorUtil.Red, ColorUtil.DarkRed },
new[] { 0, .1f, .3f, .5f, .7f, .9f, 1 }),
PaletteMinimum = new SCIVector3(0, 5, 0),
PaletteMaximum = new SCIVector3(0, 7, 0),
};
NOTE: constrained and unconstrained Free Surface Series types in the corresponding articles.
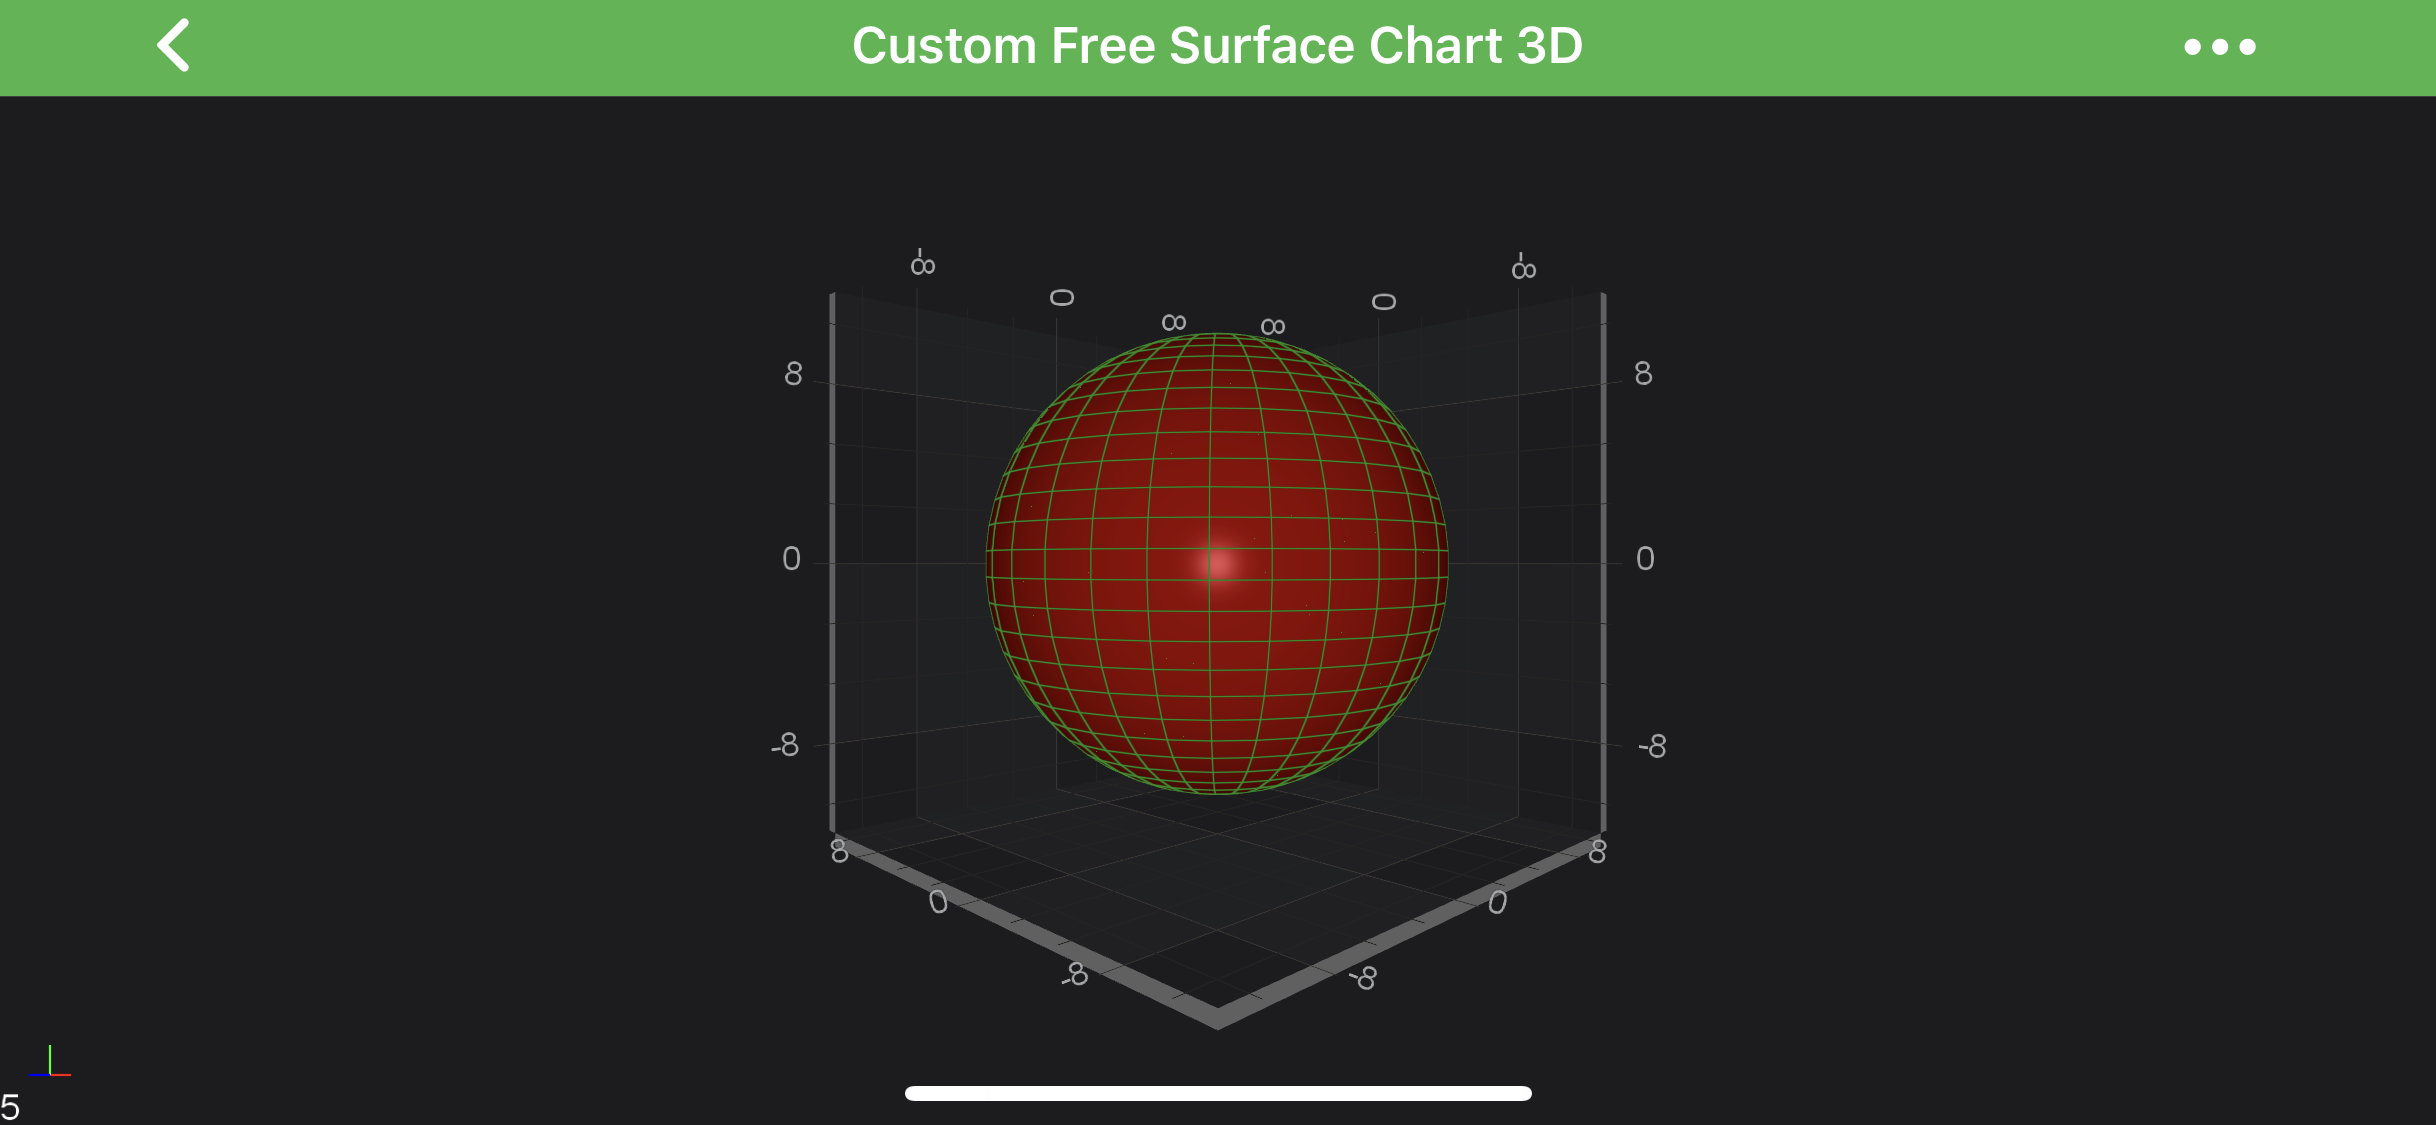
Create a Simple Sphere
Let’s create a simple Sphere with a Radius = 10.
See the user-defined functions which is used in the SCICustomSurfaceDataSeries3D
OBJECTIVE-C
SWIFT
XAMARIN
SCIUVFunc radialDistanceFunc = ^(double u, double v) { return 10.0; };
SCIUVFunc azimuthalAngleFunc = ^(double u, double v) { return u; };
SCIUVFunc polarAngleFunc = ^(double u, double v) { return v; };
SCIValueFunc xFunc = ^(double r, double theta, double phi) { return r * sin(theta) * cos(phi); };
SCIValueFunc yFunc = ^(double r, double theta, double phi) { return r * cos(theta); };
SCIValueFunc zFunc = ^(double r, double theta, double phi) { return r * sin(theta) * sin(phi); };
SCICustomSurfaceDataSeries3D *ds = [[SCICustomSurfaceDataSeries3D alloc] initWithXType:SCIDataType_Double yType:SCIDataType_Double zType:SCIDataType_Double uSize:30 vSize:30 radialDistanceFunc:radialDistanceFunc azimuthalAngleFunc:azimuthalAngleFunc polarAngleFunc:polarAngleFunc xFunc:xFunc yFunc:yFunc zFunc:zFunc];
let radialDistanceFunc: SCIUVFunc = { u, v in 10.0 }
let azimuthalAngleFunc: SCIUVFunc = { u, _ in u }
let polarAngleFunc: SCIUVFunc = { _, v in v }
let xFunc: SCIValueFunc = { r, theta, phi in r * sin(theta) * cos(phi) }
let yFunc: SCIValueFunc = { r, theta, phi in r * cos(theta) }
let zFunc: SCIValueFunc = { r, theta, phi in r * sin(theta) * sin(phi) }
let ds = SCICustomSurfaceDataSeries3D(xType: .double, yType: .double, zType: .double, uSize: 30, vSize: 30, radialDistanceFunc: radialDistanceFunc, azimuthalAngleFunc: azimuthalAngleFunc, polarAngleFunc: polarAngleFunc, xFunc: xFunc, yFunc: yFunc, zFunc: zFunc, uMin: 0.0, uMax: Double.pi * 2, vMin: 0, vMax: Double.pi)
const int uSize = 40, vSize = 20;
var dataSeries3D = new CustomSurfaceDataSeries3D<double, double, double>(uSize, vSize,
(u, v) => 5.0 + Math.Sin(5 * (u + v)),
(u, v) => u,
(u, v) => v,
(r, theta, phi) => r * Math.Sin(theta) * Math.Cos(phi),
(r, theta, phi) => r * Math.Cos(theta),
(r, theta, phi) => r * Math.Sin(theta) * Math.Sin(phi));
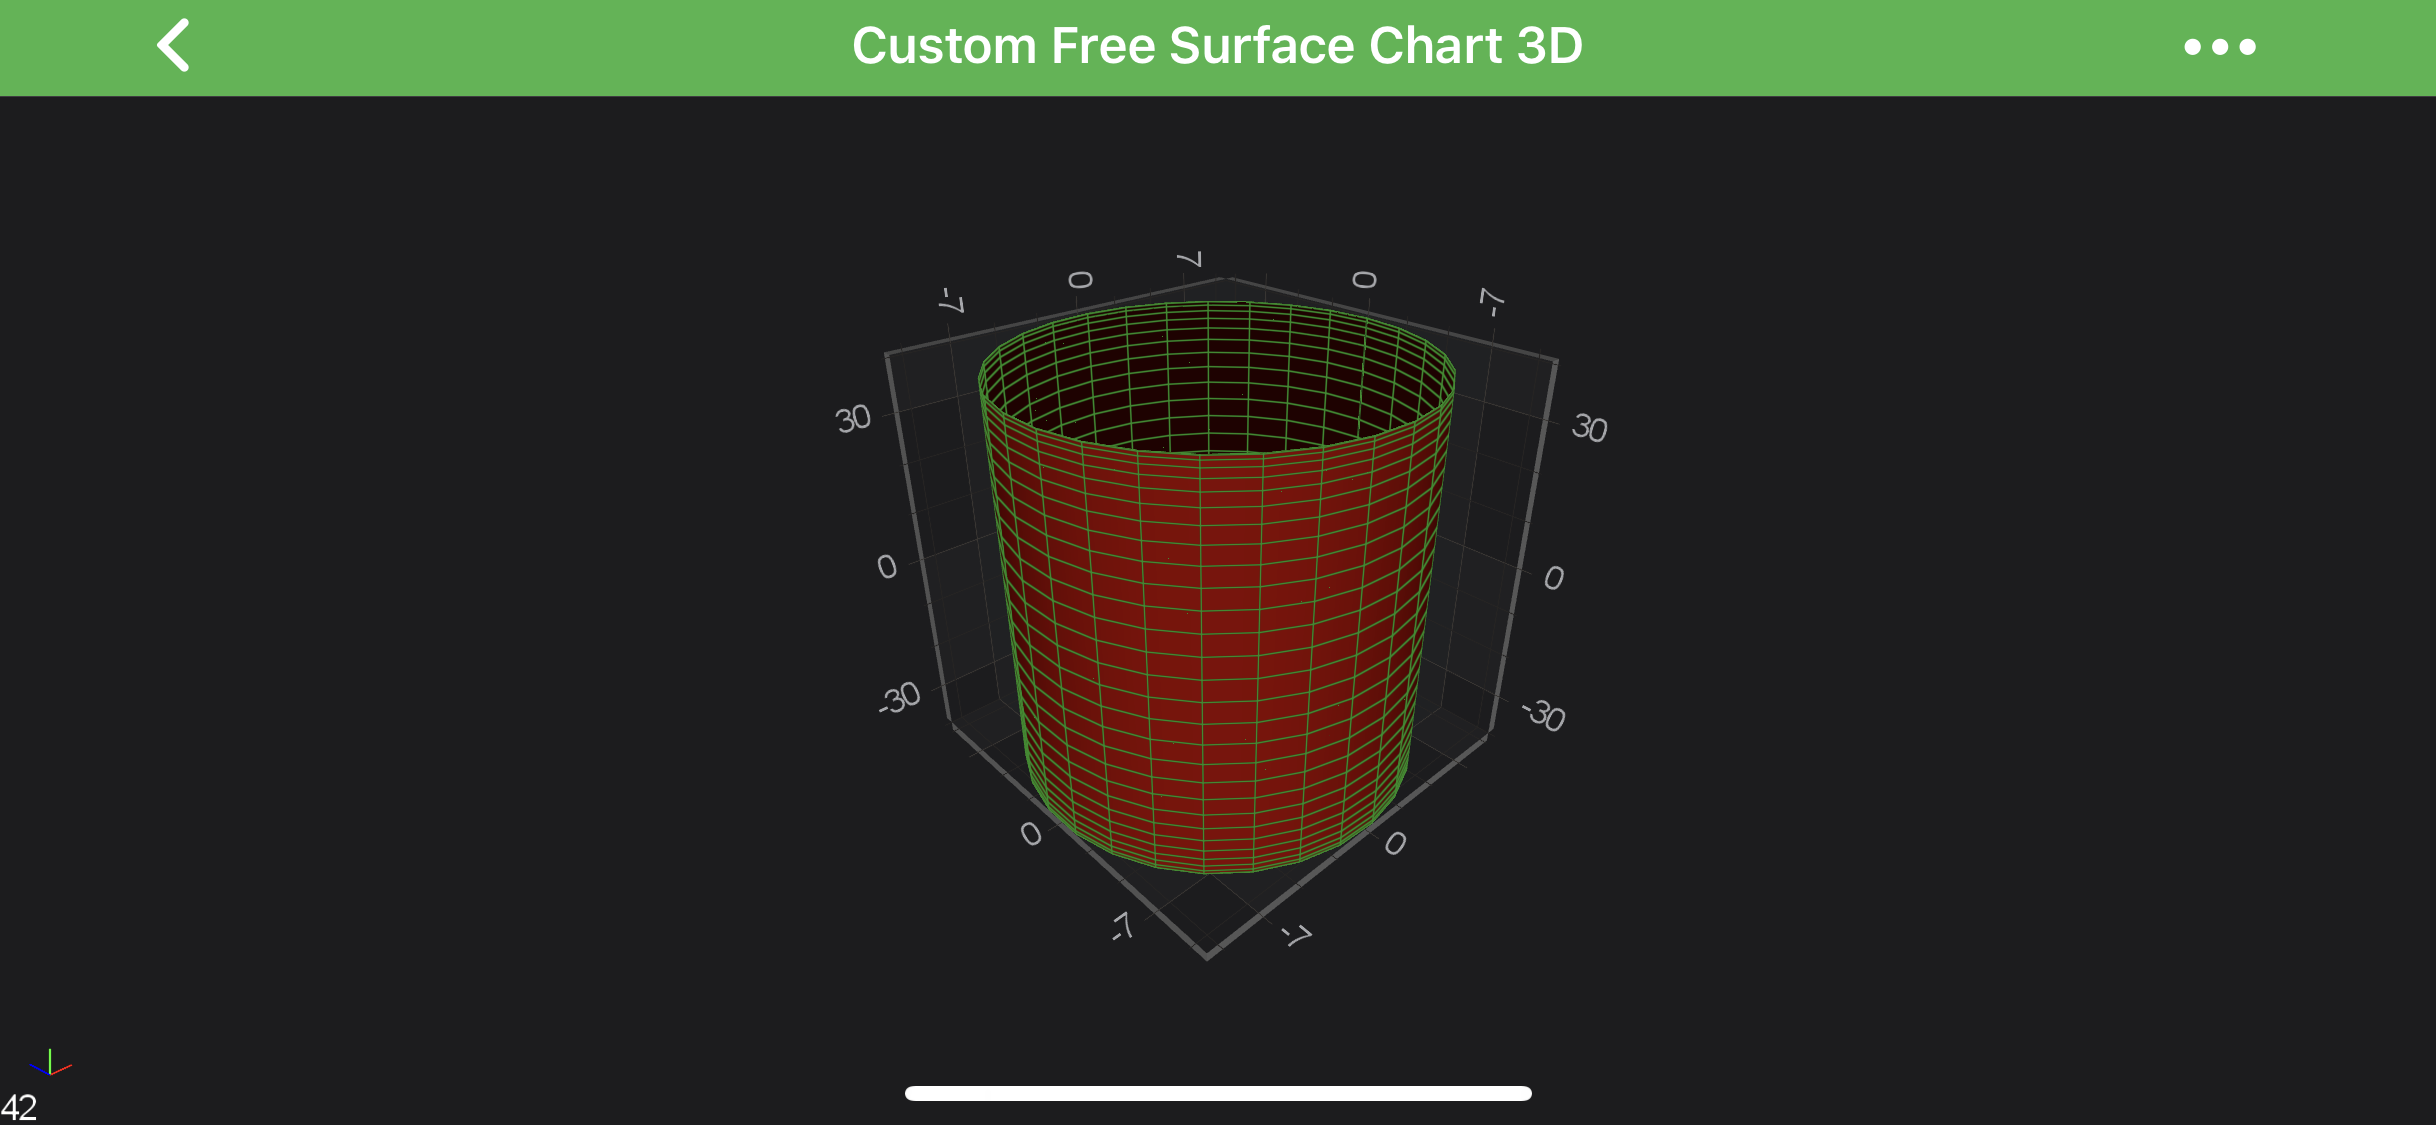
Create a Simple Cylinder
Let’s create a simple Cylinder with a Radius = 10 and Height = 40. See the code below:
OBJECTIVE-C
SWIFT
XAMARIN
SCIUVFunc radialDistanceFunc = ^(double u, double v) { return 0.0; };
SCIUVFunc azimuthalAngleFunc = ^(double u, double v) { return u; };
SCIUVFunc polarAngleFunc = ^(double u, double v) { return v; };
SCIValueFunc xFunc = ^(double r, double theta, double phi) { return 10 * sin(M_PI / 2) * cos(phi); };
SCIValueFunc yFunc = ^(double r, double theta, double phi) { return 40 * cos(theta); };
SCIValueFunc zFunc = ^(double r, double theta, double phi) { return 10 * sin(M_PI / 2) * sin(phi); };
SCICustomSurfaceDataSeries3D *ds = [[SCICustomSurfaceDataSeries3D alloc] initWithXType:SCIDataType_Double yType:SCIDataType_Double zType:SCIDataType_Double uSize:30 vSize:30 radialDistanceFunc:radialDistanceFunc azimuthalAngleFunc:azimuthalAngleFunc polarAngleFunc:polarAngleFunc xFunc:xFunc yFunc:yFunc zFunc:zFunc];
let radialDistanceFunc: SCIUVFunc = { u, v in 0.0 }
let azimuthalAngleFunc: SCIUVFunc = { u, _ in u }
let polarAngleFunc: SCIUVFunc = { _, v in v }
let xFunc: SCIValueFunc = { r, theta, phi in 10 * sin(.pi / 2) * cos(phi) }
let yFunc: SCIValueFunc = { r, theta, phi in 40 * cos(theta) }
let zFunc: SCIValueFunc = { r, theta, phi in 10 * sin(.pi / 2) * sin(phi) }
let ds = SCICustomSurfaceDataSeries3D(xType: .double, yType: .double, zType: .double, uSize: 30, vSize: 30, radialDistanceFunc: radialDistanceFunc, azimuthalAngleFunc: azimuthalAngleFunc, polarAngleFunc: polarAngleFunc, xFunc: xFunc, yFunc: yFunc, zFunc: zFunc, uMin: 0.0, uMax: Double.pi * 2, vMin: 0, vMax: Double.pi)
const int uSize = 30, vSize = 30;
var dataSeries3D = new CustomSurfaceDataSeries3D<double, double, double>(uSize, vSize,
(u, v) => 0.0,
(u, v) => u,
(u, v) => v,
(r, theta, phi) => 10 * Math.Sin(Math.PI / 2) * Math.Cos(phi),
(r, theta, phi) => 40 * Math.Cos(theta),
(r, theta, phi) => 10 * Math.Sin(Math.PI / 2) * Math.Sin(phi));
 View on GitHub