 View on GitHub
iOS & macOS Charting Documentation - SciChart iOS & macOS Charts SDK v4.x
Create a Custom Theme
As well as built in themes provided by the ThemeManager, in SciChart you can also define your own custom theme.
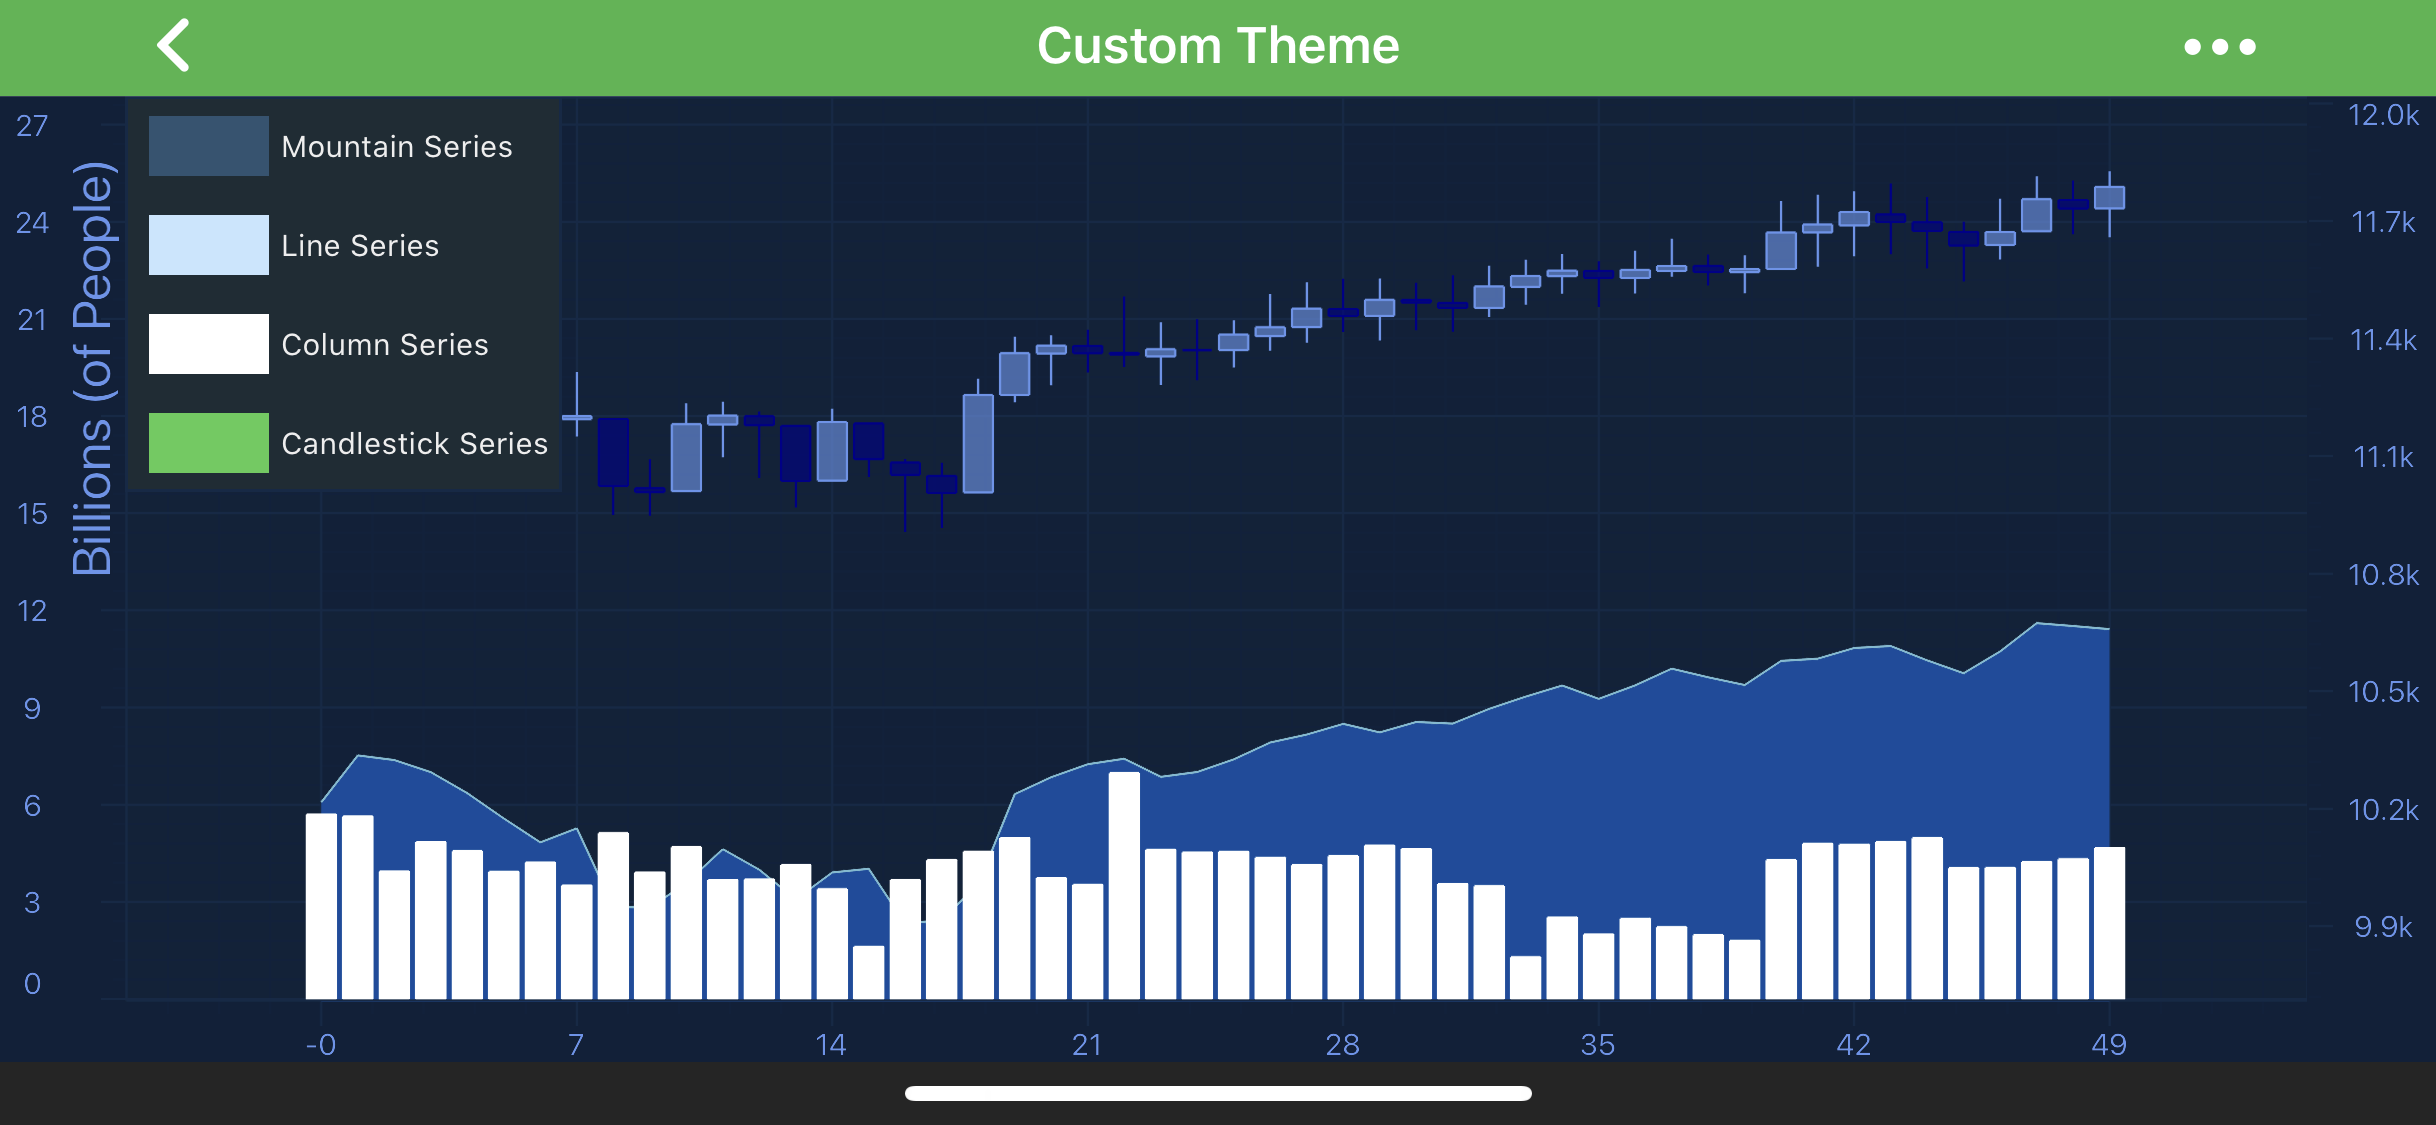
NOTE: Custom Theme example can be found in the SciChart iOS Examples Suite as well as on GitHub:
First of all you’ll need to define a Key which is a simple string. For Swift you’ll need to create an SCIChartTheme extension with static SCIChartTheme object, e.g.:
static NSString * const SCIChartThemeBerryBlue = @“SciChart_BerryBlue”;
extension SCIChartTheme {
static let berryBlue: SCIChartTheme = SCIChartTheme(rawValue: “SciChart_BerryBlue”)
}
private const string SCIChartThemeBerryBlue = “SciChart_BerryBlue”;
and then provide corresponding .plist with properties for it, e.g. SciChart_BerryBlue.plist:
<?xml version="1.0" encoding="UTF-8"?>
<!DOCTYPE plist PUBLIC "-//Apple//DTD PLIST 1.0//EN" "http://www.apple.com/DTDs/PropertyList-1.0.dtd">
<plist version="1.0">
<dict>
    <key>tickTextSize</key>
    <integer>12</integer>
    <key>titleTextSize</key>
    <integer>18</integer>
    <key>axisTooltipTextSize</key>
    <integer>12</integer>
    <key>defaultTextSize</key>
    <integer>10</integer>
    <key>textAnnotationTextSize</key>
    <integer>12</integer>
    <key>lineAnnotationLineThickness</key>
    <integer>2</integer>
    <key>renderableSeriesAreaStrokeThickness</key>
    <integer>1</integer>
    <key>majorTickLineLength</key>
    <integer>8</integer>
    <key>minorTickLineLength</key>
    <integer>4</integer>
    <key>sciChartBackground</key>
    <dict>
        <key>solid</key>
        <string>#FF0D213A</string>
    </dict>
    <key>legendBackground</key>
    <dict>
        <key>strokeThickness</key>
        <string>1</string>
        <key>stroke</key>
        <string>#FF102A47</string>
        <key>solid</key>
        <string>#FF1D2C35</string>
    </dict>
    <key>renderableSeriesAreaBorderColor</key>
    <string>#FF102A47</string>
    <key>renderableSeriesAreaFillColor</key>
    <string>#00000000</string>
    <key>defaultTextColor</key>
    <string>#FFEEEEEE</string>
    <key>tickTextColor</key>
    <string>#FF6495ED</string>
    <key>majorGridLineColor</key>
    <string>#FF102A47</string>
    <key>minorGridLineColor</key>
    <string>#FF0D223D</string>
    <key>axisBandsColor</key>
    <string>#FF0E233A</string>
    <key>rolloverLineColor</key>
    <string>#33FD9F25</string>
    <key>cursorLineColor</key>
    <string>#996495ED</string>
    <key>rubberBandStrokeColor</key>
    <string>#77999999</string>
    <key>rubberBandFillColor</key>
    <string>#33999999</string>
    <key>axisTooltipTextColor</key>
    <string>#FFEEEEEE</string>
    <key>axisTooltipBackground</key>
    <dict>
        <key>strokeThickness</key>
        <string>1</string>
        <key>stroke</key>
        <string>#FFFC9C29</string>
        <key>solid</key>
        <string>#AAFC9C29</string>
    </dict>
    <key>labelBackground</key>
    <dict>
        <key>strokeThickness</key>
        <string>1</string>
        <key>stroke</key>
        <string>#FF42b649</string>
        <key>solid</key>
        <string>#AA42b649</string>
    </dict>
    <key>mountainLineColor</key>
    <string>#FF76BBD2</string>
    <key>mountainAreaColor</key>
    <string>#FF094C9F</string>
    <key>lineSeriesColor</key>
    <string>#FFC6E6FF</string>
    <key>columnLineColor</key>
    <string>#FFFFFFFF</string>
    <key>columnFillColor</key>
    <string>#FFFFFFFF</string>
    <key>candleStickStrokeUpColor</key>
    <string>#FF6495ED</string>
    <key>candleStickStrokeDownColor</key>
    <string>#FF00008B</string>
    <key>candleStickFillUpColor</key>
    <string>#A06495ED</string>
    <key>candleStickFillDownColor</key>
    <string>#A000008B</string>
    <key>bandStrokeUpColor</key>
    <string>#FF6495ED</string>
    <key>bandStrokeDownColor</key>
    <string>#FF00008B</string>
    <key>bandFillUpColor</key>
    <string>#A06495ED</string>
    <key>bandFillDownColor</key>
    <string>#A000008B</string>
    <key>lineAnnotationLineColor</key>
    <string>#7742b649</string>
    <key>textAnnotationTextColor</key>
    <string>#FFEEEEEE</string>
    <key>textAnnotationBackgroundColor</key>
    <string>#AA42b649</string>
    <key>defaultAnnotationGripsStrokeColor</key>
    <string>#FFEEEEEE</string>
    <key>defaultAnnotationGripsBackgroundColor</key>
    <string>#33FFFFFF</string>
</dict>
</plist>
Before applying your custom theme you have to add it from your bundle, like this:
[SCIThemeManager addTheme:SCIChartThemeBerryBlue fromBundle:[NSBundle mainBundle]];
SCIThemeManager.addTheme(.berryBlue, from: Bundle.main)
SCIThemeManager.AddTheme(BerryBlue, Foundation.NSBundle.MainBundle);
That’s it. Now you can apply it on your SCIChartSurface as usual:
[SCIThemeManager applyTheme:SCIChartThemeBerryBlue toThemeable:self.surface];
SCIThemeManager.applyTheme(.berryBlue, to: self.surface)
SCIThemeManager.ApplyTheme(BerryBlue, Surface);