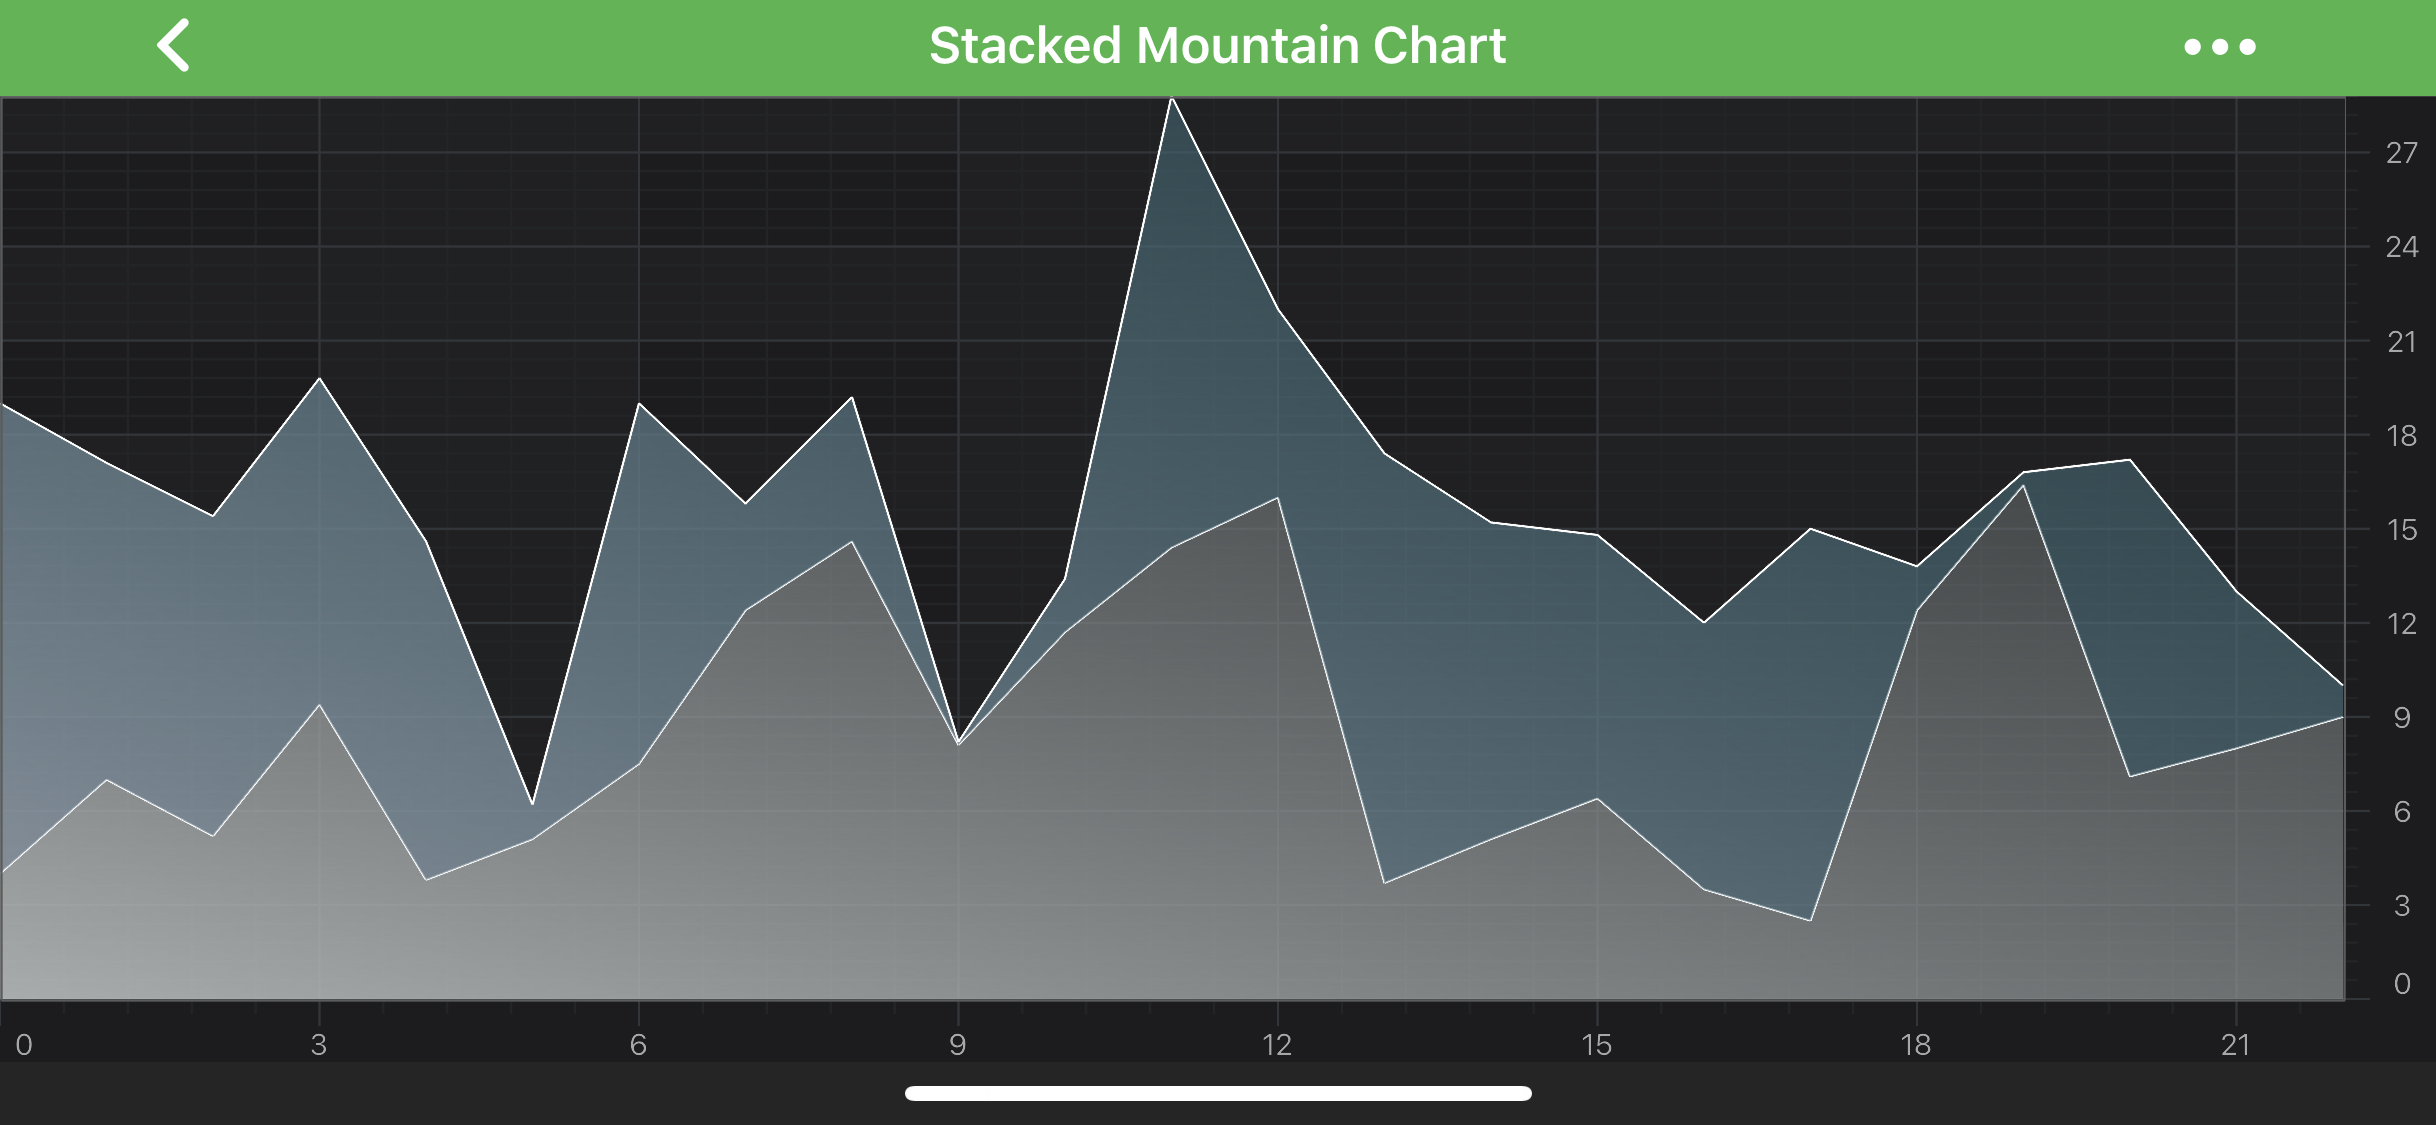
Basically, it’s a simple SCIObservableCollection of Stacked Mountain Series, where the order of items in it determines how series should be stacked and drawn - the first item will be drawn as regular mountain series and the rest will be stacked on top of each other.
To create a Vertically Stacked Mountain Series, use the following code:
// Assume a surface has been created and configured somewhere
id<ISCIChartSurface> surface;
// Create DataSeries and fill it with some data
SCIXyDataSeries *ds1 = [[SCIXyDataSeries alloc] initWithXType:SCIDataType_Double yType:SCIDataType_Double];
SCIXyDataSeries *ds2 = [[SCIXyDataSeries alloc] initWithXType:SCIDataType_Double yType:SCIDataType_Double];
// Create Stacked Mountain Series
SCIStackedMountainRenderableSeries *rSeries1 = [SCIStackedMountainRenderableSeries new];
rSeries1.dataSeries = ds1;
rSeries1.strokeStyle = [[SCISolidPenStyle alloc] initWithColorCode:0xFFffffff thickness:1.0];
rSeries1.areaStyle = [[SCILinearGradientBrushStyle alloc] initWithStart:CGPointZero end:CGPointMake(0.0, 1.0) startColorCode:0xDDDBE0E1 endColorCode:0x88B6C1C3];
SCIStackedMountainRenderableSeries *rSeries2 = [SCIStackedMountainRenderableSeries new];
rSeries2.dataSeries = ds2;
rSeries2.strokeStyle = [[SCISolidPenStyle alloc] initWithColorCode:0xFFffffff thickness:1.0];
rSeries2.areaStyle = [[SCILinearGradientBrushStyle alloc] initWithStart:CGPointZero end:CGPointMake(0.0, 1.0) startColorCode:0xDDACBCCA endColorCode:0x88439AAF];
// Create and Fill Stacked Series Collection
SCIVerticallyStackedMountainsCollection *seriesCollection = [SCIVerticallyStackedMountainsCollection new];
[seriesCollection add:rSeries1];
[seriesCollection add:rSeries2];
[surface.renderableSeries add:seriesCollection];
// Assume a surface has been created and configured somewhere
let surface: ISCIChartSurface
// Create DataSeries and fill it with some data
let ds1 = SCIXyDataSeries(xType: .double, yType: .double)
let ds2 = SCIXyDataSeries(xType: .double, yType: .double)
// Create Stacked Mountain Series
let rSeries1 = SCIStackedMountainRenderableSeries()
rSeries1.dataSeries = ds1
rSeries1.strokeStyle = SCISolidPenStyle(colorCode: 0xFFffffff, thickness: 1)
rSeries1.areaStyle = SCILinearGradientBrushStyle(start: CGPoint(x: 0.0, y: 0.0), end: CGPoint(x: 1.0, y: 1.0), startColorCode: 0xDDDBE0E1, endColorCode: 0x88B6C1C3)
let rSeries2 = SCIStackedMountainRenderableSeries()
rSeries2.dataSeries = ds2
rSeries2.strokeStyle = SCISolidPenStyle(colorCode: 0xFFffffff, thickness: 1)
rSeries2.areaStyle = SCILinearGradientBrushStyle(start: CGPoint(x: 0.0, y: 0.0), end: CGPoint(x: 1.0, y: 1.0), startColorCode: 0xDDACBCCA, endColorCode: 0x88439AAF)
// Create and Fill Stacked Series Collection
let seriesCollection = SCIVerticallyStackedMountainsCollection()
seriesCollection.add(rSeries1)
seriesCollection.add(rSeries2)
surface.renderableSeries.add(seriesCollection)
// Assume a surface has been created and configured somewhere
IISCIChartSurface surface;
// Create DataSeries and fill it with some data
var ds1 = new XyDataSeries<double, double> { SeriesName = “data 1” };
var ds2 = new XyDataSeries<double, double> { SeriesName = “data 2” };
// Create Stacked Mountain Series
var rSeries1 = new SCIStackedMountainRenderableSeries
{
DataSeries = ds1,
StrokeStyle = SCISolidPenStyle(colorCode: 0xFFffffff, thickness: 1),
AreaStyle = new SCILinearGradientBrushStyle(new CGPoint(0, 0), new CGPoint(1, 1), 0xDDDBE0E1, 0x88B6C1C3)
};
var rSeries2 = new SCIStackedMountainRenderableSeries
{
DataSeries = ds2,
StrokeStyle = SCISolidPenStyle(colorCode: 0xFFffffff, thickness: 1),
AreaStyle = new SCILinearGradientBrushStyle(new CGPoint(0, 0), new CGPoint(1, 1), 0xDDACBCCA, 0x88439AAF)
};
// Create and Fill Stacked Series Collection
var seriesCollection = new SCIVerticallyStackedMountainsCollection();
seriesCollection.Add(rSeries1);
seriesCollection.Add(rSeries2);
surface.RenderableSeries.Add(seriesCollection);
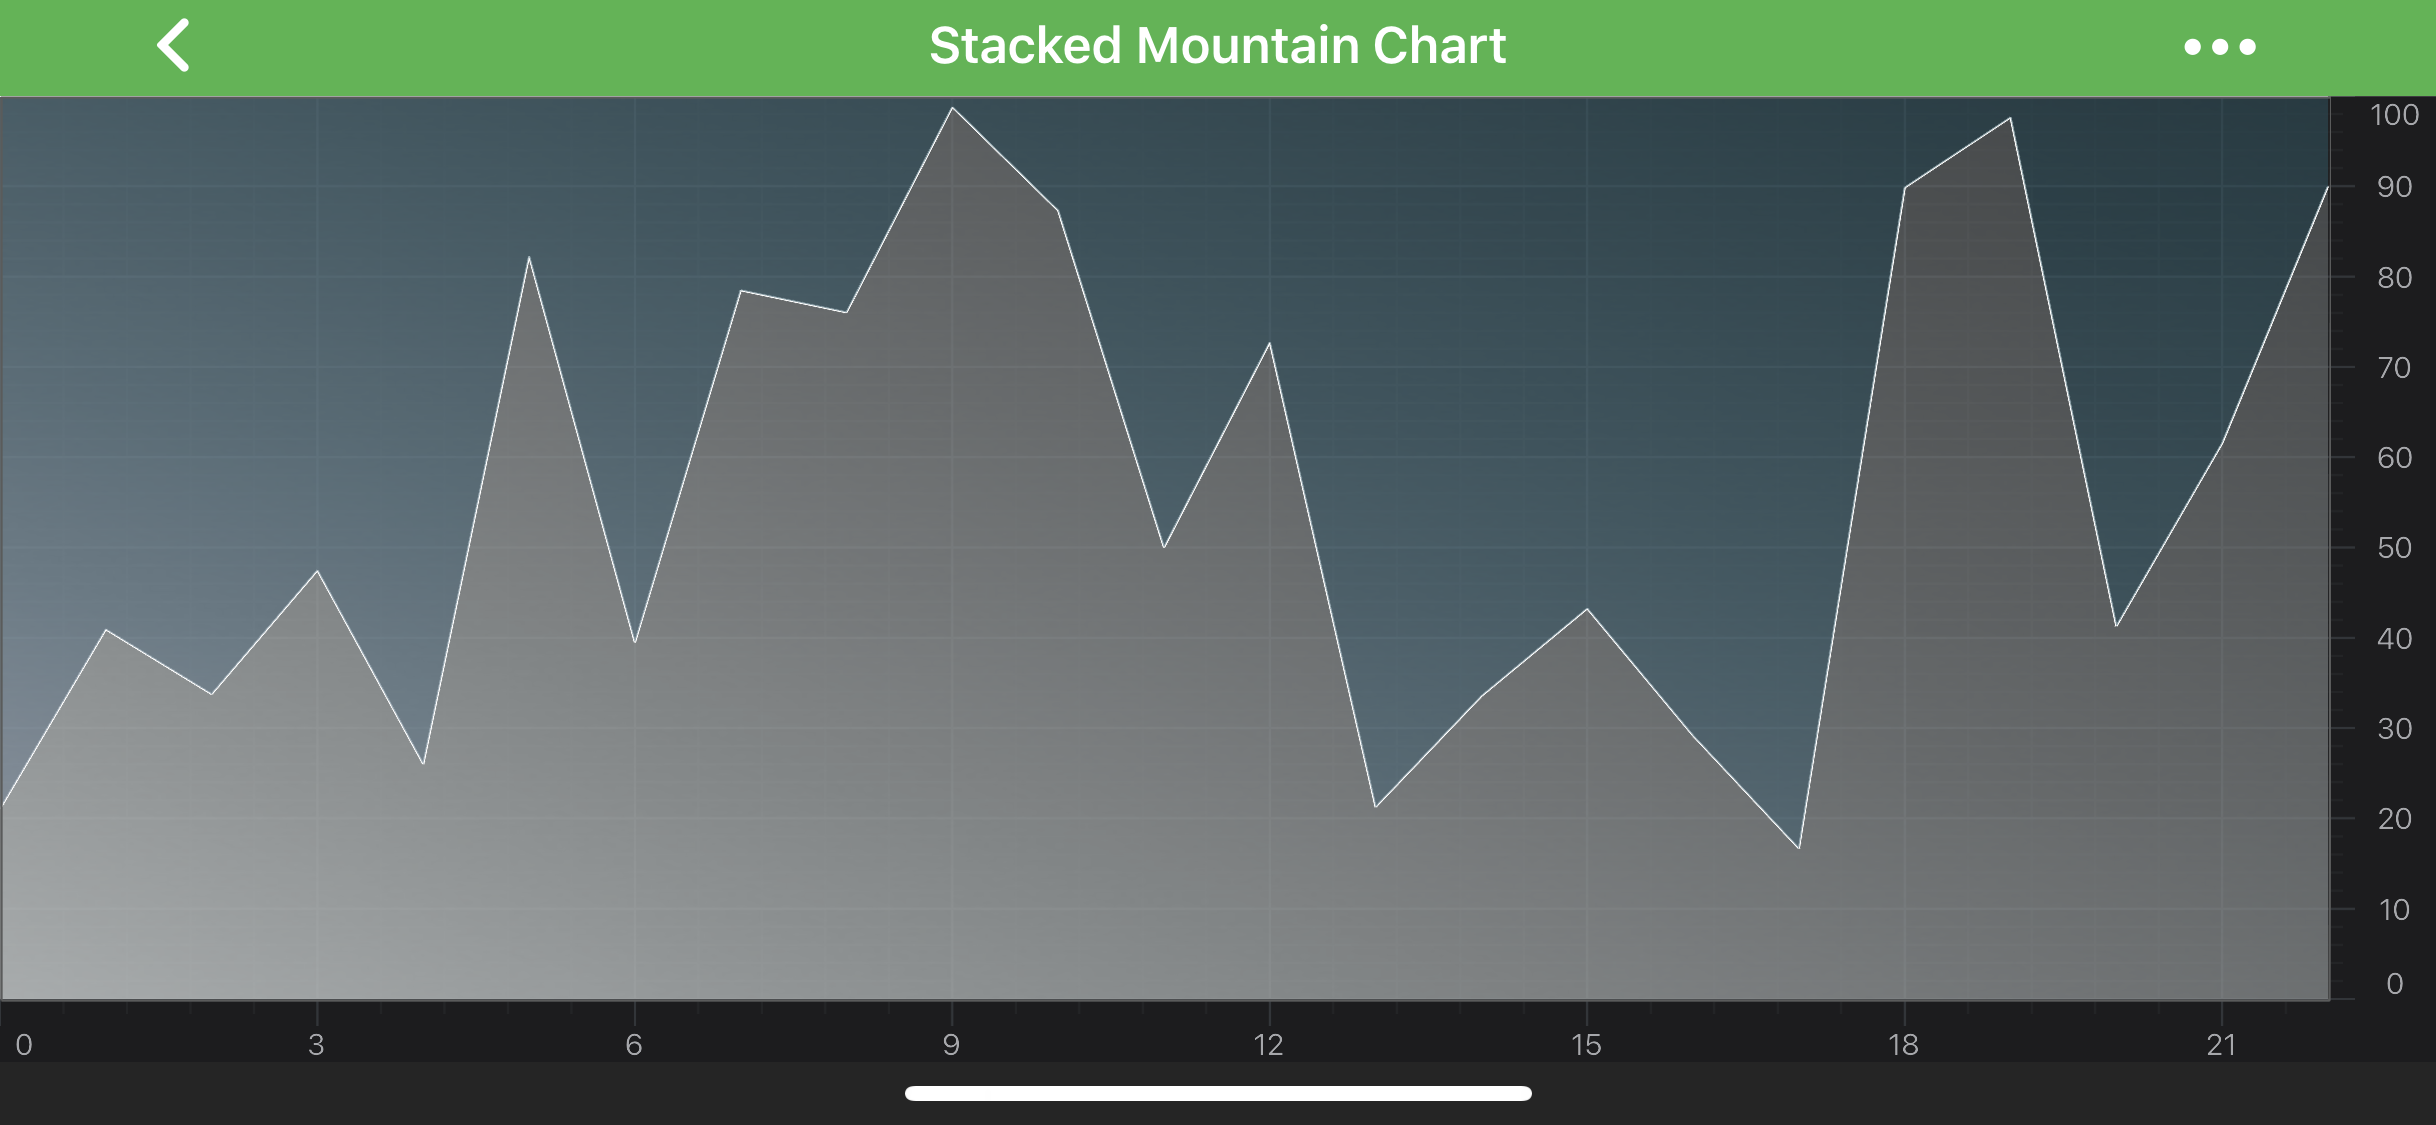
100% Stacked Mountains
Similarly to Stacked Column Series in SciChart it is possible to have Stacked Mountains, which fills all available vertical space. This mode is called 100% Stacked Mountains.
 View on GitHub