// Assume a surface has been created and configured somewhere
id<ISCIChartSurface> surface;
// Create DataSeries and fill it with some data
SCIXyDataSeries *dataSeries = [[SCIXyDataSeries alloc] initWithXType:SCIDataType_Double yType:SCIDataType_Double];
// Create and add Spline Line Series
id<ISCIRenderableSeries> lineSeries = [SCISplineLineRenderableSeries new];
lineSeries.dataSeries = dataSeries;
lineSeries.strokeStyle = [[SCISolidPenStyle alloc] initWithColorCode:0xFF279B27 thickness:2.0];
[surface.renderableSeries add:lineSeries];
// Assume a surface has been created and configured somewhere
let surface: ISCIChartSurface
// Create DataSeries and fill it with some data
let dataSeries = SCIXyDataSeries(xType: .double, yType: .double)
// Create and add Spline Line Series
let lineSeries = SCISplineLineRenderableSeries()
lineSeries.dataSeries = dataSeries
lineSeries.strokeStyle = SCISolidPenStyle(colorCode: 0xFF279B27, thickness: 2.0)
surface.renderableSeries.add(lineSeries)
// Assume a surface has been created and configured somewhere
IISCIChartSurface surface;
// Create DataSeries and fill it with some data
var dataSeries = new XyDataSeries();
// Create and add Spline Line Series
var lineSeries = new SCISplineLineRenderableSeries();
lineSeries.DataSeries = dataSeries;
lineSeries.StrokeStyle = new SCISolidPenStyle(0xFF279B27, 2.0f);
surface.RenderableSeries.Add(lineSeries);
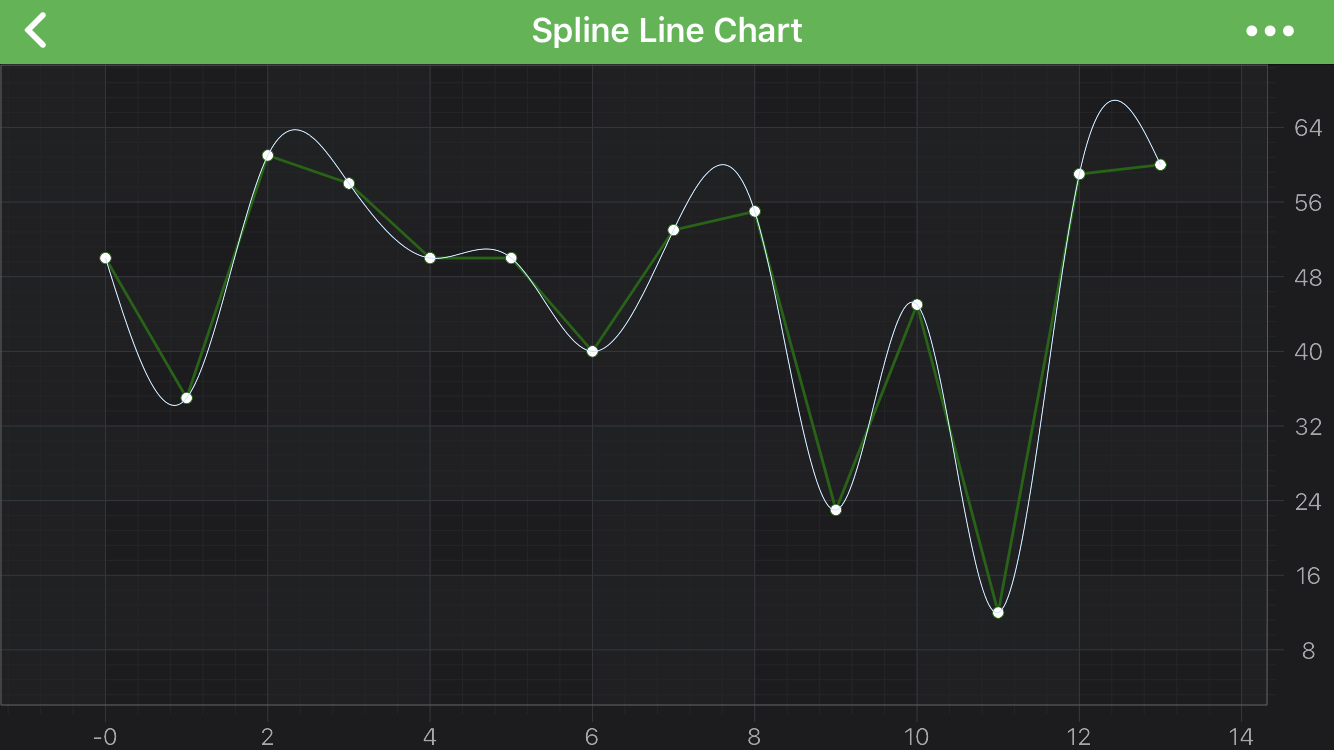
In the code above, a Spline Line Series instance is created. It is assigned to draw the data that is provided by the ISCIDataSeries assigned to it. The line is drawn with a Pen provided by the SCIPenStyle instance. Finally, the Spline Line Series is added to the ISCIChartSurface.renderableSeries property.
Spline Line Series Features
Spline Line Series also has some features similar to other series, such as:
It is possible to show a gap in a Spline Line Series by passing a data point with a NaN as the Y value. Please refer to the RenderableSeries APIs article for more details. The SCISplineLineRenderableSeries, however, allows to specify how a gap should appear. You can treat NAN values as gaps or close the line. That’s defined by the SCIRenderableSeriesBase.drawNaNAs property (Please see SCILineDrawMode enumeration).
NOTE: Please note, even though Gaps via NaN values in spline series is supported, ClosedGaps feature, which is available in regular (non-spline) series, aren’t supported with splines.
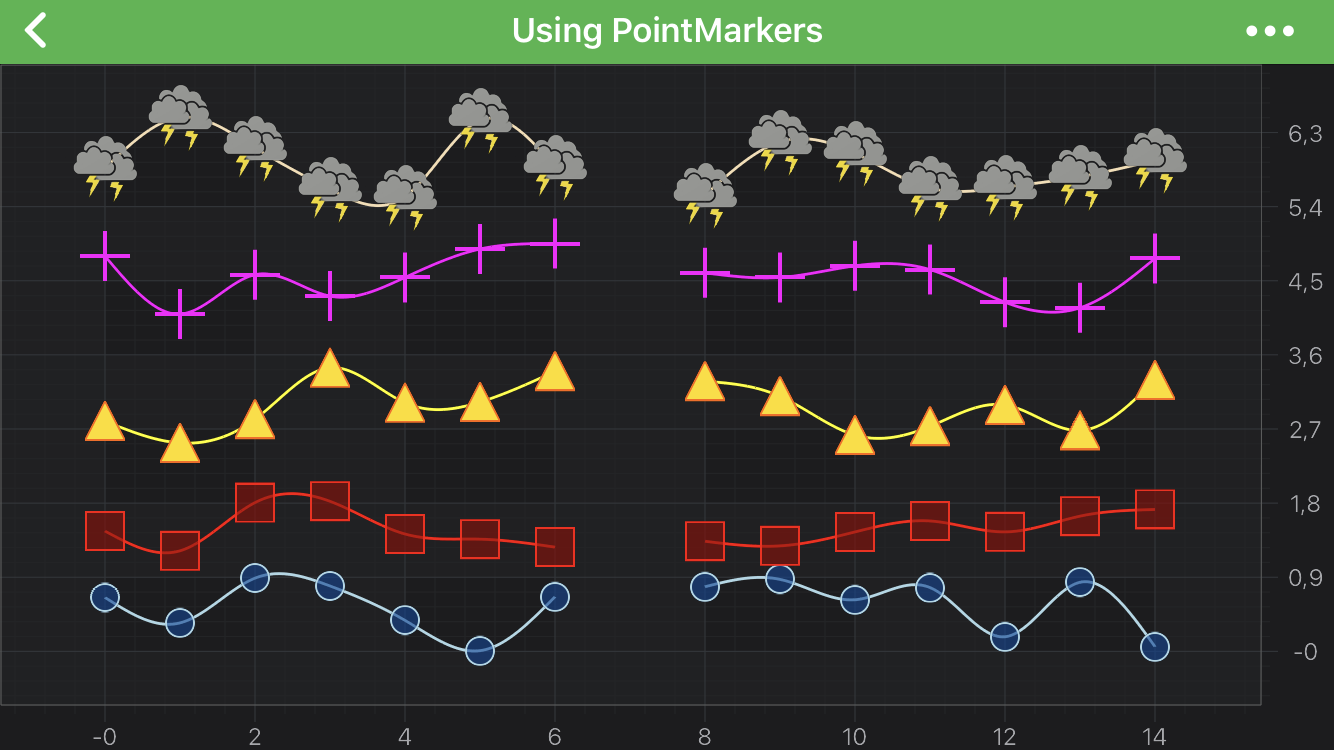
Add Point Markers onto a Spline Line Series
Every data point of a Spline Line Series can be marked with a ISCIPointMarker. To add Point Markers to the Spline Line Series, use the following code:
// Create a Triangle PointMarker instance
id<ISCIPointMarker> pointMarker = [SCITrianglePointMarker new];
pointMarker.size = (CGSize){ .width = 40, .height = 40 };
pointMarker.strokeStyle = [[SCISolidPenStyle alloc] initWithColor:UIColor.greenColor thickness:2.0];
pointMarker.fillStyle = [[SCISolidBrushStyle alloc] initWithColor:UIColor.redColor];
// Apply the PointMarker to a Spline Line Series
id<ISCIRenderableSeries> lineSeries = [SCISplineLineRenderableSeries new];
lineSeries.pointMarker = pointMarker;
// Create a Triangle PointMarker instance
let pointMarker = SCITrianglePointMarker()
pointMarker.size = CGSize(width: 40, height: 40)
pointMarker.strokeStyle = SCISolidPenStyle(color: .green, thickness: 2.0)
pointMarker.fillStyle = SCISolidBrushStyle(color: .red)
// Apply the PointMarker to a Spline Line Series
let lineSeries = SCISplineLineRenderableSeries()
lineSeries.pointMarker = pointMarker
// Create a Triangle PointMarker instance
var pointMarker = new SCITrianglePointMarker();
pointMarker.Size = new CGSize(40, 40);
pointMarker.StrokeStyle = new SCISolidPenStyle(UIColor.Green, 2.0f);
pointMarker.FillStyle = new SCISolidBrushStyle(UIColor.Red);
// Apply the PointMarker to a Spline Line Series
var lineSeries = new SCISplineLineRenderableSeries();
lineSeries.PointMarker = pointMarker;
To learn more about Point Markers, please refer to the PointMarkers API article.
 View on GitHub