 View on GitHub
iOS & macOS Charting Documentation - SciChart iOS & macOS Charts SDK v4.x
Templating and Styling Chart Parts
Most of the parts within SciChart can be template and styled independently of Themes
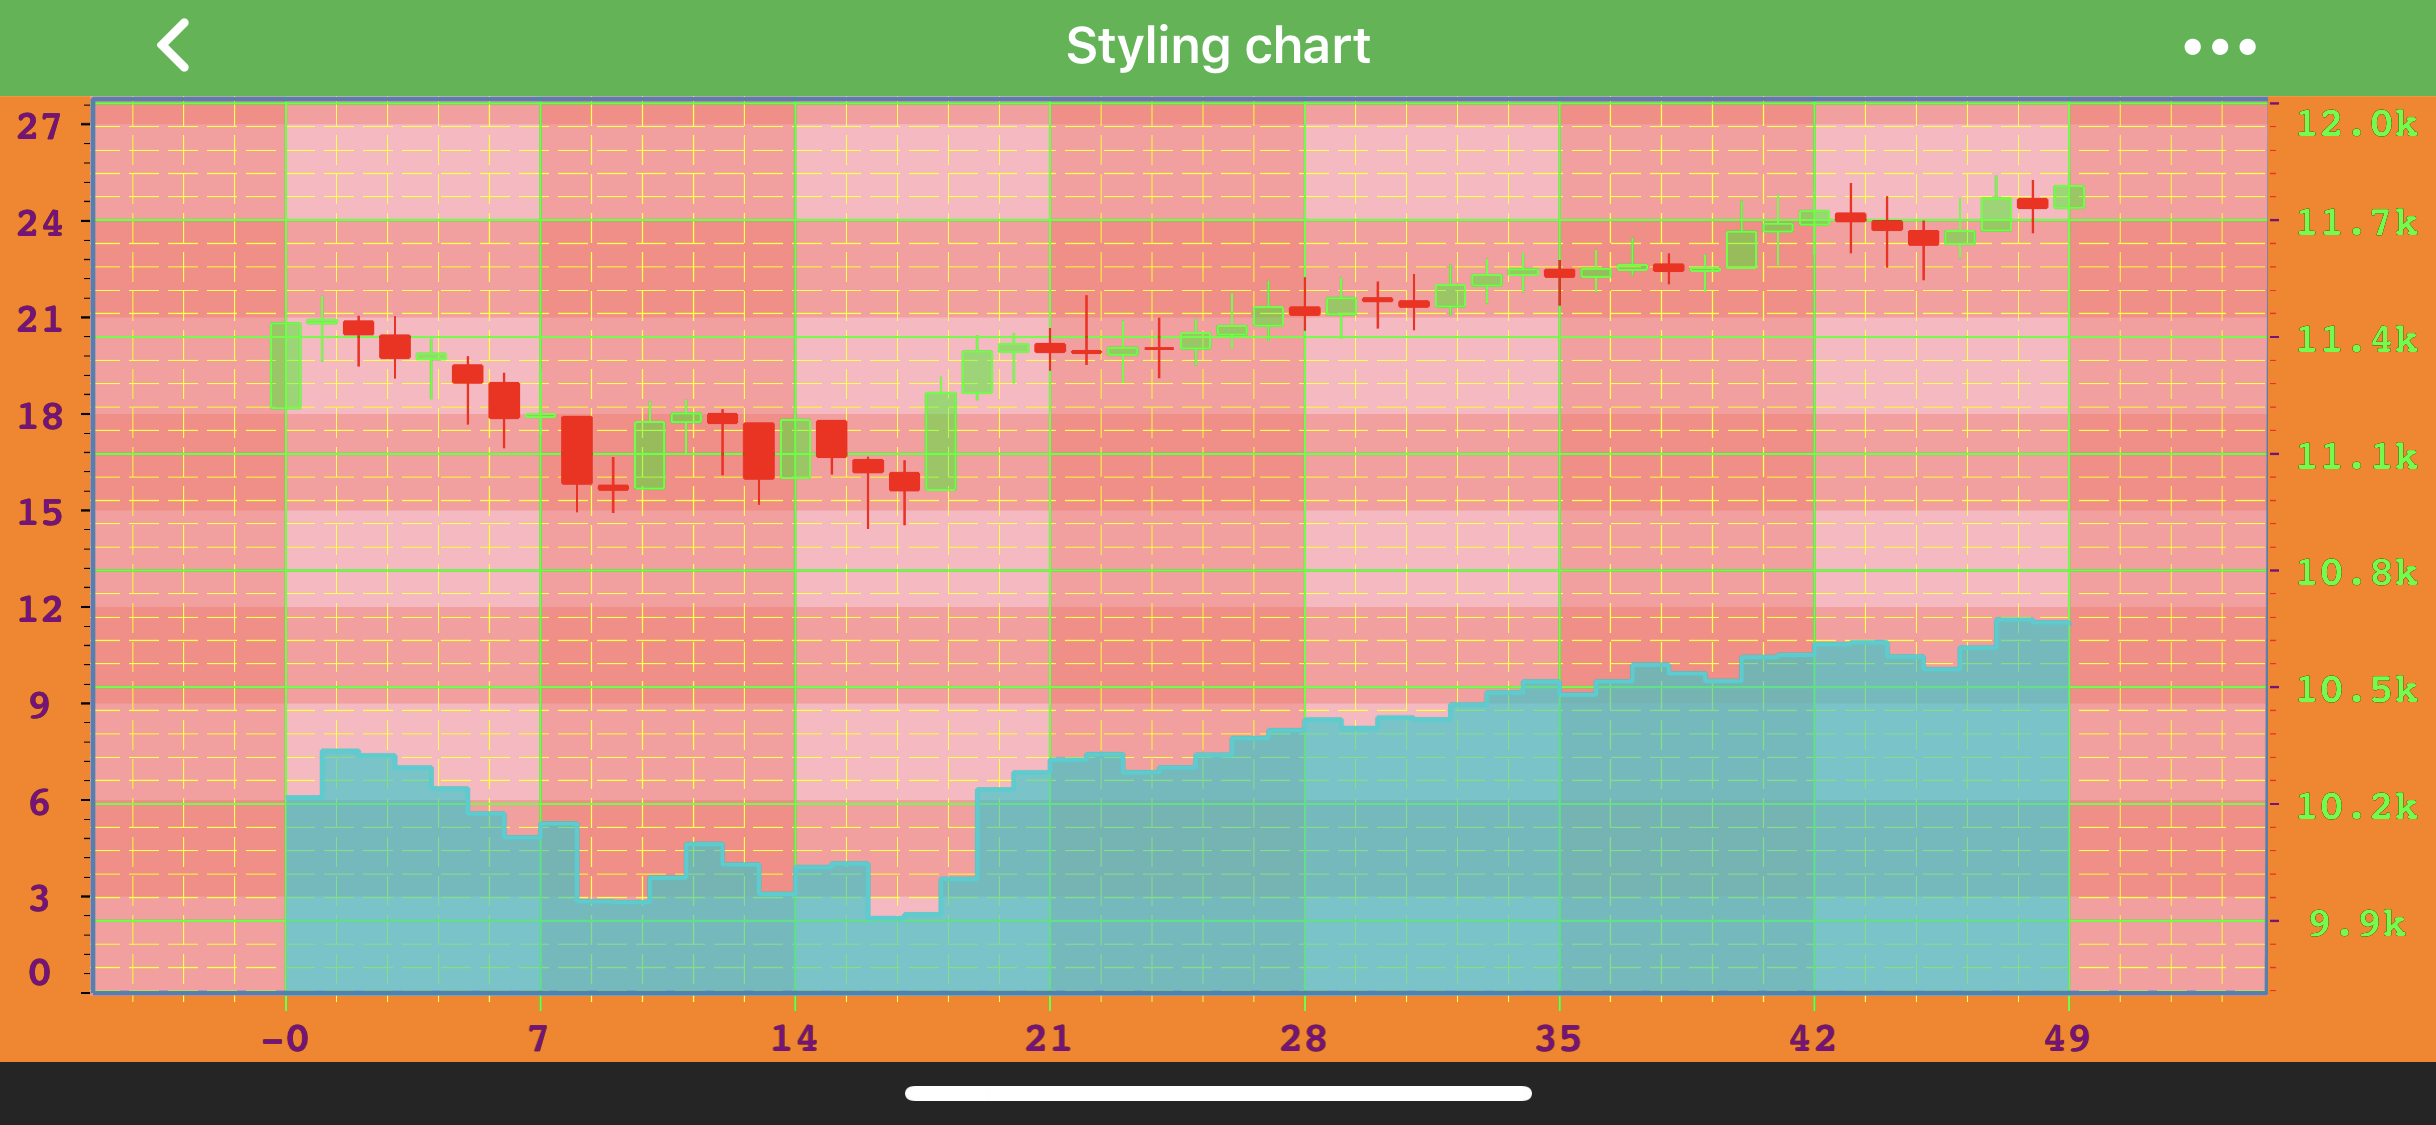
NOTE: Styling Chart example can be found in the SciChart iOS Examples Suite as well as on GitHub:
Styling the Chart Viewport
// self.surface background. If you set color for chart area than it is color only for axes area
self.surface.backgroundColor = UIColor.orangeColor;
// chart area background fill color
self.surface.renderableSeriesAreaFillStyle = [[SCISolidBrushStyle alloc] initWithColorCode:0xFFFFB6C1];
// chart area border color and thickness
self.surface.renderableSeriesAreaBorderStyle = [[SCISolidPenStyle alloc] initWithColorCode:0xFF4682b4 thickness:2];
// surface background. If you set color for chart background than it is color only for axes area
surface.backgroundColor = .orange
// chart area (viewport) background fill color
surface.renderableSeriesAreaFillStyle = SCISolidBrushStyle(colorCode: 0xFFFFB6C1)
// chart area border color and thickness
surface.renderableSeriesAreaBorderStyle = SCISolidPenStyle(colorCode: 0xFF4682b4, thickness: 2)
// Surface background. If you set color for chart background than it is color only for axes area
Surface.BackgroundColor = UIColor.Orange;
// Chart area (viewport) background fill color
Surface.RenderableSeriesAreaFillStyle = new SCISolidBrushStyle(colorCode: 0xFFFFB6C1);
// Chart area border color and thickness
Surface.RenderableSeriesAreaBorderStyle = new SCISolidPenStyle(colorCode: 0xFF4682b4, thickness: 2);
Styling Axis
Each and Every aspect of the axis can be styled. The Axis is responsible for drawing the following parts:
- Title
- Axis Labels
- Tick Lines - small marks on the outside of an axis next to labels
- Gridlines - major and minor
- Axis Bands - shading between the major gridlines
NOTE: You can read more about axis styling in the following articles: