iOS & macOS Charting Documentation - SciChart iOS & macOS Charts SDK v4.x

The Point-Line 3D Chart Type

The 3D Point-Line Charts are provided by the SCIPointLineRenderableSeries3D class.

Point-Line 3D Series Type (No PointMarkers)

NOTE: Examples of the Point-Line 3D Series can be found in the SciChart iOS Examples Suite as well as on GitHub:

Besides the Common Features which are shared between all 3D Chart Types, the SCIPointLineRenderableSeries3D allows you to customize it’s specific properties:

Feature Description
SCIPointLineRenderableSeries3D.stroke allows to specify the stroke color of the lines.
SCIPointLineRenderableSeries3D.strokeThickness allows to specify Line thickness.
SCIPointLineRenderableSeries3D.isAntialiased allows to specify if lines should be antialiased or not.
SCIPointLineRenderableSeries3D.isLineStrips Defines a value indicating whether the lines should be drawn as line strips or as separate lines. See the IsLineStrips Property section.

Also, it is possible to show a gap in a Point-Line 3D Series simply by passing a data-point with a NaN as the Y value.

IsLineStrips Property

The SCIPointLineRenderableSeries3D can be configured to split the line at every other point. This is quite useful if you want to use it to draw a free-form grid. That’s achieved via the SCIPointLineRenderableSeries3D.isLineStrips property.

Line Strips Example

NOTE: Full example sources are available in 3D Charts -> Tooltips and Hit-Test 3D Charts -> Series Tooltips 3D Chart

Create a Line Series

To create a SCIPointLineRenderableSeries3D, use the following code:

SCINumericAxis3D *xAxis = [SCINumericAxis3D new]; xAxis.growBy = [[SCIDoubleRange alloc] initWithMin:0.1 max:0.1]; SCINumericAxis3D *yAxis = [SCINumericAxis3D new]; yAxis.growBy = [[SCIDoubleRange alloc] initWithMin:0.1 max:0.1]; SCINumericAxis3D *zAxis = [SCINumericAxis3D new]; zAxis.growBy = [[SCIDoubleRange alloc] initWithMin:0.1 max:0.1]; SCIXyzDataSeries3D *ds1 = [[SCIXyzDataSeries3D alloc] initWithXType:SCIDataType_Double yType:SCIDataType_Double zType:SCIDataType_Double]; SCIPointMetadataProvider3D *metadataProvider = [SCIPointMetadataProvider3D new]; for (int i = 0; i < 100; ++i) { double x = 5 * sin(i); double y = i; double z = 5 * cos(i); [ds1 appendX:@(x) y:@(y) z:@(z)]; SCIPointMetadata3D *metaData = [[SCIPointMetadata3D alloc] initWithVertexColor:[SCDDataManager randomColor] andScale:[SCDDataManager randomScale]]; [metadataProvider.metadata addObject:metaData]; } SCISpherePointMarker3D *pointMarker = [SCISpherePointMarker3D new]; pointMarker.size = 5.f; SCIPointLineRenderableSeries3D *rs = [SCIPointLineRenderableSeries3D new]; rs.dataSeries = ds1; rs.strokeThickness = 3.0; rs.pointMarker = pointMarker; rs.isLineStrips = YES; rs.metadataProvider = metadataProvider; [SCIUpdateSuspender usingWithSuspendable:self.surface withBlock:^{ self.surface.xAxis = xAxis; self.surface.yAxis = yAxis; self.surface.zAxis = zAxis; [self.surface.renderableSeries add:rs]; [self.surface.chartModifiers add:ExampleViewBase.createDefault3DModifiers]; }];
let xAxis = SCINumericAxis3D() xAxis.growBy = SCIDoubleRange(min: 0.1, max: 0.1) let yAxis = SCINumericAxis3D() yAxis.growBy = SCIDoubleRange(min: 0.1, max: 0.1) let zAxis = SCINumericAxis3D() zAxis.growBy = SCIDoubleRange(min: 0.1, max: 0.1) let dataSeries = SCIXyzDataSeries3D(xType: .double, yType: .double, zType: .double) let pointMetaDataProvider = SCIPointMetadataProvider3D() for i in 0 ..< 100 { let x = 5 * sin(Double(i)) let y = Double(i) let z = 5 * cos(Double(i)) dataSeries.append(x: x, y: y, z: z) let metadata = SCIPointMetadata3D(vertexColor: SCDDataManager.randomColor(), andScale: SCDDataManager.randomScale()) pointMetaDataProvider.metadata.add(metadata) } let pointMarker = SCISpherePointMarker3D() pointMarker.fillColor = UIColor.red.colorARGBCode() pointMarker.size = 10.0 let rs = SCIPointLineRenderableSeries3D() rs.dataSeries = dataSeries rs.strokeThickness = 3.0 rs.pointMarker = pointMarker rs.isLineStrips = true rs.metadataProvider = pointMetaDataProvider SCIUpdateSuspender.usingWith(surface) { self.surface.xAxis = xAxis self.surface.yAxis = yAxis self.surface.zAxis = zAxis self.surface.renderableSeries.add(rs) self.surface.chartModifiers.add(ExampleViewBase.createDefault3DModifiers()) }
var dataManager = DataManager.Instance; var dataSeries3D = new XyzDataSeries3D(); var metadataProvider = new SCIPointMetadataProvider3D(); for (int i = 0; i < 100; i++) { double x = 5 * Math.Sin(i); double y = i; double z = 5 * Math.Cos(i); dataSeries3D.Append(x, y, z); var metadata = new SCIPointMetadata3D((uint)dataManager.GetRandomColor().ToArgb(), dataManager.GetRandomScale()); metadataProvider.Metadata.Add(metadata); } var rSeries3D = new SCIPointLineRenderableSeries3D { DataSeries = dataSeries3D, StrokeThickness = 2f, IsLineStrips = true, PointMarker = new SCISpherePointMarker3D { Size = 5f }, MetadataProvider = metadataProvider, }; using (Surface.SuspendUpdates()) { Surface.XAxis = new SCINumericAxis3D { GrowBy = new SCIDoubleRange(0.1, 0.1) }; Surface.YAxis = new SCINumericAxis3D { GrowBy = new SCIDoubleRange(0.1, 0.1) }; Surface.ZAxis = new SCINumericAxis3D { GrowBy = new SCIDoubleRange(0.1, 0.1) }; Surface.RenderableSeries.Add(rSeries3D); Surface.ChartModifiers.Add(CreateDefault3DModifiers()); Surface.Camera = new SCICamera3D { Position = new SCIVector3(-350, 100, -350), Target = new SCIVector3(0, 50, 0) }; }

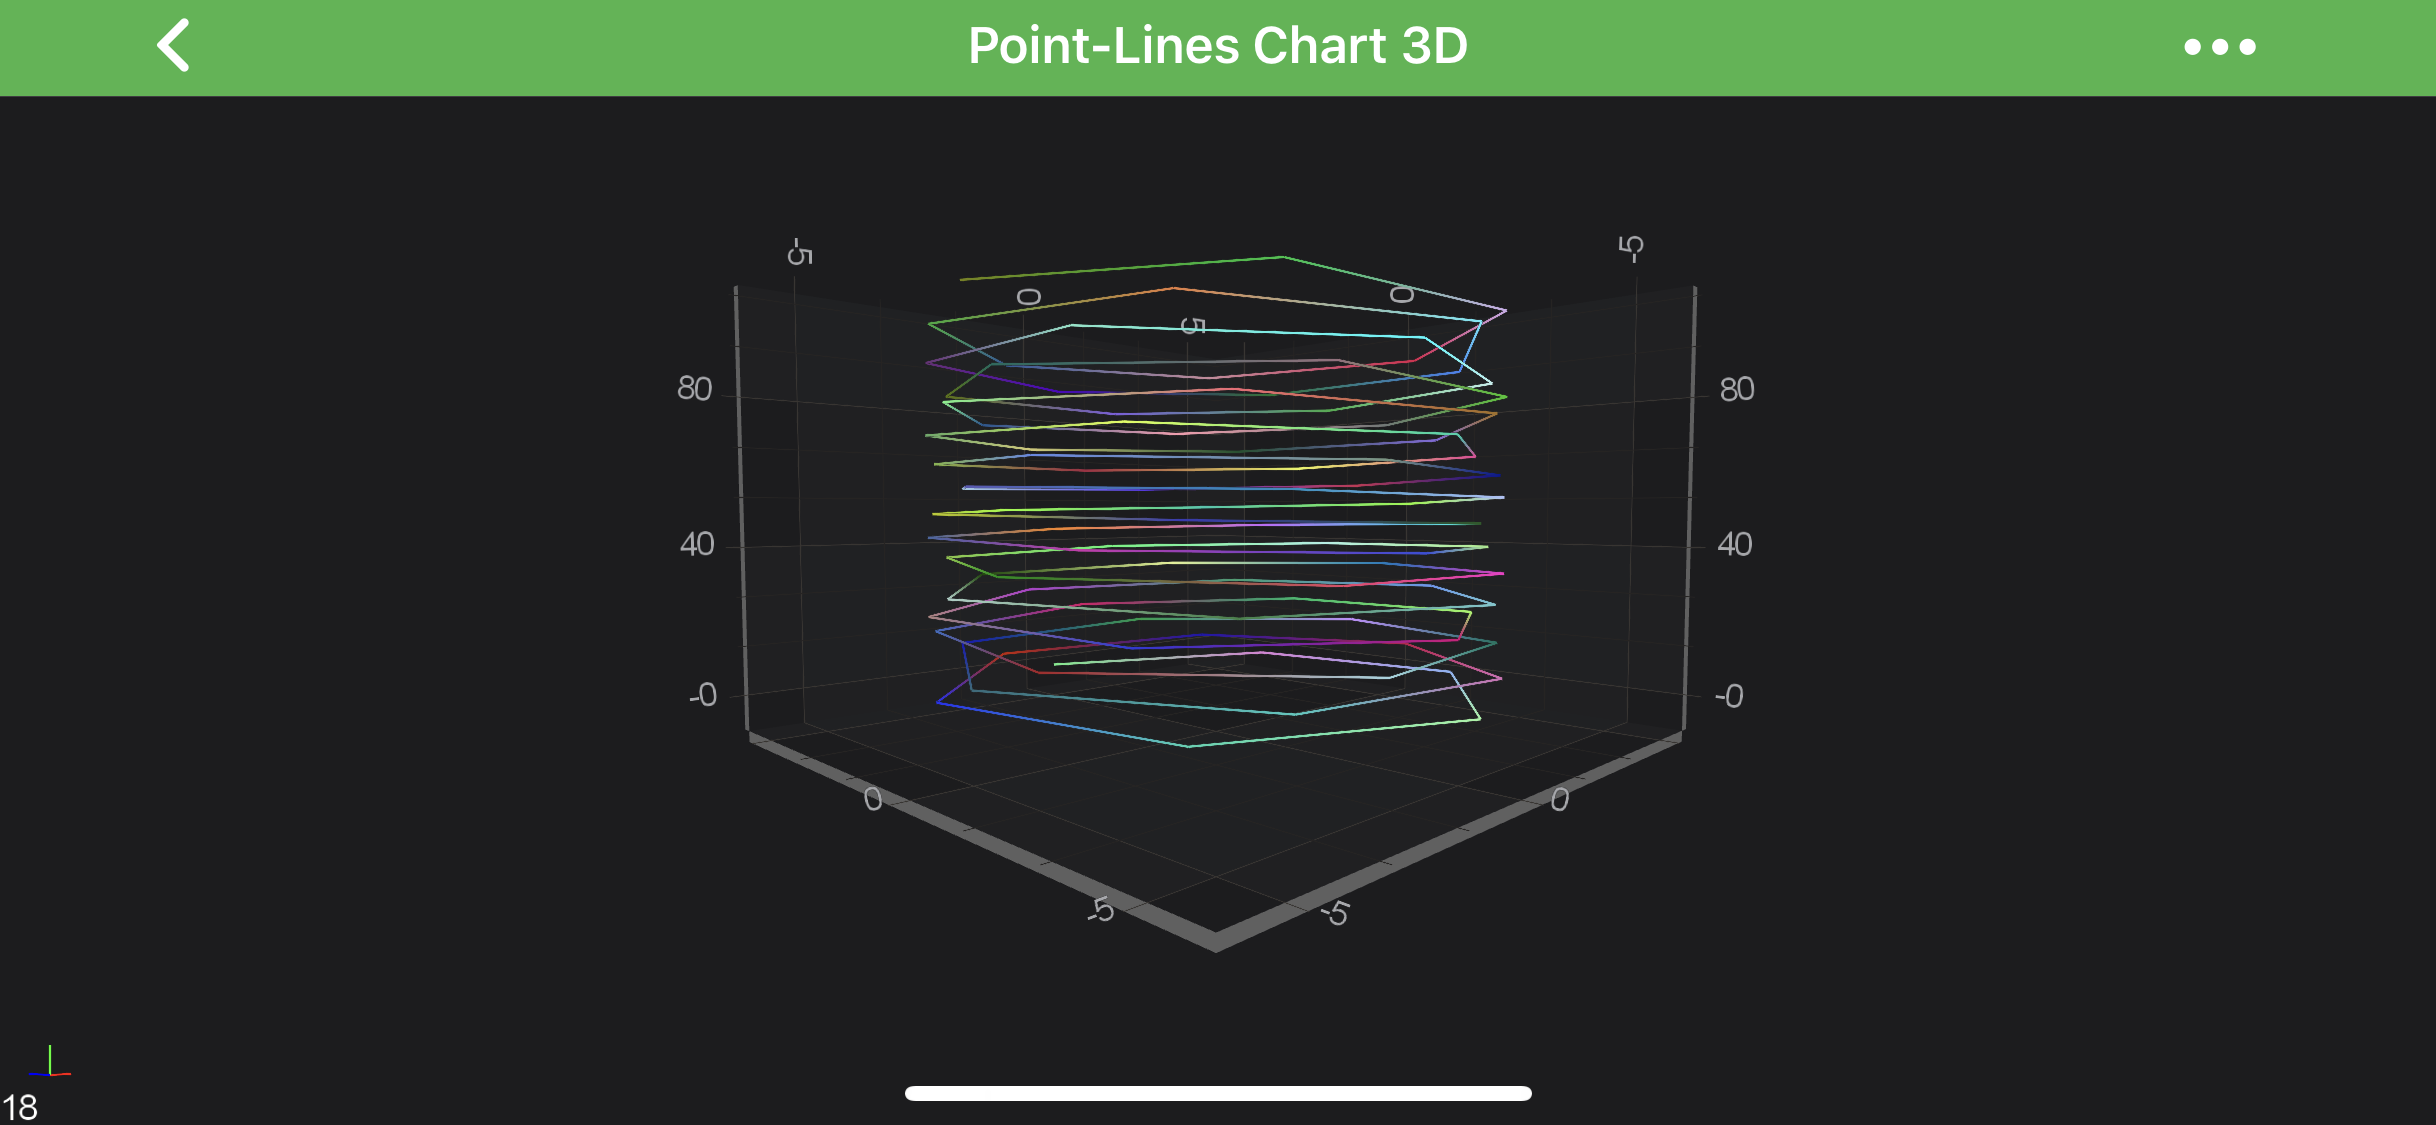
In the code above, a Point-Line Series 3D instance is created. It is assigned to draw the data that is provided by the ISCIDataSeries3D assigned to it. The line is drawn with a stroke color provided by SCIPointMetadataProvider3D instance, but in this particular example, we used our MetadataProvider 3D API, which provides custom colors for individual points of the series. Finally, the Point-Line Series 3D is added to the ISCIChartSurface3D.renderableSeries property.

NOTE: For more information about MetadataProviders - please refer to the MetadataProvider 3D API article.

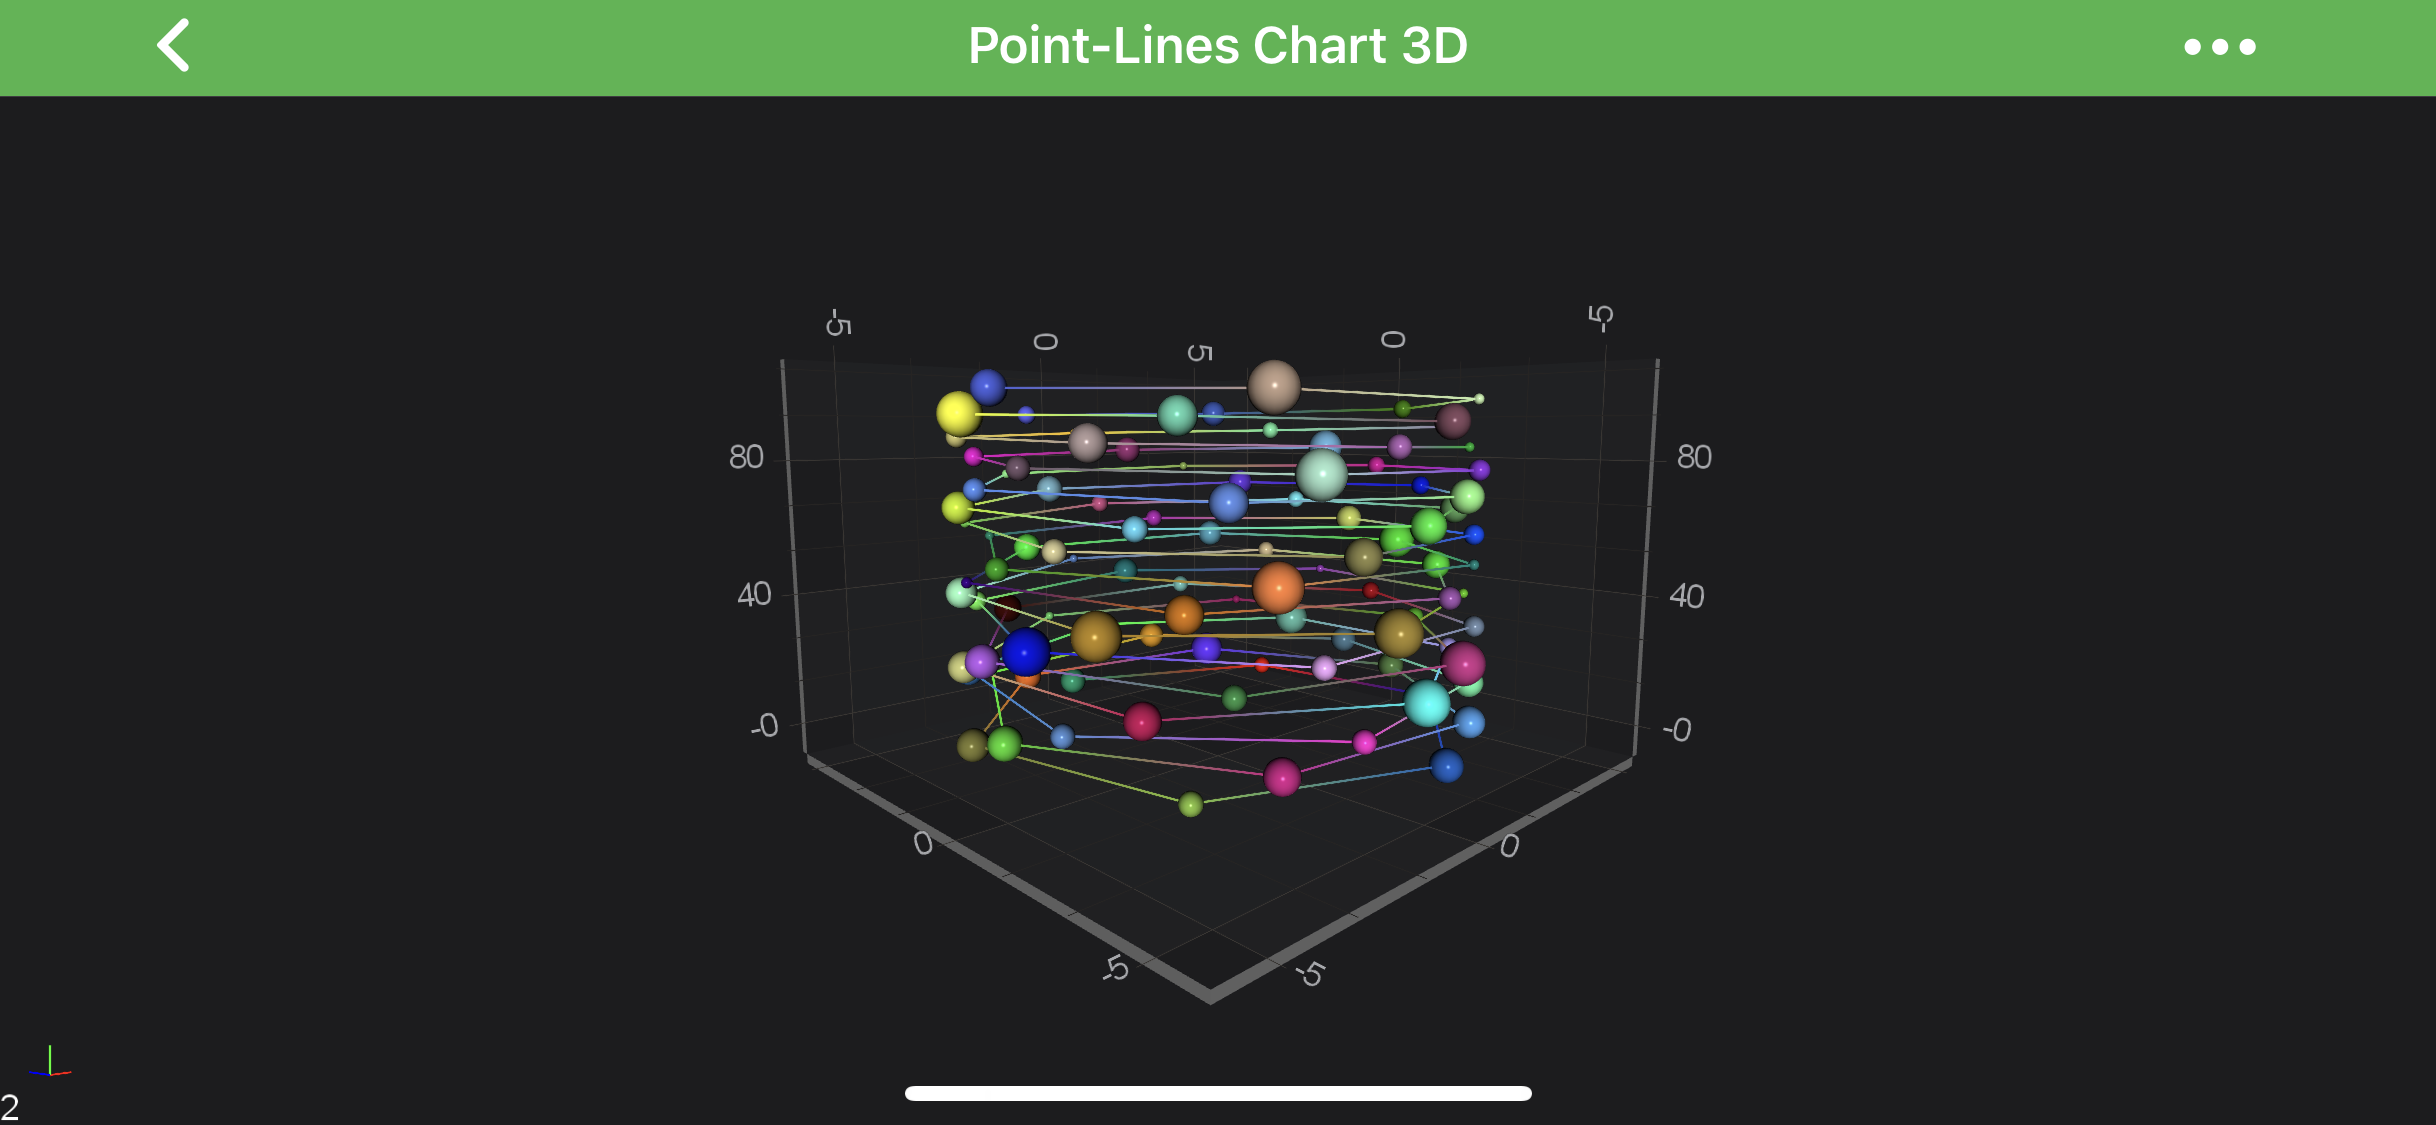
Add Point Markers onto a Point-Line3D Series

Every data point of a Point-Line 3D Series can be marked with a PointMarker 3D. To add Point Markers to the Point-Line 3D, use the following code:

SCISpherePointMarker3D *pointMarker = [SCISpherePointMarker3D new]; pointMarker.size = 5.f; SCIPointLineRenderableSeries3D *rs = [SCIPointLineRenderableSeries3D new]; rs.pointMarker = pointMarker;
let pointMarker = SCISpherePointMarker3D() pointMarker.size = 5.0 let rs = SCIPointLineRenderableSeries3D() rs.pointMarker = pointMarker
var rSeries3D = new SCIPointLineRenderableSeries3D { PointMarker = new SCISpherePointMarker3D { Size = 5f } };

Point-Line 3D Series Type

To learn more about Point Markers 3D, please refer to the PointMarkers 3D API article.

NOTE: This feature can be used to create a Scatter 3D Series.

Paint Line Segments With Different Colors

Is SciChart, you can draw line segments with different colors using the MetadataProvider 3D API. To Use metadata provider for Point-Line 3D Series - a SCIPointMetadata3D has to be provided to the ISCIRenderableSeries3D.metadataProvider property. For more information - please refer to the MetadataProvider 3D API article.