A SCILineAnnotation is placed on a chart at the position determined by its [X1, Y1] and [X2, Y2] coordinates, which specifies the two line ends.
Those can be accessed via the following properties:
NOTE: The xAxisId and yAxisId must be supplied if you have an axis with non-default Axis Ids, e.g. in multi-axis scenario.
Create a LineAnnotation
A SCILineAnnotation can be added onto a chart using the following code:
// Assume a surface has been created and configured somewhere
id<ISCIChartSurface> surface;
// Create a Line Annotation
SCILineAnnotation *lineAnnotation = [SCILineAnnotation new];
// Allow to interact with the annotation in run-time
lineAnnotation.isEditable = YES;
// in a multi-axis scenario, specify the XAxisId and YAxisId
lineAnnotation.xAxisId = TopAxisId;
lineAnnotation.yAxisId = LeftAxisId;
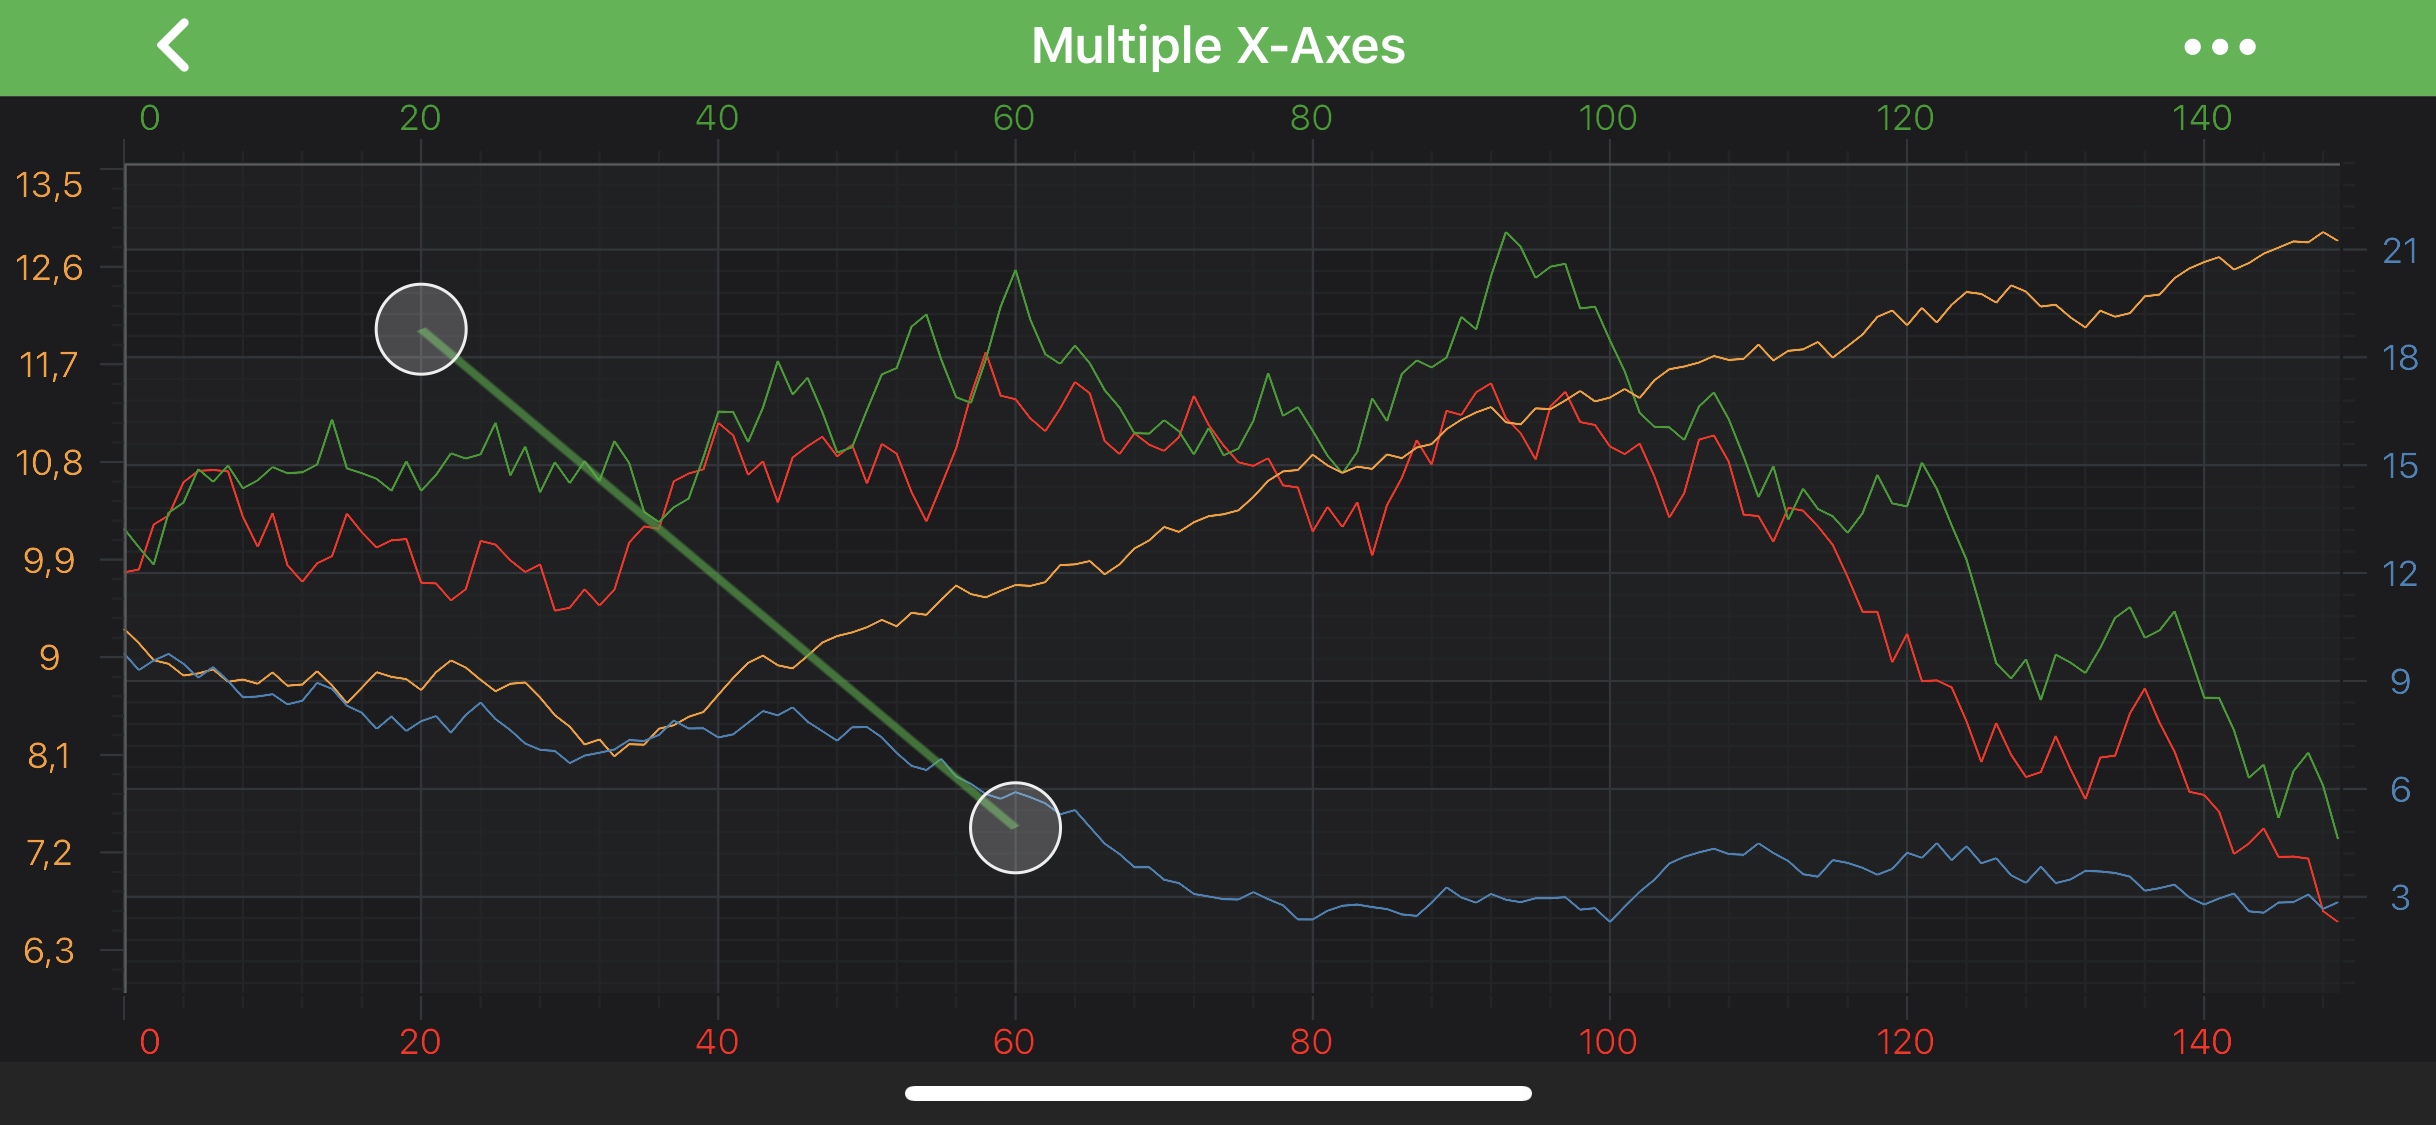
// Specify a desired position by setting coordinates
lineAnnotation.coordinateMode = SCIAnnotationCoordinateMode_RelativeY;
lineAnnotation.x1 = @(20);
lineAnnotation.y1 = @(0.2);
lineAnnotation.x2 = @(60);
lineAnnotation.y2 = @(0.8);
// Specify the stroke color for the annotation
lineAnnotation.stroke = [[SCISolidPenStyle alloc] initWithColorCode:0x9942AD42 thickness:4];
// Add the annotation to the Annotations collection of the surface
[self.surface.annotations add:lineAnnotation];
// Assume a surface has been created and configured somewhere
let surface: ISCIChartSurface
// Create a Line Annotation
let lineAnnotation = SCILineAnnotation()
// Allow to interact with the annotation in run-time
lineAnnotation.isEditable = true
// In a multi-axis scenario, specify the XAxisId and YAxisId
lineAnnotation.xAxisId = TopAxisId
lineAnnotation.yAxisId = LeftAxisId
// Specify a desired position by setting coordinates
lineAnnotation.coordinateMode = .relativeY
lineAnnotation.set(x1: 20)
lineAnnotation.set(y1: 0.2)
lineAnnotation.set(x2: 60)
lineAnnotation.set(y2: 0.8)
// Specify the stroke color for the annotation
lineAnnotation.stroke = SCISolidPenStyle(colorCode: 0x9942AD42, thickness: 4)
// Add the annotation to the Annotations collection of the surface
self.surface.annotations.add(lineAnnotation)
// Assume a surface has been created and configured somewhere
IISCIChartSurface surface;
// Create a Line Annotation
var lineAnnotation = new SCILineAnnotation
{
// Allow to interact with the annotation in run-time
IsEditable = true,
// In a multi-axis scenario, specify the XAxisId and YAxisId
XAxisId = TopAxisId,
YAxisId = LeftAxisId,
// Specify a desired position by setting coordinates
CoordinateMode = SCIAnnotationCoordinateMode.RelativeY,
X1Value = 20,
Y1Value = 0.2,
X2Value = 60,
Y2Value = 0.8,
// Specify the stroke color for the annotation
Stroke = new SCISolidPenStyle(0x9942AD42, 4),
};
// Add the annotation to the Annotations collection of the surface
Surface.Annotations.Add(lineAnnotation);
NOTE: To learn more about other Annotation Types, available out of the box in SciChart, please find the comprehensive list in the Annotation APIs article.
 View on GitHub