 View on GitHub
iOS & macOS Charting Documentation - SciChart iOS & macOS Charts SDK v4.x
Custom RenderableSeries API
If the built-in chart types in SciChart are not enough, you can create your own RenderableSeries. Custom RenderableSeries should extend SCIRenderableSeriesBase if you want to provide some custom data, or one of predefined base classes if you want to display data from one of default ISCIDataSeries implementations.
| Base class for Custom RenderableSeries | When to use |
|---|---|
SCIXyRenderableSeriesBase |
If you want to use SCIXyDataSeries as data source for custom RenderableSeries |
SCIXyyRenderableSeriesBase |
If you want to use SCIXyyDataSeries as data source for custom RenderableSeries |
SCIHlRenderableSeriesBase |
If you want to use SCIHlDataSeries as data source for custom RenderableSeries |
SCIOhlcRenderableSeriesBase |
If you want to use SCIOhlcDataSeries as data source for custom RenderableSeries |
SCIXyzRenderableSeriesBase |
If you want to use SCIXyzDataSeries as data source for custom RenderableSeries |
SCIRenderableSeriesBase |
If default ISCIDataSeries implementations aren’t suitable for data which should be displayed and you want to create custom DataSeries type |
Creating your Own Series
For example, let’s try to create a RenderableSeries, which draws PointMarker at specified [x, y] coordinates. Since, SCIXyDataSeries is enough to define [x, y] data we will extend SCIXyRenderableSeriesBase:
As showed in the code above, the main method, which has to be implemented is the internalDraw, which allows you to perform any custom drawings you want. The ISCIRenderContext2D and ISCIAssetManager2D are passed into it, which should be used to draw to the screen and which are the parts of the graphics context for this render pass.
The current Data to Draw - ISCISeriesRenderPassData protocol
The data to draw is contained in the ISCISeriesRenderPassData passed in to the internalDraw method. Using the RenderPassData object you can access the data values and coordinates to draw, the xPointRange (the indices of the data to draw, inclusive), the X and Y Coordinate Calculators, that transforms data to pixel coordinates. All the above accessed through the following properties:
SCIXyRenderPassData.yValues(other RenderPassData types might have other properties)SCIXyRenderPassData.yCoords(other RenderPassData types might have other properties)SCISeriesRenderPassData.xPointRangeISCISeriesRenderPassData.xCoordinateCalculatorISCISeriesRenderPassData.yCoordinateCalculator
Depending on DataSeries type you can have a different ISCISeriesRenderPassData type and different ways to access the data to draw.
| Series RenderPassData Type | DataSeries type used |
|---|---|
SCIXyRenderPassData |
If you want to use SCIXyDataSeries as data source for custom RenderableSeries |
SCIXyyRenderPassData |
If you want to use SCIXyyDataSeries as data source for custom RenderableSeries |
SCIXyzRenderPassData |
If you want to use SCIXyzDataSeries as data source for custom RenderableSeries |
SCIOhlcRenderPassData |
If you want to use SCIOhlcDataSeries as data source for custom RenderableSeries |
SCIHlRenderPassData |
If you want to use SCIHlDataSeries as data source for custom RenderableSeries |
SCIUniformHeatmapRenderPassData |
If you want to use SCIUniformHeatmapDataSeries as data source for custom RenderableSeries |
The types above could be extended to add some additional information which is required for rendering, e.g. SCIColumnRenderPassData extends SCIXyRenderPassData and adds fields for caching of column width in pixels and coordinate of zero line.
Example: RoundedColumnRenderableSeries
We have an example which shows how to create a rounded column series with this powerful API.
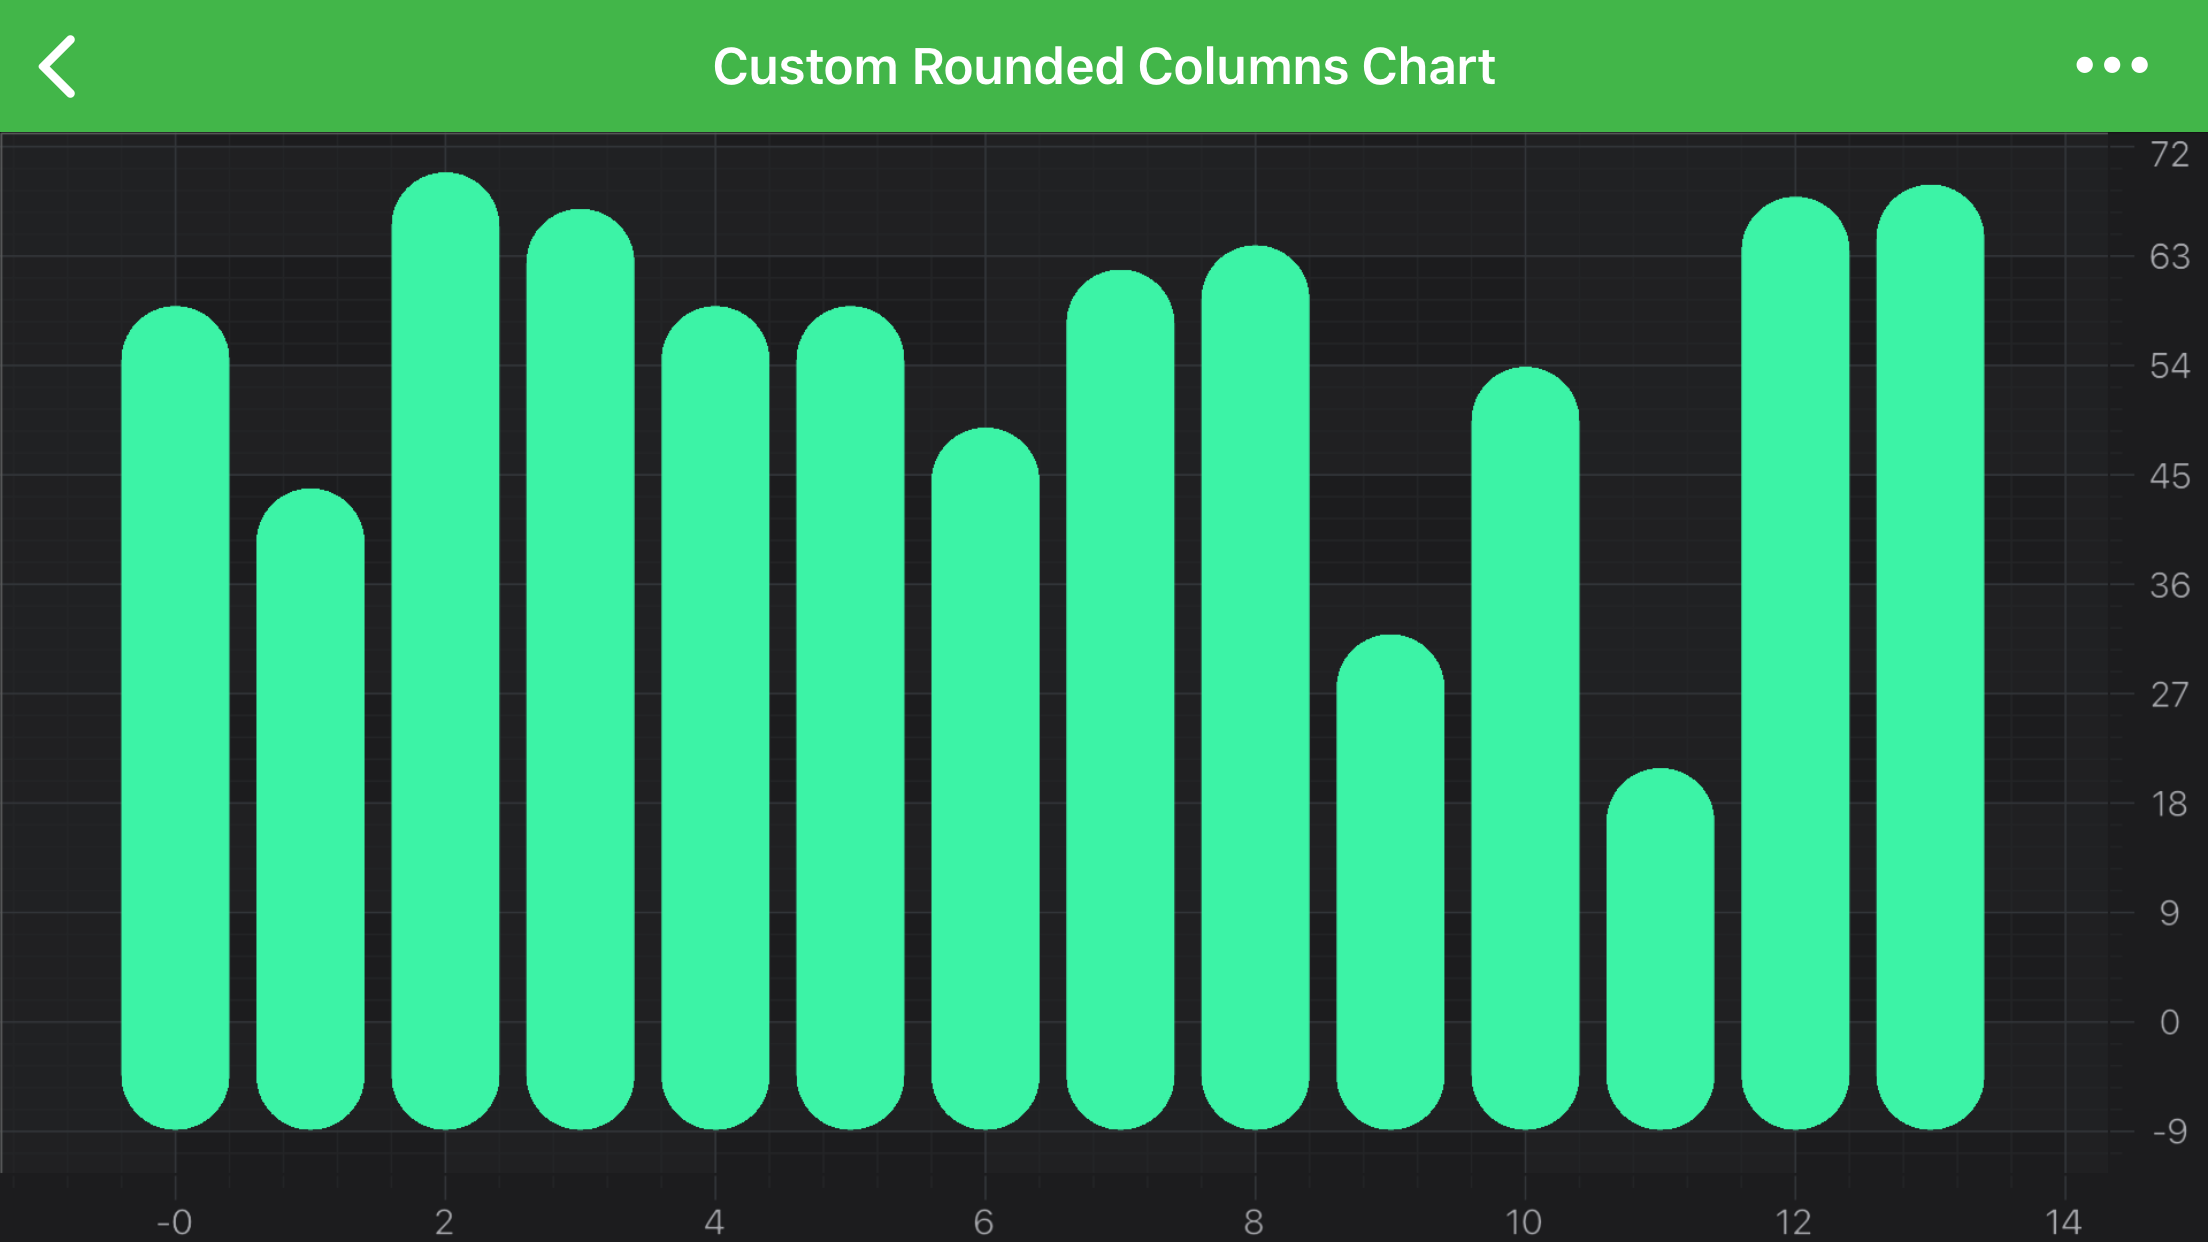
NOTE: The full Rounded Column Chart example can be found in the SciChart iOS Examples Suite as well as on GitHub: