SciChart® the market leader in Fast WPF Charts, WPF 3D Charts, iOS Chart, Android Chart and JavaScript Chart Components
Please note! These examples are new to SciChart iOS v4 release! SciChart’s OpenGL ES and Metal iOS and Metal macOS Chart library ships with hundred of Objective-C and Swift iOS&macOS Chart Examples which you can browse, play with and view the source-code. All of this is possible with the new and improved SciChart iOS Examples Suite and demo application for Mac, which ships as part of the SciChart SDK.
SciChart iOS Charts supports an extremely flexible way to customize the chart.
Custom RenderableSeries should extend SCIRenderableSeriesBase if you want to provide some custom data, or one of predefined base classes if you want to display data from one of default ISCIDataSeries implementations.
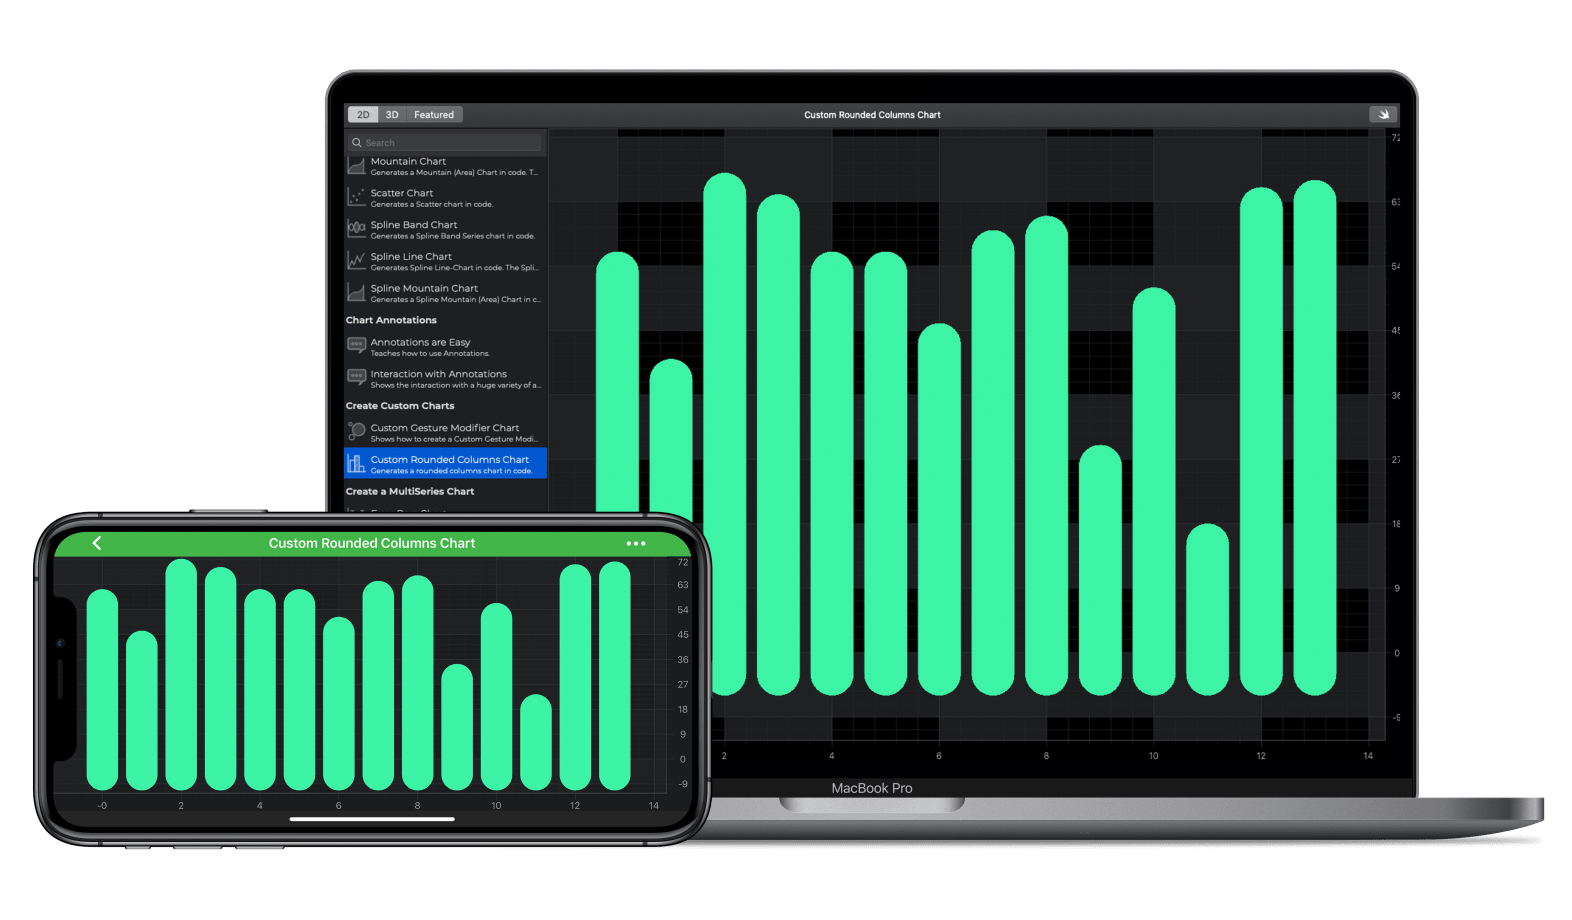
In this example we demonstrate using the Custom Series API to create a Rounded Column chart. Using this extremely flexible and powerful API you can create all manner of new iOS Chart types using SciChart. Please read more about Custom RenderableSeries API in our iOS Documentation.
The Swift and Objective-C source code for the iOS and macOS Custom Series Rounded Column Example example is included below (Scroll down!).
Did you know that we have the source code for all our example available for free on Github?
Clone the SciChart.iOS.Examples from Github.
Also the SciChart iOS and Scichart macOS Trials contain the full source for the examples (link below).
//******************************************************************************
// SCICHART® Copyright SciChart Ltd. 2011-2019. All rights reserved.
//
// Web: http://www.scichart.com
// Support: support@scichart.com
// Sales: sales@scichart.com
//
// RoundedColumnsChart.m is part of the SCICHART® Examples. Permission is hereby granted
// to modify, create derivative works, distribute and publish any part of this source
// code whether for commercial, private or personal use.
//
// The SCICHART® examples are distributed in the hope that they will be useful, but
// without any warranty. It is provided "AS IS" without warranty of any kind, either
// expressed or implied.
//******************************************************************************
#import "RoundedColumnsChart.h"
#import "SCDRoundedColumnRenderableSeries.h"
@implementation RoundedColumnsChart
- (Class)associatedType { return SCIChartSurface.class; }
- (BOOL)showDefaultModifiersInToolbar { return NO; }
- (void)initExample {
id<ISCIAxis> xAxis = [SCINumericAxis new];
xAxis.growBy = [[SCIDoubleRange alloc] initWithMin:0.1 max:0.1];
id<ISCIAxis> yAxis = [SCINumericAxis new];
yAxis.growBy = [[SCIDoubleRange alloc] initWithMin:0.2 max:0.2];
SCIXyDataSeries *dataSeries = [[SCIXyDataSeries alloc] initWithXType:SCIDataType_Int yType:SCIDataType_Int];
int yValues[] = {50, 35, 61, 58, 50, 50, 40, 53, 55, 23, 45, 12, 59, 60};
for (unsigned long i = 0; i < sizeof(yValues)/sizeof(yValues[0]); i++) {
[dataSeries appendX:@(i) y:@(yValues[i])];
}
SCDRoundedColumnRenderableSeries *rSeries = [SCDRoundedColumnRenderableSeries new];
rSeries.dataSeries = dataSeries;
rSeries.fillBrushStyle = [[SCISolidBrushStyle alloc] initWithColorCode:0xff3cf3a6];
[SCIUpdateSuspender usingWithSuspendable:self.surface withBlock:^{
[self.surface.xAxes add:xAxis];
[self.surface.yAxes add:yAxis];
[self.surface.renderableSeries add:rSeries];
[self.surface.chartModifiers add:[SCDExampleBaseViewController createDefaultModifiers]];
[SCIAnimations scaleSeries:rSeries duration:3.0 andEasingFunction:[SCIElasticEase new]];
}];
}
@end
//******************************************************************************
// SCICHART® Copyright SciChart Ltd. 2011-2019. All rights reserved.
//
// Web: http://www.scichart.com
// Support: support@scichart.com
// Sales: sales@scichart.com
//
// RoundedColumnsChart.swift is part of the SCICHART® Examples. Permission is hereby granted
// to modify, create derivative works, distribute and publish any part of this source
// code whether for commercial, private or personal use.
//
// The SCICHART® examples are distributed in the hope that they will be useful, but
// without any warranty. It is provided "AS IS" without warranty of any kind, either
// expressed or implied.
//******************************************************************************
class RoundedColumnsChart: SCDSingleChartViewController<SCIChartSurface> {
override var associatedType: AnyClass { return SCIChartSurface.self }
override var showDefaultModifiersInToolbar: Bool { return false }
override func initExample() {
let xAxis = SCINumericAxis()
xAxis.growBy = SCIDoubleRange(min: 0.1, max: 0.1)
let yAxis = SCINumericAxis()
yAxis.growBy = SCIDoubleRange(min: 0.2, max: 0.2)
let dataSeries = SCIXyDataSeries(xType: .int, yType: .int)
let yValues = [50, 35, 61, 58, 50, 50, 40, 53, 55, 23, 45, 12, 59, 60]
for i in 0 ..< yValues.count {
dataSeries.append(x: i, y: yValues[i])
}
let rSeries = SCDRoundedColumnRenderableSeries()
rSeries.fillBrushStyle = SCISolidBrushStyle(colorCode: 0xff3cf3a6)
rSeries.dataSeries = dataSeries
SCIUpdateSuspender.usingWith(surface) {
self.surface.xAxes.add(xAxis)
self.surface.yAxes.add(yAxis)
self.surface.renderableSeries.add(rSeries)
self.surface.chartModifiers.add(SCDExampleBaseViewController.createDefaultModifiers())
SCIAnimations.scale(rSeries, duration: 3.0, andEasingFunction: SCIElasticEase())
}
}
}
//******************************************************************************
// SCICHART® Copyright SciChart Ltd. 2011-2019. All rights reserved.
//
// Web: http://www.scichart.com
// Support: support@scichart.com
// Sales: sales@scichart.com
//
// SCDRoundedColumnRenderableSeries.m is part of the SCICHART® Examples. Permission is hereby granted
// to modify, create derivative works, distribute and publish any part of this source
// code whether for commercial, private or personal use.
//
// The SCICHART® examples are distributed in the hope that they will be useful, but
// without any warranty. It is provided "AS IS" without warranty of any kind, either
// expressed or implied.
//******************************************************************************
#import "SCDRoundedColumnRenderableSeries.h"
#import <SciChart/SCIFastColumnRenderableSeries+Protected.h>
@implementation SCDRoundedColumnRenderableSeries {
SCIFloatValues *_topEllipsesBuffer;
SCIFloatValues *_rectsBuffer;
SCIFloatValues *_bottomEllipsesBuffer;
}
- (instancetype)init {
id<ISCIHitProvider> hitProvider = [SCIColumnHitProvider new];
self = [super initWithRenderPassData:[SCIColumnRenderPassData new] hitProvider:hitProvider nearestPointProvider:[SCINearestColumnPointProvider new]];
if (self) {
_topEllipsesBuffer = [SCIFloatValues new];
_rectsBuffer = [SCIFloatValues new];
_bottomEllipsesBuffer = [SCIFloatValues new];
}
return self;
}
- (void)disposeCachedData {
[super disposeCachedData];
[_topEllipsesBuffer dispose];
[_rectsBuffer dispose];
[_bottomEllipsesBuffer dispose];
}
- (void)internalDrawWithContext:(id<ISCIRenderContext2D>)renderContext assetManager:(id<ISCIAssetManager2D>)assetManager renderPassData:(id<ISCISeriesRenderPassData>)renderPassData {
// Don't draw transparent series
if (self.opacity == 0) return;
SCIBrushStyle *fillStyle = self.fillBrushStyle;
if (fillStyle == nil || !fillStyle.isVisible) return;
SCIColumnRenderPassData *rpd = (SCIColumnRenderPassData *)renderPassData;
[self p_SCD_updateDrawingBuffersWithData:rpd columnPixelWidth:rpd.columnPixelWidth andZeroLine:rpd.zeroLineCoord];
id<ISCIBrush2D> brush = [assetManager brushWithStyle:fillStyle];
[renderContext fillRectsWithBrush:brush points:_rectsBuffer.itemsArray startIndex:0 count:(int)_rectsBuffer.count];
[renderContext fillEllipsesWithBrush:brush points:_topEllipsesBuffer.itemsArray startIndex:0 count:(int)_topEllipsesBuffer.count];
[renderContext fillEllipsesWithBrush:brush points:_bottomEllipsesBuffer.itemsArray startIndex:0 count:(int)_topEllipsesBuffer.count];
}
- (void)p_SCD_updateDrawingBuffersWithData:(SCIColumnRenderPassData *)renderPassData columnPixelWidth:(float)columnPixelWidth andZeroLine:(float)zeroLine {
float halfWidth = columnPixelWidth / 2;
_topEllipsesBuffer.count = renderPassData.pointsCount * 4;
_rectsBuffer.count = renderPassData.pointsCount * 4;
_bottomEllipsesBuffer.count = renderPassData.pointsCount * 4;
float *topArray = _topEllipsesBuffer.itemsArray;
float *rectsArray = _rectsBuffer.itemsArray;
float *bottomArray = _bottomEllipsesBuffer.itemsArray;
float *xCoordsArray = renderPassData.xCoords.itemsArray;
float *yCoordsArray = renderPassData.yCoords.itemsArray;
for (NSInteger i = 0, count = renderPassData.pointsCount; i < count; i++) {
float x = xCoordsArray[i];
float y = yCoordsArray[i];
topArray[i * 4 + 0] = x - halfWidth;
topArray[i * 4 + 1] = y;
topArray[i * 4 + 2] = x + halfWidth;
topArray[i * 4 + 3] = y - columnPixelWidth;
rectsArray[i * 4 + 0] = x - halfWidth;
rectsArray[i * 4 + 1] = y - halfWidth;
rectsArray[i * 4 + 2] = x + halfWidth;
rectsArray[i * 4 + 3] = zeroLine + halfWidth;
bottomArray[i * 4 + 0] = x - halfWidth;
bottomArray[i * 4 + 1] = zeroLine + columnPixelWidth;
bottomArray[i * 4 + 2] = x + halfWidth;
bottomArray[i * 4 + 3] = zeroLine;
}
}
@end
//******************************************************************************
// SCICHART® Copyright SciChart Ltd. 2011-2019. All rights reserved.
//
// Web: http://www.scichart.com
// Support: support@scichart.com
// Sales: sales@scichart.com
//
// SCDRoundedColumnRenderableSeries.swift is part of the SCICHART® Examples. Permission is hereby granted
// to modify, create derivative works, distribute and publish any part of this source
// code whether for commercial, private or personal use.
//
// The SCICHART® examples are distributed in the hope that they will be useful, but
// without any warranty. It is provided "AS IS" without warranty of any kind, either
// expressed or implied.
//******************************************************************************
import SciChart.Protected.SCIFastColumnRenderableSeries
class SCDRoundedColumnRenderableSeries: SCIFastColumnRenderableSeries {
var topEllipsesBuffer = SCIFloatValues()
var rectsBuffer = SCIFloatValues()
var bottomEllipsesBuffer = SCIFloatValues()
override init() {
let hitProvider = SCIColumnHitProvider()
super.init(renderPassData: SCIColumnRenderPassData(), hitProvider: hitProvider, nearestPointProvider: SCINearestColumnPointProvider())
}
override func disposeCachedData() {
super.disposeCachedData()
topEllipsesBuffer.dispose()
rectsBuffer.dispose()
bottomEllipsesBuffer.dispose()
}
override func internalDraw(with renderContext: ISCIRenderContext2D!, assetManager: ISCIAssetManager2D!, renderPassData: ISCISeriesRenderPassData!) {
// Don't draw transparent series
guard self.opacity != 0 else { return }
guard let fillStyle = self.fillBrushStyle else { return }
guard fillStyle.isVisible else { return }
let rpd = renderPassData as! SCIColumnRenderPassData
updateDrawingBuffersWithData(renderPassData: rpd, columnPixelWidth: rpd.columnPixelWidth, zeroLine: rpd.zeroLineCoord)
let brush = assetManager.brush(with: fillStyle)
renderContext.fillRects(with: brush, points: UnsafeMutablePointer<Float>(mutating: rectsBuffer.itemsArray), start: 0, count: Int32(rectsBuffer.count))
renderContext.fillEllipses(with: brush, points: UnsafeMutablePointer<Float>(mutating: topEllipsesBuffer.itemsArray), start: 0, count: Int32(topEllipsesBuffer.count))
renderContext.fillEllipses(with: brush, points: UnsafeMutablePointer<Float>(mutating: bottomEllipsesBuffer.itemsArray), start: 0, count: Int32(bottomEllipsesBuffer.count))
}
fileprivate func updateDrawingBuffersWithData(renderPassData: SCIColumnRenderPassData, columnPixelWidth: Float, zeroLine: Float) {
let halfWidth = columnPixelWidth / 2;
topEllipsesBuffer.count = renderPassData.pointsCount * 4
rectsBuffer.count = renderPassData.pointsCount * 4
bottomEllipsesBuffer.count = renderPassData.pointsCount * 4
for i in 0 ..< renderPassData.pointsCount {
let x = renderPassData.xCoords.getValueAt(i)
let y = renderPassData.yCoords.getValueAt(i)
topEllipsesBuffer.set(x - halfWidth, at: i * 4 + 0)
topEllipsesBuffer.set(y, at: i * 4 + 1)
topEllipsesBuffer.set(x + halfWidth, at: i * 4 + 2)
topEllipsesBuffer.set(y - columnPixelWidth, at: i * 4 + 3)
rectsBuffer.set(x - halfWidth, at: i * 4 + 0)
rectsBuffer.set(y - halfWidth, at: i * 4 + 1)
rectsBuffer.set(x + halfWidth, at: i * 4 + 2)
rectsBuffer.set(zeroLine + halfWidth, at: i * 4 + 3)
bottomEllipsesBuffer.set(x - halfWidth, at: i * 4 + 0)
bottomEllipsesBuffer.set(zeroLine + columnPixelWidth, at: i * 4 + 1)
bottomEllipsesBuffer.set(x + halfWidth, at: i * 4 + 2)
bottomEllipsesBuffer.set(zeroLine, at: i * 4 + 3)
}
}
}