Like the SCIXyScatterRenderableSeries type, SCIFastImpulseRenderableSeries requires a shape to be specified for the Point Markers. There are several shapes available out of the box, as well as it is possible to define custom shapes of the Point Markers.
NOTE: For the detailed description of Point Markers, please see the PointMarkers API article.
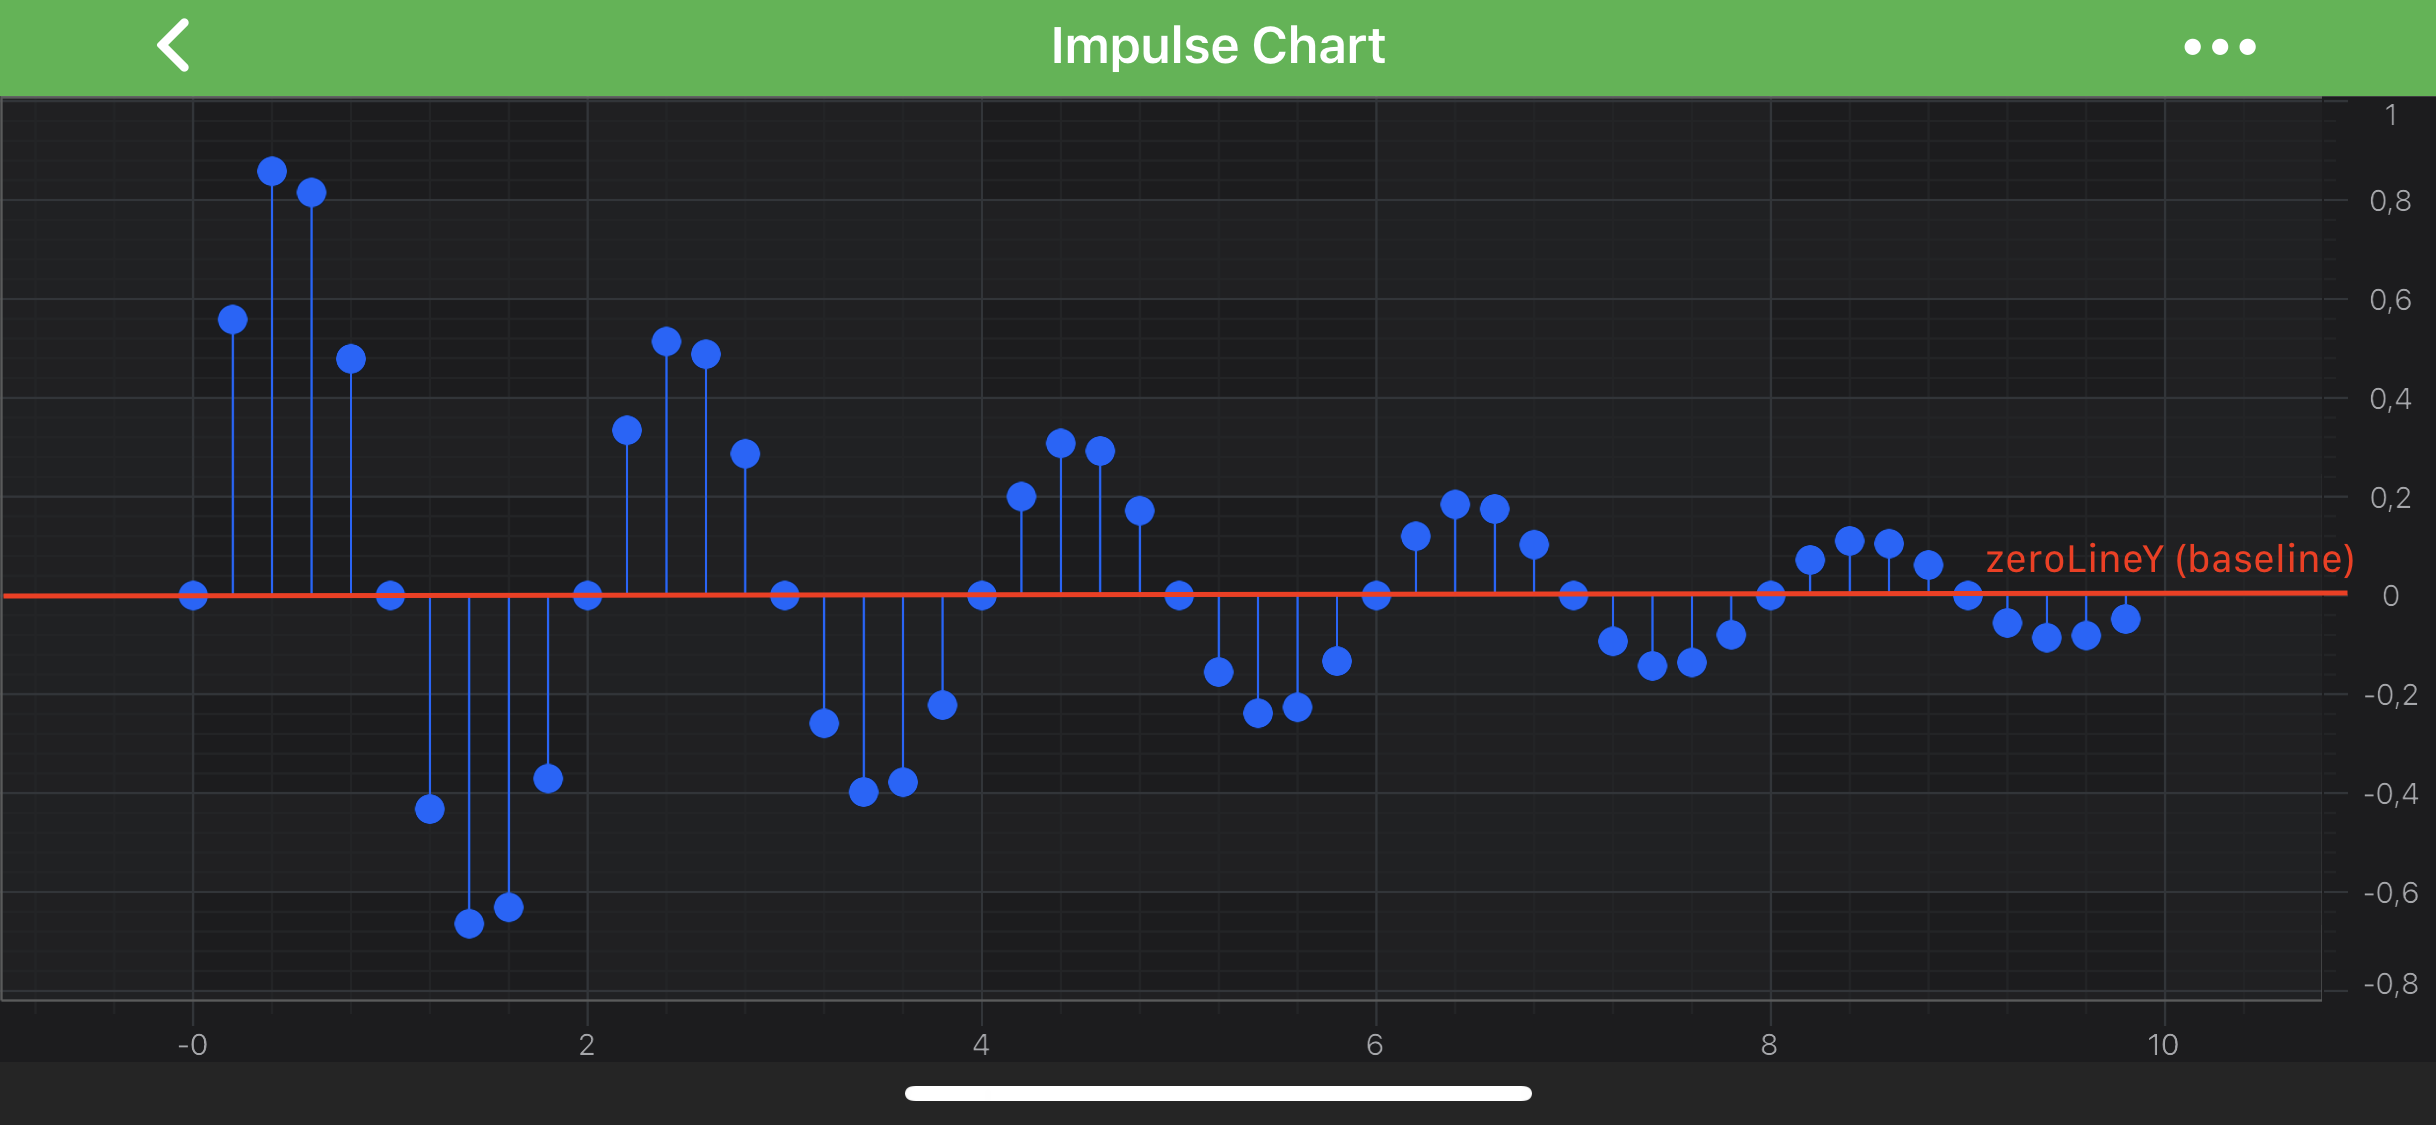
Similarly to the SCIFastColumnRenderableSeries type, it is possible to specify the baseline position for series’ bars via the SCIRenderableSeriesBase.zeroLineY property. All data points that have Y value less than ZeroLineY (baseline) will be drawn downwards, else - upwards:
To create an Impulse Series, use the following code:
// Assume a surface has been created and configured somewhere
id<ISCIChartSurface> surface;
// Create a PointMarker instance
id<ISCIPointMarker> pointMarker = [SCIEllipsePointMarker new];
pointMarker.size = (CGSize){ .width = 15, .height = 15 };
pointMarker.strokeStyle = [[SCISolidPenStyle alloc] initWithColor:UIColor.yellowColor thickness:2.0];
pointMarker.fillStyle = [[SCISolidBrushStyle alloc] initWithColorCode:0xFF0066FF];
// Create DataSeries and fill it with some data
SCIXyDataSeries *dataSeries = [[SCIXyDataSeries alloc] initWithXType:SCIDataType_Double yType:SCIDataType_Double];
// Create and add Scatter Series
id<ISCIRenderableSeries> impulseSeries = [SCIXyScatterRenderableSeries new];
impulseSeries.dataSeries = dataSeries;
impulseSeries.pointMarker = pointMarker;
impulseSeries.strokeStyle = [[SCISolidPenStyle alloc] initWithColor:UIColor.yellowColor thickness:1.0];
impulseSeries.zeroLineY = 0.2;
[surface.renderableSeries add:impulseSeries];
// Assume a surface has been created and configured somewhere
let surface: ISCIChartSurface
// Create a PointMarker instance
let pointMarker = SCIEllipsePointMarker()
pointMarker.size = CGSize(width: 15, height: 15)
pointMarker.strokeStyle = SCISolidPenStyle(color: .yellow, thickness: 2.0)
pointMarker.fillStyle = SCISolidBrushStyle(colorCode: 0xFF0066FF)
// Create DataSeries and fill it with some data
let dataSeries = SCIXyDataSeries(xType: .double, yType: .double)
// Create and add Scatter Series
let impulseSeries = SCIFastImpulseRenderableSeries()
impulseSeries.dataSeries = dataSeries
impulseSeries.pointMarker = pointMarker
impulseSeries.strokeStyle = SCISolidPenStyle(color: .yellow, thickness: 1.0)
impulseSeries.zeroLineY = 0.2
surface.renderableSeries.add(impulseSeries)
// Assume a surface has been created and configured somewhere
IISCIChartSurface surface;
// Create a PointMarker instance
var pointMarker = new SCIEllipsePointMarker();
pointMarker.Size = new CGSize(15, 15);
pointMarker.StrokeStyle = new SCISolidPenStyle(UIColor.Yellow, 2.0f);
pointMarker.FillStyle = new SCISolidBrushStyle(0xFF0066FF);
// Create DataSeries and fill it with some data
var dataSeries = new XyDataSeries();
// Create and add Scatter Series
var impulseSeries = new SCIFastLineRenderableSeries();
impulseSeries.DataSeries = dataSeries;
impulseSeries.PointMarker = pointMarker;
impulseSeries.StrokeStyle = new SCISolidPenStyle(UIColor.Yellow, 1.0f);
impulseSeries.ZeroLineY = 0.2;
surface.RenderableSeries.Add(impulseSeries);
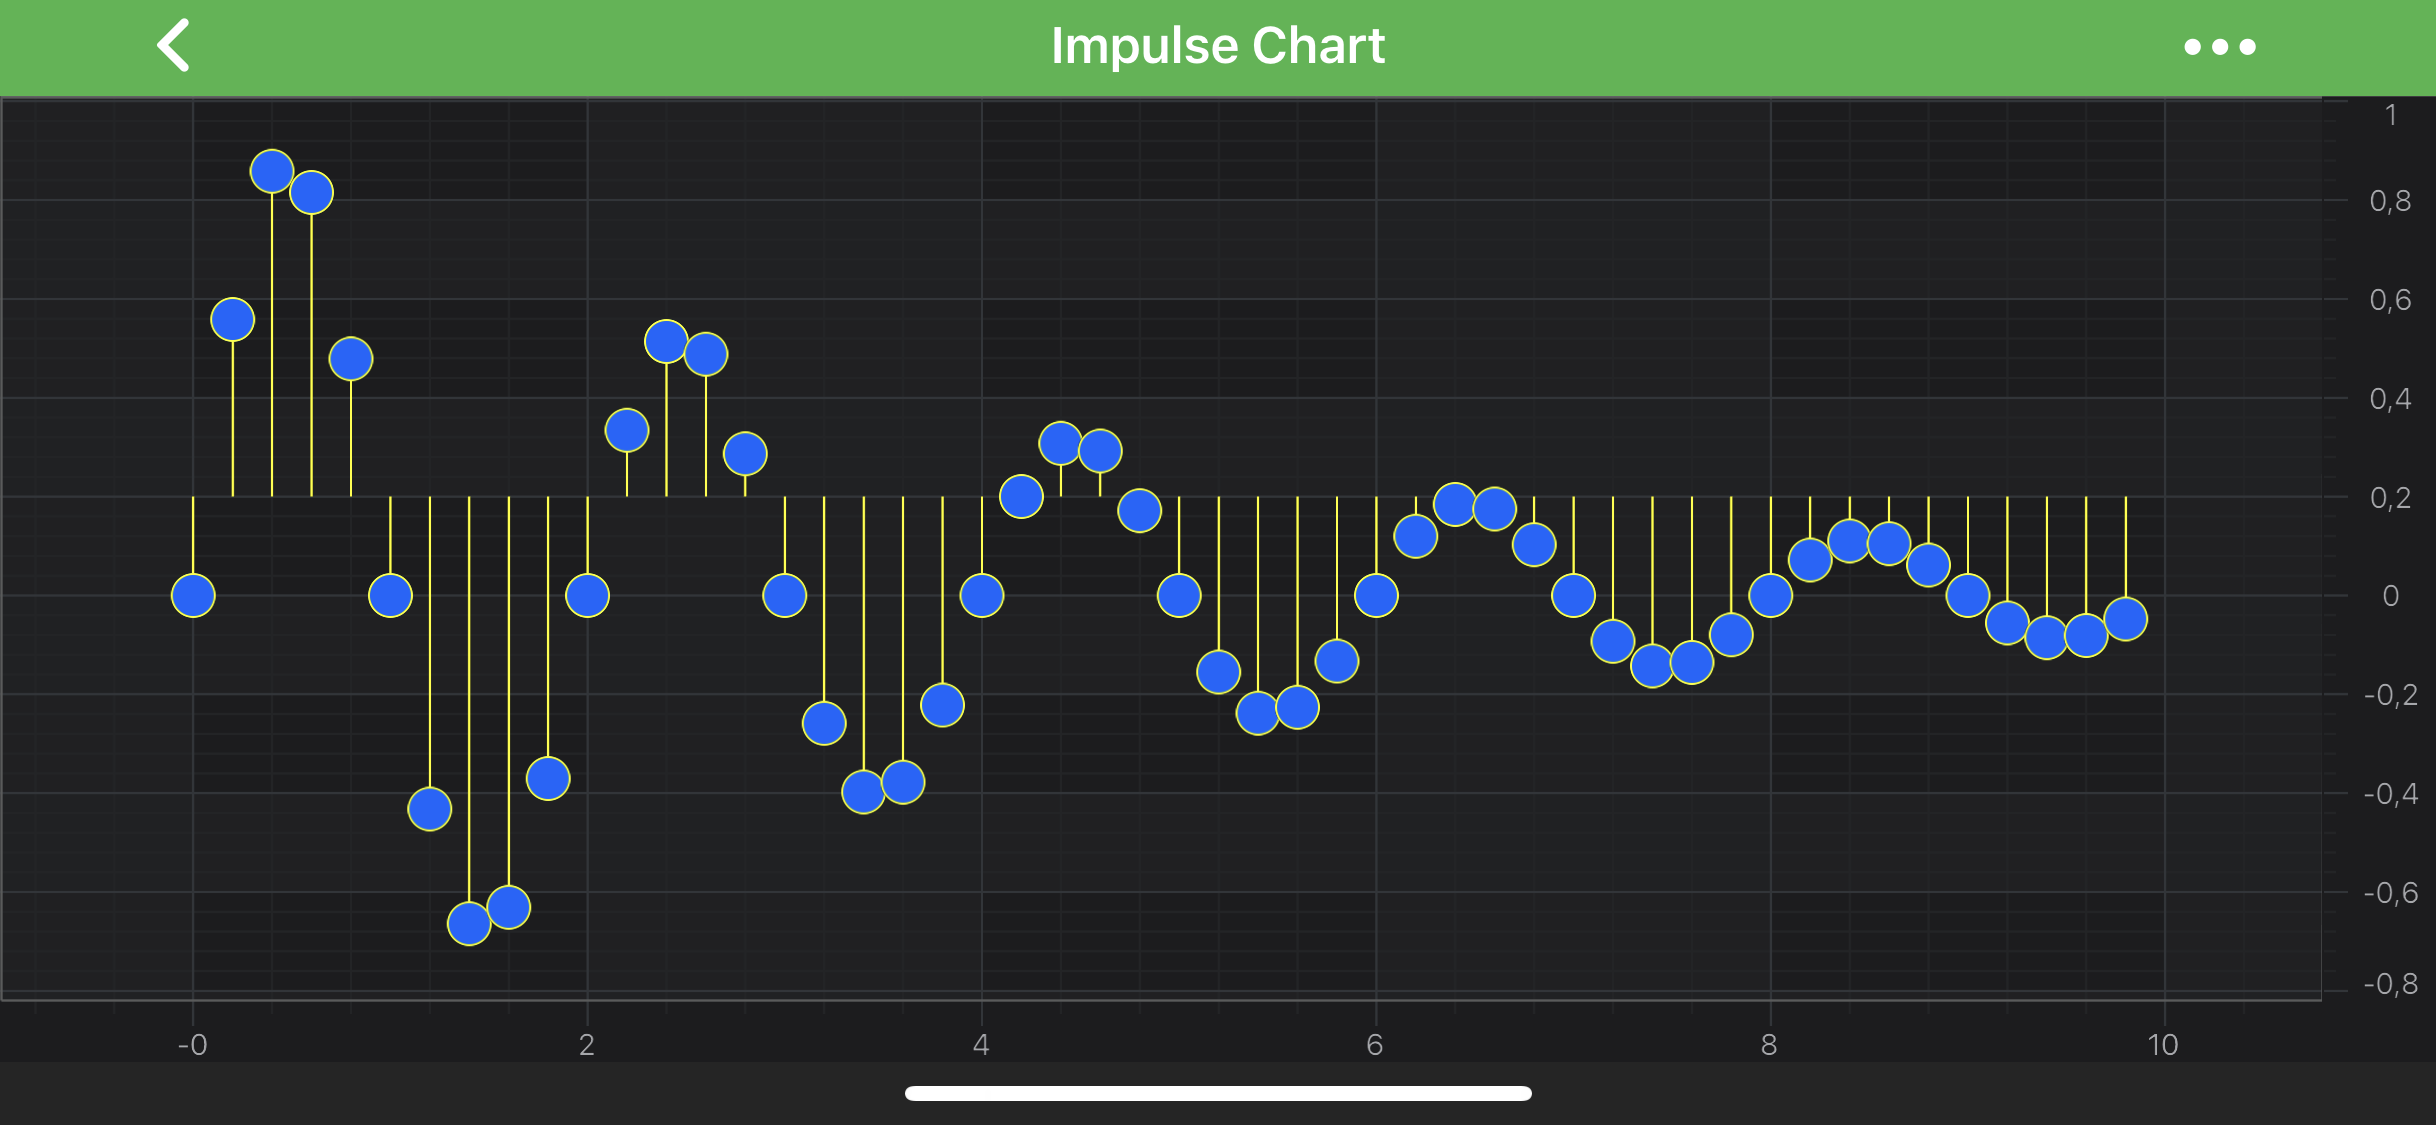
The result should be:
Impulse Series Features
Impulse Series also has some features similar to other series, such as:
It’s possible to render a Gap in an Impulse series, by passing a data point with a NaN as the Y value. Please refer to the RenderableSeries APIs article for more details.
 View on GitHub