 View on GitHub
iOS & macOS Charting Documentation - SciChart iOS & macOS Charts SDK v4.x
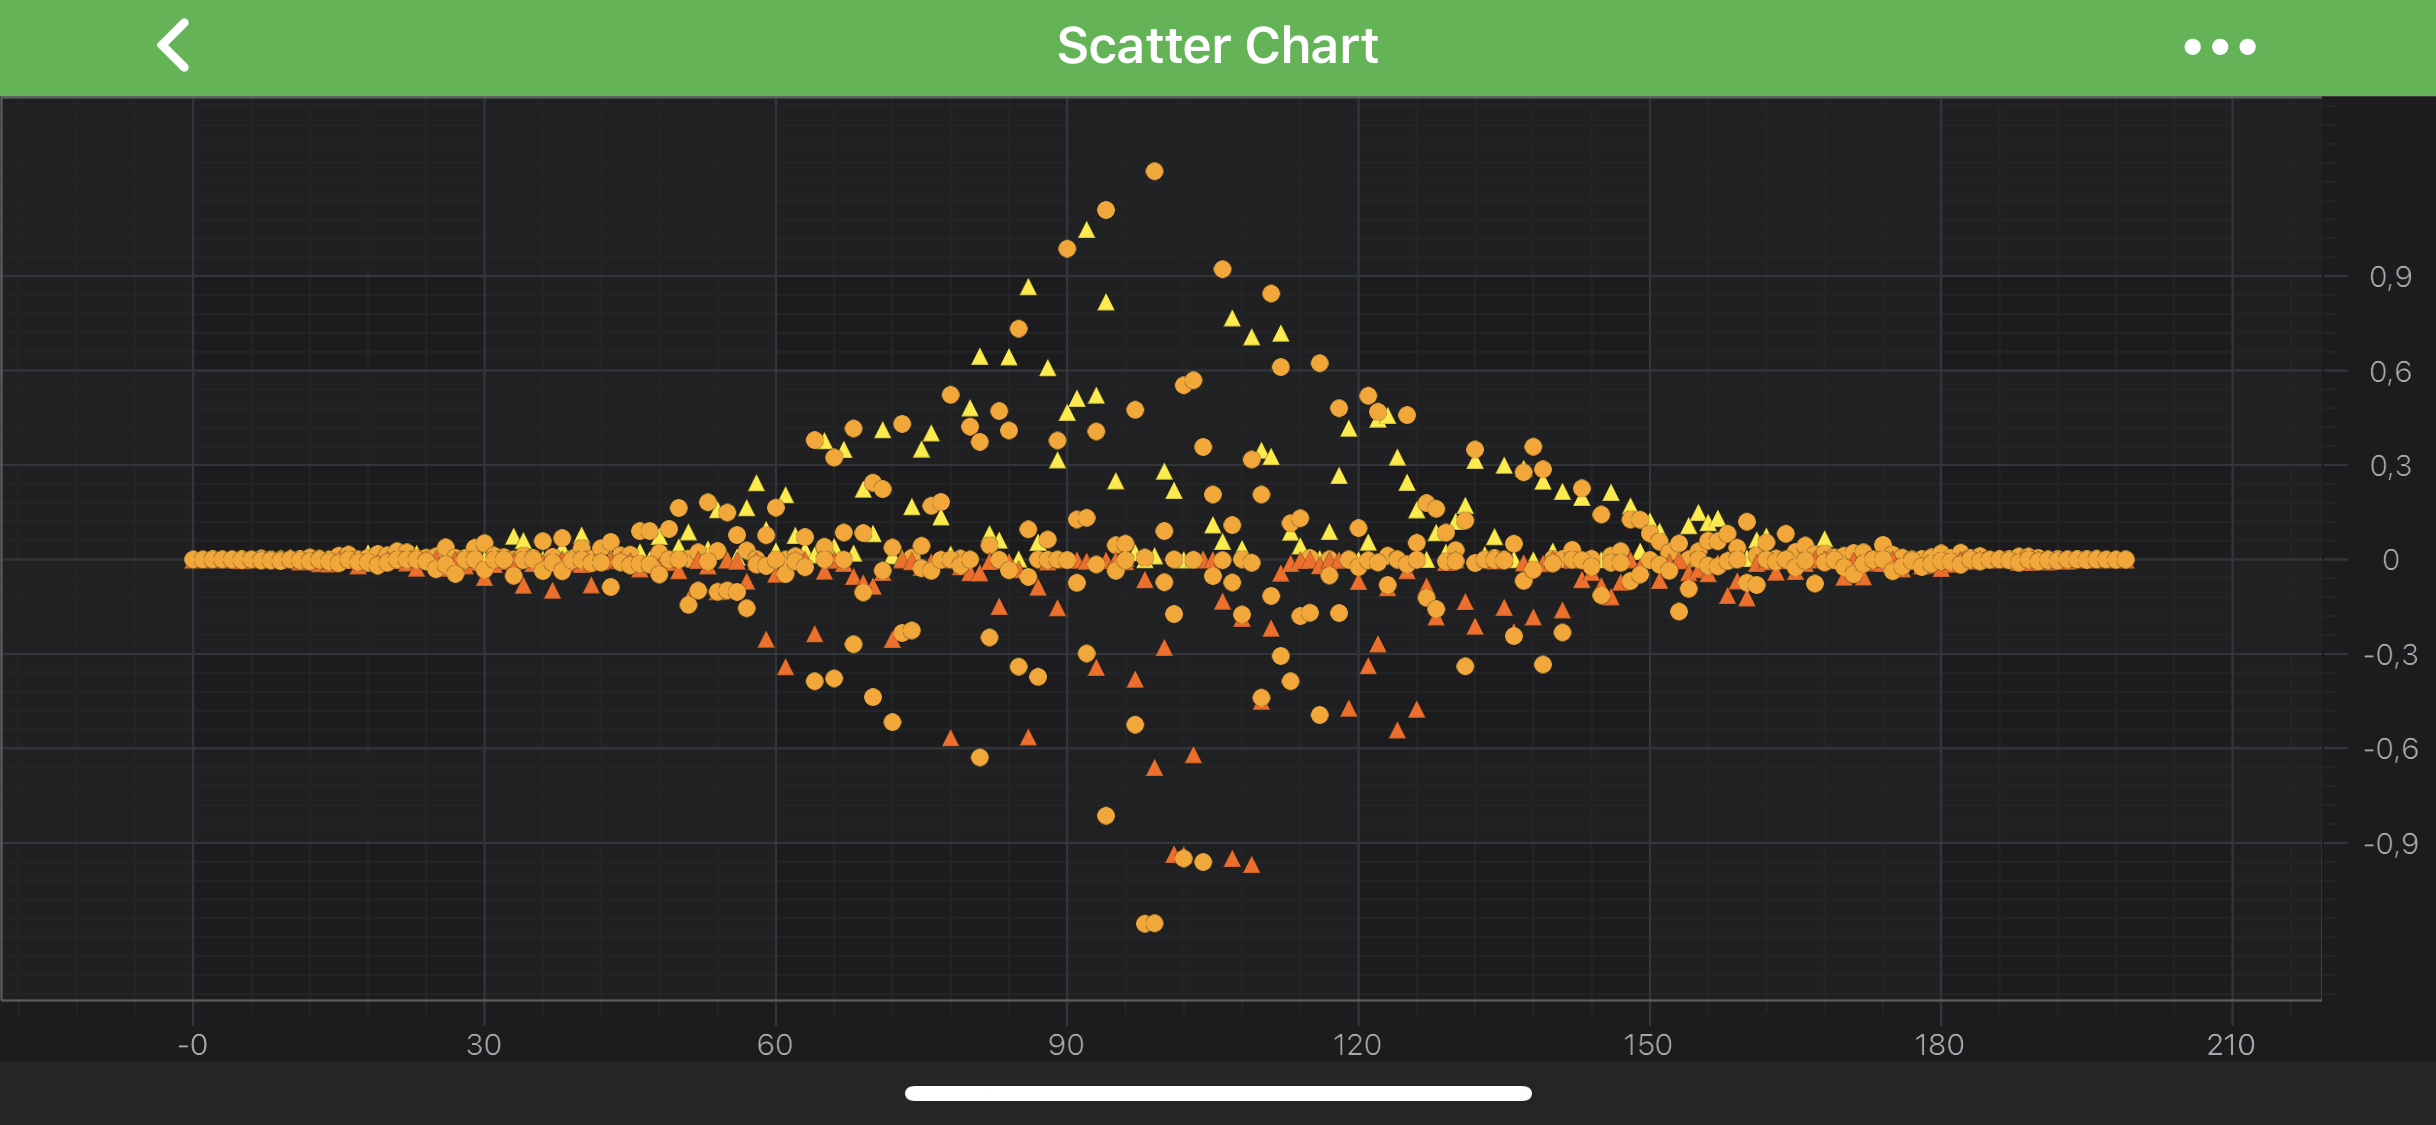
The Scatter Series Type
Scatter Series can be created using the SCIXyScatterRenderableSeries type.
NOTE: Examples for the Scatter Series can be found in the SciChart iOS Examples Suite as well as on GitHub:
The Scatter Series requires a shape to be specified for Point Markers. SciChart provides several shapes out of the box:
SCICrossPointMarker;SCIEllipsePointMarker;SCISquarePointMarker;SCITrianglePointMarker;SCISpritePointMarker.
It is also possible to define custom shapes of the Point Markers. Please refer to the PointMarkers API article to learn more. You can also override colors of the Point Markers individually using The PaletteProvider API.
NOTE: In multi axis scenarios, a series has to be assigned to particular X and Y axes. This can be done passing the axes IDs to the
ISCIRenderableSeries.xAxisId,ISCIRenderableSeries.yAxisIdproperties.
Create a Scatter Series
To create a SCIXyScatterRenderableSeries, use the following code:
In the code above, a Scatter Series instance is created. It is assigned to draw the data that is provided by the ISCIDataSeries assigned to it. The Scatters are drawn with a PointMarker provided by the SCIEllipsePointMarker instance. Finally, the Scatter Series is added to the ISCIChartSurface.renderableSeries property.
Scatter Series Features
Scatter Series also has some features similar to other series, such as:
Render a Gap in a Scatter Series
It’s possible to render a Gap in Scatter series, by passing a data point with a NaN as the Y value. Please refer to the RenderableSeries APIs article for more details.
Paint Scatters With Different Colors
In SciChart, you can draw each scatter of the Scatter Series with different colors using the PaletteProvider API.
To Use palette provider for scatters - a custom ISCIPointMarkerPaletteProvider has to be provided to the ISCIRenderableSeries.paletteProvider property. Please refer to the PaletteProvider API article for more info.