SciChart® the market leader in Fast WPF Charts, WPF 3D Charts, iOS Chart, Android Chart and JavaScript Chart Components
Please note! These examples are new to SciChart Mobile v3 release! SciChart iOS & Android ship with Xamarin.iOS and Xamarin.Android bindings around our native iOS & Android Chart controls, allowing you to create fast & feature rich charts to your Xamarin applications. We include ~90 native iOS examples and 90 Android examples, but now also ~60 Xamarin Chart Examples to help you get started with SciChart. You can download the source for our Xamarin Chart Examples from Github, or browse the source code below.
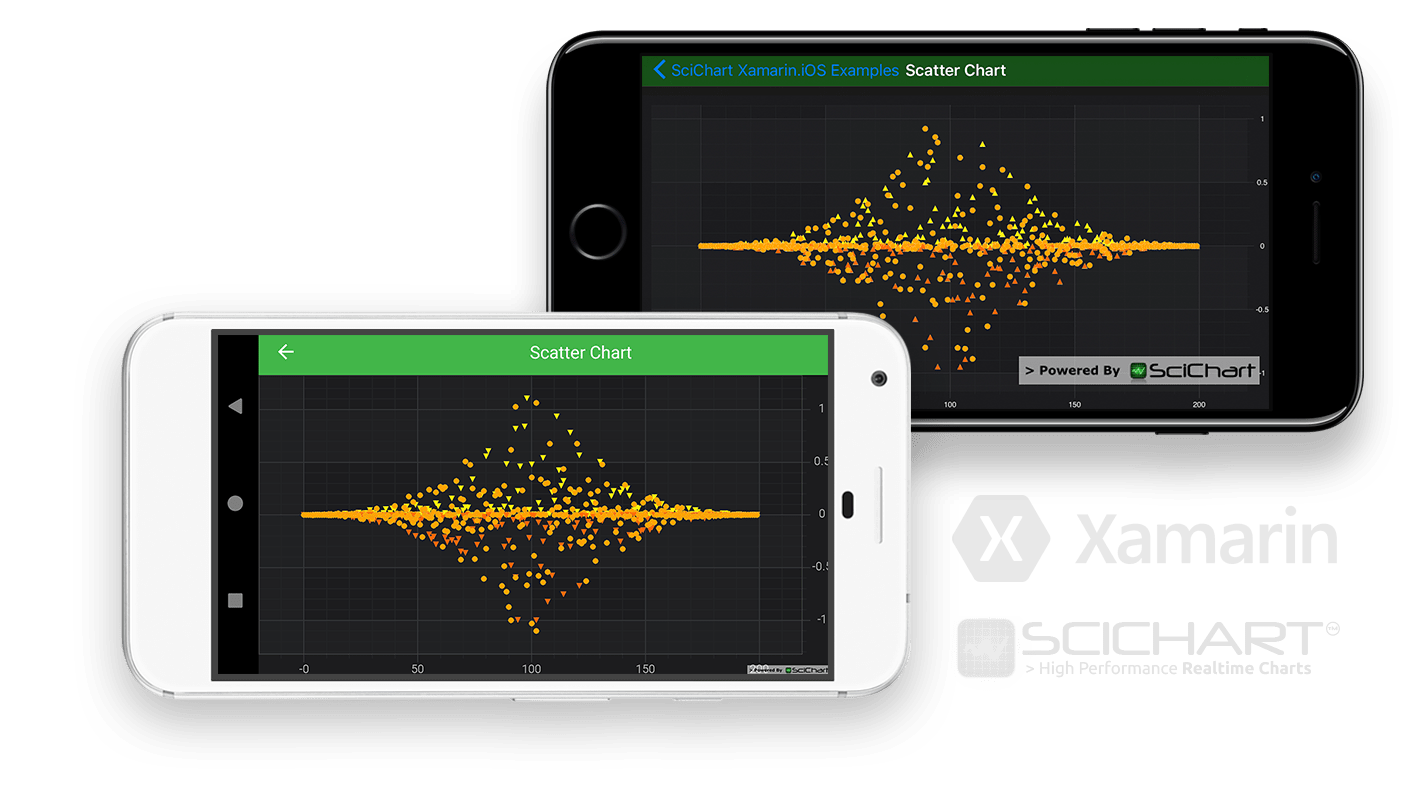
This example demonstrates how to create a Xamarin Scatter chart in code.
SciChart Xamarin Scatter Chart supports tens or hundreds of thousands of points out of the box*, and is suitable for use in real-time scientific, medical and trading applications.
*depending on available memory and device.
See Documentation on how to use this type here:
Tip!
The scatter chart uses the PointMarker API to define the marker shape and size.
The C#/Xamarin.iOS/Xamarin.Android source code for the Xamarin Scatter Chart example is included below (Scroll down!).
Did you know you can also view the source code from one of the following sources as well?
using System;
using Android.Content;
using System.Drawing;
using Android.Views.Animations;
using SciChart.Charting.Model;
using SciChart.Charting.Model.DataSeries;
using SciChart.Charting.Modifiers;
using SciChart.Charting.Visuals;
using SciChart.Charting.Visuals.Animations;
using SciChart.Charting.Visuals.Axes;
using SciChart.Charting.Visuals.PointMarkers;
using SciChart.Charting.Visuals.RenderableSeries;
using SciChart.Data.Model;
using SciChart.Drawing.Common;
using Xamarin.Examples.Demo;
using Xamarin.Examples.Demo.Droid.Extensions;
using Xamarin.Examples.Demo.Droid.Fragments.Base;
using static SciChart.Charting.Modifiers.AxisDragModifierBase;
namespace Xamarin.Examples.Demo.Droid.Fragments.Examples
{
[ExampleDefinition("Scatter Chart", description:"Create a simple Scatter chart", icon: ExampleIcon.ScatterChart)]
public class ScatterChartFragment : ExampleBaseFragment
{
private readonly Random _random = new Random(42);
public SciChartSurface Surface => View.FindViewById<SciChartSurface>(Resource.Id.chart);
public override int ExampleLayoutId => Resource.Layout.Example_Single_Chart_Fragment;
protected override void InitExample()
{
var xAxis = new NumericAxis(Activity) {GrowBy = new DoubleRange(0.1, 0.1)};
var yAxis = new NumericAxis(Activity) {GrowBy = new DoubleRange(0.1, 0.1)};
var rSeries1 = GetScatterRenderableSeries(Activity, new TrianglePointMarker(), 0xFFFFEB01, false);
var rSeries2 = GetScatterRenderableSeries(Activity, new EllipsePointMarker(), 0xFFFFA300, false);
var rSeries3 = GetScatterRenderableSeries(Activity, new TrianglePointMarker(), 0xFFFF6501, true);
var rSeries4 = GetScatterRenderableSeries(Activity, new EllipsePointMarker(), 0xFFFFA300, true);
using (Surface.SuspendUpdates())
{
Surface.XAxes.Add(xAxis);
Surface.YAxes.Add(yAxis);
Surface.RenderableSeries.Add(rSeries1);
Surface.RenderableSeries.Add(rSeries2);
Surface.RenderableSeries.Add(rSeries3);
Surface.RenderableSeries.Add(rSeries4);
Surface.ChartModifiers = new ChartModifierCollection
{
new ZoomExtentsModifier(),
new PinchZoomModifier(),
new CursorModifier(){ ReceiveHandledEvents = true },
new XAxisDragModifier(){ ReceiveHandledEvents = true },
new YAxisDragModifier {DragMode = AxisDragMode.Pan}
};
new WaveAnimatorBuilder(rSeries1) { Interpolator = new DecelerateInterpolator(), Duration = 3000, StartDelay = 350 }.Start();
new WaveAnimatorBuilder(rSeries2) { Interpolator = new DecelerateInterpolator(), Duration = 3000, StartDelay = 350 }.Start();
new WaveAnimatorBuilder(rSeries3) { Interpolator = new DecelerateInterpolator(), Duration = 3000, StartDelay = 350 }.Start();
new WaveAnimatorBuilder(rSeries4) { Interpolator = new DecelerateInterpolator(), Duration = 3000, StartDelay = 350 }.Start();
}
}
private XyScatterRenderableSeries GetScatterRenderableSeries(Context context, IPointMarker pointMarker, uint color, bool negative)
{
var seriesName = pointMarker is EllipsePointMarker ?
negative ? "Negative Ellipse" : "Positive Ellipse" :
negative ? "Negative" : "Positive";
var dataSeries = new XyDataSeries<int, double> {SeriesName = seriesName};
for (var i = 0; i < 200; i++)
{
var time = i < 100 ? GetRandom(_random, 0, i + 10) / 100 : GetRandom(_random, 0, 200 - i + 10) / 100;
var y = negative ? -time * time * time : time * time * time;
dataSeries.Append(i, y);
}
pointMarker.SetSize(6.ToDip(context), 6.ToDip(context));
pointMarker.StrokeStyle = new SolidPenStyle(Color.White, 0.1f.ToDip(context));
pointMarker.FillStyle = new SolidBrushStyle(color);
return new XyScatterRenderableSeries
{
DataSeries = dataSeries,
StrokeStyle = new SolidPenStyle(color, 2f.ToDip(context)),
PointMarker = pointMarker
};
}
private double GetRandom(Random random, double min, double max)
{
return min + (max - min) * random.NextDouble();
}
}
}