Xamarin Chart - Examples
Please note! These examples are new to SciChart Mobile v3 release! SciChart iOS & Android ship with Xamarin.iOS and Xamarin.Android bindings around our native iOS & Android Chart controls, allowing you to create fast & feature rich charts to your Xamarin applications. We include ~90 native iOS examples and 90 Android examples, but now also ~60 Xamarin Chart Examples to help you get started with SciChart. You can download the source for our Xamarin Chart Examples from Github, or browse the source code below.
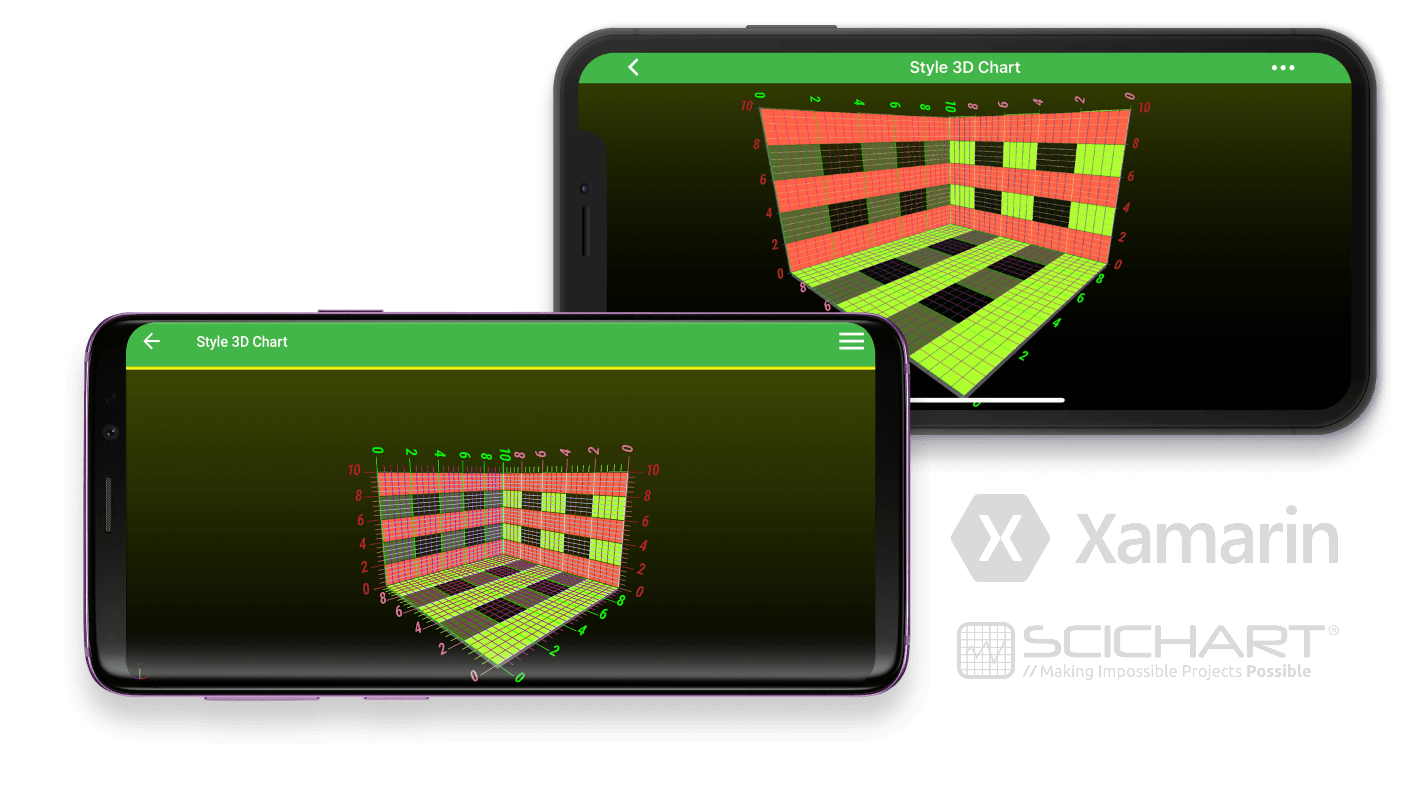
This example shows that every element of SciChart Chart can be styled in your way. Pleease see more in the example source code to learn how to style the chart in Xamarin.iOS and Xamarin.Android. You can change the chart background color, grid lines, axis labels, view port background and chart series colors.

The C#/Xamarin.iOS/Xamarin.Android source code for the Xamarin Style 3D Chart example is included below (Scroll down!).
Did you know you can also view the source code from one of the following sources as well?
- Clone the SciChart.Xamarin.Examples from Github.
- Also, the SciChart for Xamarin Trial contains the full source code for the Xamarin chart examples (link below).
Style3DChartViewController.cs (Xamarin.iOS)
View source codeusing Foundation;
using System.Linq;
using SciChart.iOS.Charting;
namespace Xamarin.Examples.Demo.iOS
{
[Example3DDefinition("Style 3D Chart", description: "Styling of a SciChart3DSurface, Axis, grid lines, tick lines and background", icon: ExampleIcon.Themes)]
class Style3DChartViewController : SingleChartViewController<SCIChartSurface3D>
{
protected override void InitExample()
{
var font = "RobotoCondensed-BoldItalic";
// TODO (@Andriy): Make sure font is working fine
var something = new[] { 1.0, 2.0 };
var numbers = something.Select(x => new NSNumber(x)).ToArray();
using (Surface.SuspendUpdates())
{
Surface.XAxis = new SCINumericAxis3D
{
MinorsPerMajor = 5,
MaxAutoTicks = 7,
TextSize = 13f,
TextColor = 0xFF00FF00,
TextFont = font,
AxisBandsStyle = new SCISolidBrushStyle(0xFF556B2F),
MajorTickLineStyle = new SCISolidPenStyle(0xFF00FF00, 1),
MajorTickLineLength = 8f,
MinorTickLineStyle = new SCISolidPenStyle(0xFFC71585),
MinorTickLineLength = 4f,
MajorGridLineStyle = new SCISolidPenStyle(0xFF00FF00),
MinorGridLineStyle = new SCISolidPenStyle(0xFF9400D3),
};
Surface.YAxis = new SCINumericAxis3D
{
MinorsPerMajor = 5,
MaxAutoTicks = 7,
TextSize = 13f,
TextColor = 0xFFB22222,
TextFont = font,
AxisBandsStyle = new SCISolidBrushStyle(0xFFFF6347),
MajorTickLineStyle = new SCISolidPenStyle(0xFFB22222),
MajorTickLineLength = 8f,
MinorTickLineStyle = new SCISolidPenStyle(0xFFCD5C5C),
MinorTickLineLength = 4f,
MajorGridLineStyle = new SCISolidPenStyle(0xFF006400),
MinorGridLineStyle = new SCISolidPenStyle(0xFF8CBED6)
};
Surface.ZAxis = new SCINumericAxis3D
{
MinorsPerMajor = 5,
MaxAutoTicks = 7,
TextSize = 13f,
TextColor = 0xFFDB7093,
TextFont = font,
AxisBandsStyle = new SCISolidBrushStyle(0xFFADFF2F),
MajorTickLineStyle = new SCISolidPenStyle(0xFFDB7093),
MajorTickLineLength = 8f,
MinorTickLineStyle = new SCISolidPenStyle(0xFF7FFF00),
MinorTickLineLength = 4f,
MajorGridLineStyle = new SCISolidPenStyle(0xFFF5F5DC),
MinorGridLineStyle = new SCISolidPenStyle(0xFFA52A2A)
};
Surface.ChartModifiers.Add(CreateDefault3DModifiers());
Surface.Camera = new SCICamera3D();
}
}
}
}Style3DChartFragment.cs (Xamarin.Android)
View source codeusing System.Drawing;
using SciChart.Charting3D.Common.Utils;
using SciChart.Charting3D.Model;
using SciChart.Charting3D.Modifiers;
using SciChart.Charting3D.Visuals;
using SciChart.Charting3D.Visuals.Axes;
using SciChart.Charting3D.Visuals.Camera;
using SciChart.Drawing.Common;
using Xamarin.Examples.Demo;
using Xamarin.Examples.Demo.Droid.Extensions;
using Xamarin.Examples.Demo.Droid.Fragments.Base;
namespace Xamarin.Examples.Demo.Droid.Fragments.Examples3D
{
[Example3DDefinition("Style 3D Chart", description: "Styling of a SciChart3DSurface, Axis, grid lines, tick lines and background", icon: ExampleIcon.Themes)]
class Style3DChartFragment : ExampleBaseFragment
{
public SciChartSurface3D Surface => View.FindViewById<SciChartSurface3D>(Resource.Id.chart3d);
public override int ExampleLayoutId => Resource.Layout.Example_Single_3D_Chart_Fragment;
protected override void InitExample()
{
var font = "RobotoCondensed-BoldItalic";
FontUtil3D.RegisterFont($"/system/fonts/{font}.ttf");
using (Surface.SuspendUpdates())
{
Surface.XAxis = new NumericAxis3D()
{
MinorsPerMajor = 5,
MaxAutoTicks = 7,
TextSize = 13f.ToSp(Activity),
TextColor = Color.Lime.ToArgb(),
TextFont = font,
AxisBandsStyle = new SolidBrushStyle(Color.DarkOliveGreen),
MajorTickLineStyle = new SolidPenStyle(Activity, Color.Lime),
MajorTickLineLength = 8f,
MinorTickLineStyle = new SolidPenStyle(Activity, Color.MediumVioletRed),
MinorTickLineLength = 4f,
MajorGridLineStyle = new SolidPenStyle(Activity, Color.Lime),
MinorGridLineStyle = new SolidPenStyle(Activity, Color.DarkViolet)
};
Surface.YAxis = new NumericAxis3D()
{
MinorsPerMajor = 5,
MaxAutoTicks = 7,
TextSize = 13f.ToSp(Activity),
TextColor = Color.Firebrick.ToArgb(),
TextFont = font,
AxisBandsStyle = new SolidBrushStyle(Color.Tomato),
MajorTickLineStyle = new SolidPenStyle(Activity, Color.Firebrick),
MajorTickLineLength = 8f,
MinorTickLineStyle = new SolidPenStyle(Activity, Color.IndianRed),
MinorTickLineLength = 4f,
MajorGridLineStyle = new SolidPenStyle(Activity, Color.DarkGreen),
MinorGridLineStyle = new SolidPenStyle(Activity, Color.DarkBlue)
};
Surface.ZAxis = new NumericAxis3D()
{
MinorsPerMajor = 5,
MaxAutoTicks = 7,
TextSize = 13f.ToSp(Activity),
TextColor = Color.PaleVioletRed.ToArgb(),
TextFont = font,
AxisBandsStyle = new SolidBrushStyle(Color.GreenYellow),
MajorTickLineStyle = new SolidPenStyle(Activity, Color.PaleVioletRed),
MajorTickLineLength = 8f,
MinorTickLineStyle = new SolidPenStyle(Activity, Color.Chartreuse),
MinorTickLineLength = 4f,
MajorGridLineStyle = new SolidPenStyle(Activity, Color.Beige),
MinorGridLineStyle = new SolidPenStyle(Activity, Color.Brown)
};
Surface.Camera = new Camera3D();
Surface.ChartModifiers = new ChartModifier3DCollection
{
new PinchZoomModifier3D(),
new OrbitModifier3D(),
new ZoomExtentsModifier3D()
};
}
}
}
}