Xamarin Chart - Examples
Please note! These examples are new to SciChart Mobile v3 release! SciChart iOS & Android ship with Xamarin.iOS and Xamarin.Android bindings around our native iOS & Android Chart controls, allowing you to create fast & feature rich charts to your Xamarin applications. We include ~90 native iOS examples and 90 Android examples, but now also ~60 Xamarin Chart Examples to help you get started with SciChart. You can download the source for our Xamarin Chart Examples from Github, or browse the source code below.
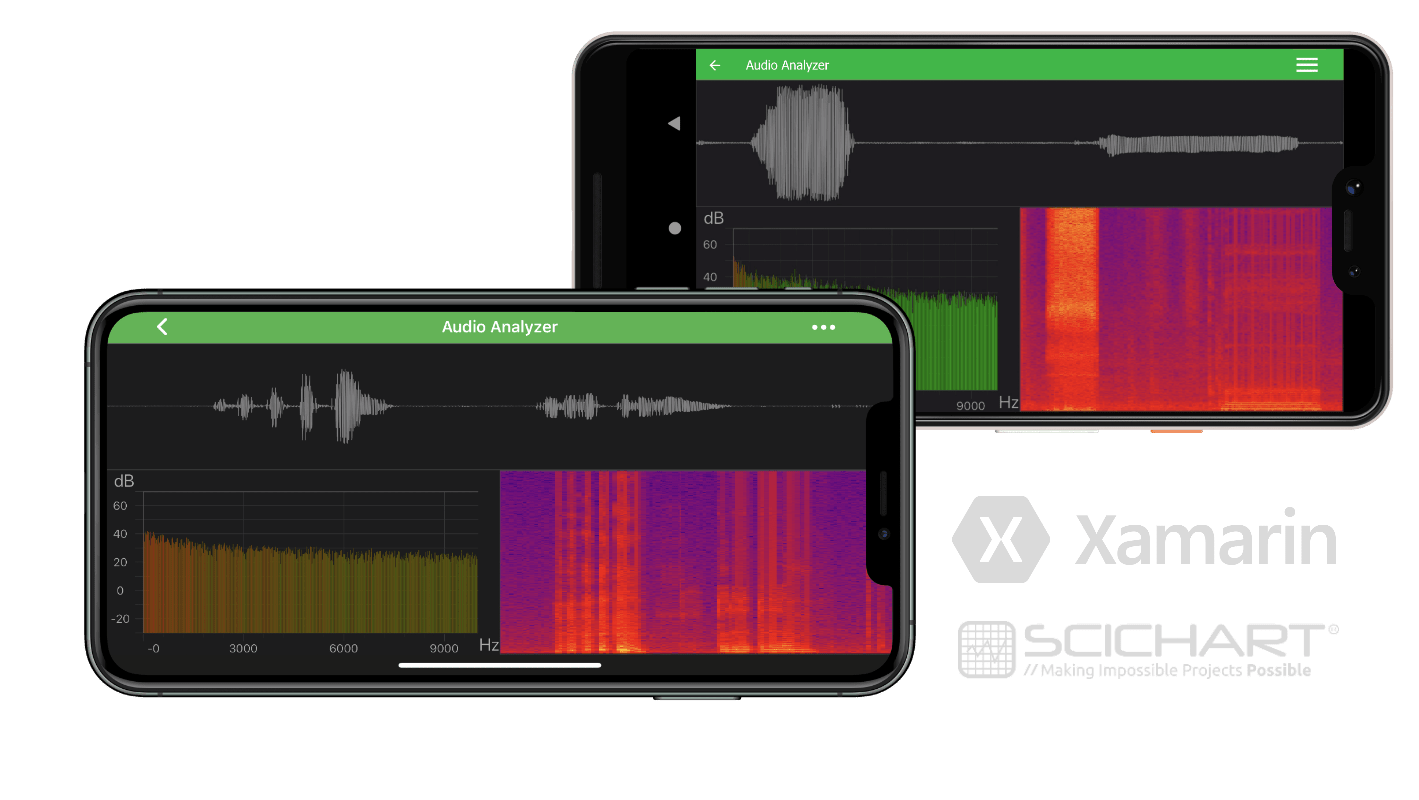
The Audio analyzer demo showcases how SciChart can be used across platforms in a scientific context with Xamarin.iOS and Xamarin.Android.
You are welcomed to download the examples and enable your microphone to see this demo at work.
In this example we listen to the microphone on your iPad/iPhone or Android device and create a waveform of the sound recorded in the top chart, that has 500,000 data-points drawn in real-time. In the example application you can also see a Fourier Transform, showing a spectral / frequency analysis of the audio waveform in the lower left chart. The bottom right chart has a spectrogram or a histogram of the fourier transform, that is created with the heatmap SciChart control.
If you are creating an app that needs to work on both iOS and Android devices and visualize radio frequency, spectral analysis or scientific data from data-acquisition devices, choose SciChart to shortcut your development time & get to market faster with our well-tested, reliable Xamarin.iOS and Xamarin.Android Chart library.
See also:
The native examples in Swift/objective C for iOS and Java for Android.

The C#/Xamarin.iOS/Xamarin.Android source code for the Xamarin Audio, Radio frequency and Spectrum Analyzer Example example is included below (Scroll down!).
Did you know you can also view the source code from one of the following sources as well?
- Clone the SciChart.Xamarin.Examples from Github.
- Also, the SciChart for Xamarin Trial contains the full source code for the Xamarin chart examples (link below).
Example_Audio_Analyzer_Fragment.xml(Xamarin.Android)
View source code
<android.support.constraint.ConstraintLayout android:layout_width="match_parent"
    android:layout_height="match_parent"
    xmlns:android="http://schemas.android.com/apk/res/android"
    xmlns:app="http://schemas.android.com/apk/res-auto"
    xmlns:tools="http://schemas.android.com/tools">

    <com.scichart.charting.visuals.SciChartSurface
        android:id="@+id/audioStreamChart"
        android:layout_width="0dp"
        android:layout_height="0dp"
        android:layout_marginBottom="8dp"
        android:layout_weight="2"
        app:layout_constraintBottom_toTopOf="@+id/horizontalGuideline"
        app:layout_constraintHorizontal_bias="0.66"
        app:layout_constraintStart_toStartOf="parent"
        app:layout_constraintEnd_toEndOf="parent"
        app:layout_constraintTop_toTopOf="parent" />

    <com.scichart.charting.visuals.SciChartSurface
        android:layout_width="0dp"
        android:layout_height="0dp"
        android:layout_marginEnd="4dp"
        android:id="@+id/fftChart"
        app:layout_constraintBottom_toBottomOf="parent"
        app:layout_constraintStart_toStartOf="parent"
        app:layout_constraintEnd_toStartOf="@+id/verticalGuideline"
        app:layout_constraintTop_toTopOf="@+id/horizontalGuideline" />

    <com.scichart.charting.visuals.SciChartSurface
        android:layout_width="0dp"
        android:layout_height="0dp"
        android:layout_marginStart="4dp"
        android:id="@+id/spectrogramChart"
        app:layout_constraintBottom_toBottomOf="parent"
        app:layout_constraintStart_toEndOf="@+id/verticalGuideline"
        app:layout_constraintEnd_toEndOf="parent"
        app:layout_constraintTop_toTopOf="@+id/horizontalGuideline" />

    <android.support.constraint.Guideline
        android:id="@+id/horizontalGuideline"
        android:layout_width="384dp"
        android:layout_height="0dp"
        android:orientation="horizontal"
        app:layout_constraintGuide_percent="0.40388006"
        tools:layout_editor_absoluteX="0dp"
        tools:layout_editor_absoluteY="229dp" />

    <android.support.constraint.Guideline
        android:id="@+id/verticalGuideline"
        android:layout_width="wrap_content"
        android:layout_height="wrap_content"
        android:orientation="vertical"
        app:layout_constraintGuide_percent="0.5026042"
        tools:layout_editor_absoluteX="193dp"
        tools:layout_editor_absoluteY="0dp" />

</android.support.constraint.ConstraintLayout>
AudioAnalyzerShowcaseFragment.cs(Xamarin.Android)
View source codeusing System;
using System.Drawing;
using System.Reactive.Linq;
using Android;
using Java.Lang;
using SciChart.Charting.Model.DataSeries;
using SciChart.Charting.Numerics.CoordinateCalculators;
using SciChart.Charting.Visuals;
using SciChart.Charting.Visuals.Axes;
using SciChart.Charting.Visuals.RenderableSeries;
using SciChart.Data.Model;
using SciChart.Drawing.Common;
using Xamarin.Examples.Demo.Droid.Extensions;
using Xamarin.Examples.Demo.Droid.Fragments.Base;
using Xamarin.Examples.Demo.Showcase.AudioAnalyzer;
namespace Xamarin.Examples.Demo.Droid.Fragments.Featured.AudioAnalyzer
{
[FeaturedExampleDefinition("Audio Analyzer", "Showcases a real-time audio recorder", ExampleIcon.FeatureChart)]
[PermissionsDefinition(Manifest.Permission.RecordAudio, Manifest.Permission.ModifyAudioSettings)]
public class AudioAnalyzerShowcaseFragment : ExampleBaseFragment
{
public override int ExampleLayoutId => Resource.Layout.Example_Audio_Analyzer_Fragment;
public SciChartSurface AudioStreamChart => View.FindViewById<SciChartSurface>(Resource.Id.audioStreamChart);
public SciChartSurface FftChart => View.FindViewById<SciChartSurface>(Resource.Id.fftChart);
public SciChartSurface SpectrogramChart => View.FindViewById<SciChartSurface>(Resource.Id.spectrogramChart);
private const int AudioStreamBufferSize = 500_000;
private IDisposable _dataSubscription;
private readonly IAudioAnalyzerDataProvider _provider;
private readonly double _hzPerDataPoint;
private readonly int _fftSize;
private readonly int _fftOffsetValuesCount;
private readonly double[] _fftCache;
private readonly double[] _spectrogramCache;
private readonly XyDataSeries<long, short> _audioDataSeries;
private readonly XyDataSeries<double, double> _fftDataSeries;
private readonly UniformHeatmapDataSeries<long, long, double> _spectrogramDataSeries;
public AudioAnalyzerShowcaseFragment()
{
var defaultProvider = new DefaultAudioAnalyzerDataProvider();
_provider = defaultProvider.IsInitialized ? defaultProvider : (IAudioAnalyzerDataProvider) new StubAudioAnalyzerDataProvider();
_hzPerDataPoint = (double)_provider.SampleRate / _provider.BufferSize;
_fftSize = _provider.BufferSize / 2;
var fftCount = AudioStreamBufferSize / _provider.BufferSize;
var fftValuesCount = _fftSize * fftCount;
_fftOffsetValuesCount = fftValuesCount - _fftSize;
_fftCache = new double[_fftSize];
_spectrogramCache = new double[fftValuesCount];
_audioDataSeries = new XyDataSeries<long, short>() { FifoCapacity = new Integer(AudioStreamBufferSize)};
_fftDataSeries = new XyDataSeries<double, double>() { FifoCapacity = new Integer(_fftSize)};
_spectrogramDataSeries = new UniformHeatmapDataSeries<long, long, double>(_fftSize, fftCount);
}
protected override void InitExample()
{
InitAudioStreamChart();
InitFftChart();
InitSpectrogramChart();
var fft = new Radix2FFT(_provider.BufferSize);
_dataSubscription = _provider.Data.Do(data =>
{
_audioDataSeries.Append(data.XData, data.YData);
fft.Run(data.YData, _fftCache);
_fftDataSeries.UpdateRangeYAt(0, _fftCache);
Array.Copy(_spectrogramCache, _fftSize, _spectrogramCache, 0, _fftOffsetValuesCount);
Array.Copy(_fftCache, 0, _spectrogramCache, _fftOffsetValuesCount, _fftSize);
_spectrogramDataSeries.UpdateZValues(_spectrogramCache);
}).Subscribe();
}
public override void OnDestroyView()
{
_dataSubscription.Dispose();
_dataSubscription = null;
base.OnDestroyView();
}
private void InitAudioStreamChart()
{
var xAxis = new NumericAxis(Activity)
{
AutoRange = AutoRange.Always,
DrawLabels = false,
DrawMinorTicks = false,
DrawMajorTicks = false,
DrawMajorBands = false,
DrawMinorGridLines = false,
DrawMajorGridLines = false
};
var yAxis = new NumericAxis(Activity)
{
VisibleRange = new DoubleRange(Short.MinValue, Short.MaxValue),
DrawLabels = false,
DrawMinorTicks = false,
DrawMajorTicks = false,
DrawMajorBands = false,
DrawMinorGridLines = false,
DrawMajorGridLines = false
};
var rs = new FastLineRenderableSeries()
{
DataSeries = _audioDataSeries,
StrokeStyle = new SolidPenStyle(Color.Gray, 1f.ToDip(Activity))
};
using (AudioStreamChart.SuspendUpdates())
{
AudioStreamChart.XAxes.Add(xAxis);
AudioStreamChart.YAxes.Add(yAxis);
AudioStreamChart.RenderableSeries.Add(rs);
}
}
private void InitFftChart()
{
var xAxis = new NumericAxis(Activity)
{
DrawMajorBands = false,
MaxAutoTicks = 5,
AxisTitle = "Hz",
AxisTitlePlacement = AxisTitlePlacement.Right,
AxisTitleOrientation = AxisTitleOrientation.Horizontal,
};
var yAxis = new NumericAxis(Activity)
{
AxisAlignment = AxisAlignment.Left,
VisibleRange = new DoubleRange(-30, 70),
GrowBy = new DoubleRange(0.1, 0.1),
DrawMinorTicks = false,
DrawMinorGridLines = false,
DrawMajorBands = false,
AxisTitle = "dB",
AxisTitlePlacement = AxisTitlePlacement.Top,
AxisTitleOrientation = AxisTitleOrientation.Horizontal
};
var rs = new FastColumnRenderableSeries()
{
DataSeries = _fftDataSeries,
PaletteProvider = new FFTPaletteProvider(),
ZeroLineY = -30 // set zero line equal to VisibleRange.Min
};
for (int i = 0; i < _fftSize; i++)
{
_fftDataSeries.Append(i * _hzPerDataPoint, 0d);
}
using (FftChart.SuspendUpdates())
{
FftChart.XAxes.Add(xAxis);
FftChart.YAxes.Add(yAxis);
FftChart.RenderableSeries.Add(rs);
}
}
private void InitSpectrogramChart()
{
var xAxis = new NumericAxis(Activity)
{
AutoRange = AutoRange.Always,
DrawLabels = false,
DrawMinorTicks = false,
DrawMajorTicks = false,
DrawMajorBands = false,
DrawMinorGridLines = false,
DrawMajorGridLines = false,
AxisAlignment = AxisAlignment.Left,
FlipCoordinates = true
};
var yAxis = new NumericAxis(Activity)
{
AutoRange = AutoRange.Always,
DrawLabels = false,
DrawMinorTicks = false,
DrawMajorTicks = false,
DrawMajorBands = false,
DrawMinorGridLines = false,
DrawMajorGridLines = false,
AxisAlignment = AxisAlignment.Bottom,
FlipCoordinates = true
};
var rs = new FastUniformHeatmapRenderableSeries()
{
DataSeries = _spectrogramDataSeries,
Minimum = -30,
Maximum = 70,
ColorMap = new ColorMap(
new[] { Color.Transparent, Color.DarkBlue, Color.Purple, Color.Red, Color.Yellow, Color.White },
new[] { 0f, 0.0001f, 0.25f, 0.50f, 0.75f, 1f }),
};
using (SpectrogramChart.SuspendUpdates())
{
SpectrogramChart.XAxes.Add(xAxis);
SpectrogramChart.YAxes.Add(yAxis);
SpectrogramChart.RenderableSeries.Add(rs);
}
}
}
}DefaultAudioAnalyzerDataProvider.cs(Xamarin.Android)
View source codeusing System;
using System.Reactive.Linq;
using Android.Media;
using Xamarin.Examples.Demo.Showcase.AudioAnalyzer;
namespace Xamarin.Examples.Demo.Droid.Fragments.Featured.AudioAnalyzer
{
public class DefaultAudioAnalyzerDataProvider : IAudioAnalyzerDataProvider
{
private readonly AudioData _audioData;
private readonly AudioRecord _audioRecord;
private long _time = 0;
public DefaultAudioAnalyzerDataProvider(int sampleRate = 44100, int bufferSize = 2048)
{
SampleRate = sampleRate;
BufferSize = bufferSize;
_audioData = new AudioData(BufferSize);
_audioRecord = new AudioRecord(AudioSource.Mic, SampleRate, ChannelIn.Mono, Encoding.Pcm16bit, BufferSize);
}
public bool IsInitialized => _audioRecord.State == State.Initialized;
public IObservable<AudioData> Data
{
get
{
_audioRecord.StartRecording();
return Observable.Interval(TimeSpan
.FromMilliseconds((double)SampleRate / BufferSize))
.Select(interval => OnNext())
.Finally(() => _audioRecord.Stop());
}
}
private AudioData OnNext()
{
_audioRecord.Read(_audioData.YData, 0, BufferSize);
var timeValues = _audioData.XData;
for (int i = 0; i < BufferSize; i++)
{
timeValues[i] = _time++;
}
return _audioData;
}
public int BufferSize { get; }
public int SampleRate { get; }
}
}FFTPaletteProvider.cs(Xamarin.Android)
View source codeusing System.Drawing;
using SciChart.Charting.Visuals.RenderableSeries;
using SciChart.Charting.Visuals.RenderableSeries.Data;
using SciChart.Charting.Visuals.RenderableSeries.PaletteProviders;
using SciChart.Core.Model;
using SciChart.Core.Utility;
namespace Xamarin.Examples.Demo.Droid.Fragments.Featured.AudioAnalyzer
{
public class FFTPaletteProvider : PaletteProviderBase<FastColumnRenderableSeries>, IFillPaletteProvider, IStrokePaletteProvider {
private readonly IntegerValues _colors = new IntegerValues();
public IntegerValues FillColors => _colors;
public IntegerValues StrokeColors => _colors;
private readonly byte _minRed, _minGreen, _minBlue;
private readonly byte _diffRed, _diffGreen, _diffBlue;
public FFTPaletteProvider() : this(Color.Green, Color.Red)
{
}
public FFTPaletteProvider(Color minColor, Color maxColor)
{
_minRed = minColor.R;
_minGreen = minColor.G;
_minBlue = minColor.B;
_diffRed = (byte) (maxColor.R - minColor.R);
_diffGreen = (byte)(maxColor.G - minColor.G);
_diffBlue = (byte)(maxColor.B - minColor.B);
}
public override void Update()
{
var xyRenderPassData = (XyRenderPassData)RenderableSeries.CurrentRenderPassData;
var yCalc = xyRenderPassData.YCoordinateCalculator;
var min = yCalc.MinAsDouble;
var max = yCalc.MaxAsDouble;
var diff = max - min;
var yValues = xyRenderPassData.YValues;
var size = xyRenderPassData.PointsCount();
_colors.Clear();
for (int i = 0; i < size; i++)
{
var yValue = yValues.Get(i);
var fraction = (yValue - min) / diff;
var red = Lerp(_minRed, _diffRed, fraction);
var green = Lerp(_minGreen, _diffGreen, fraction);
var blue = Lerp(_minBlue, _diffBlue, fraction);
var color = Color.FromArgb(red, green, blue).ToArgb();
_colors.Add(color);
}
}
private static byte Lerp(byte minColor, byte diffColor, double fraction)
{
var interpolatedValue = minColor + fraction * diffColor;
return (byte)NumberUtil.Constrain(interpolatedValue, 0, 255);
}
}
}AudioData.cs(Xamarin.iOS)
View source codenamespace Xamarin.Examples.Demo.Showcase.AudioAnalyzer
{
public class AudioData
{
public int Count { get; }
public long[] XData { get; }
public short[] YData { get; }
public AudioData(int count)
{
Count = count;
XData = new long[count];
YData = new short[count];
}
}
}IAudioAnalyzerDataProvider.cs(Xamarin.iOS)
View source codenamespace Xamarin.Examples.Demo.Showcase.AudioAnalyzer
{
public interface IAudioAnalyzerDataProvider : IDataProvider<AudioData>
{
int BufferSize { get; }
int SampleRate { get; }
}
}Radix2FFT.cs(Xamarin.iOS)
View source codeusing System;
namespace Xamarin.Examples.Demo.Showcase.AudioAnalyzer
{
/**
* FFT implementation based on code from
* http://stackoverflow.com/documentation/algorithm/8683/fast-fourier-transform/27088/radix-2-fft
*/
public class Radix2FFT
{
private readonly int _n;
private readonly int _m;
private readonly int _mm1;
public readonly int FftSize;
private readonly Complex[] _x;
private readonly Complex[] _dft;
private readonly double _twoPiN;
private readonly Complex _wn = new Complex();
private readonly Complex _temp = new Complex();
public Radix2FFT(int n)
{
this._n = n;
this._m = (int)Math.Log(n, 2d);
if (Math.Pow(2, _m) != n)
throw new InvalidOperationException("n should be with power of 2");
this.FftSize = n / 2;
this._twoPiN = Math.PI * 2 / n; // constant to save computational time. = 2*PI / N
this._mm1 = _m - 1;
this._x = new Complex[n];
this._dft = new Complex[n];
for (int i = 0; i < n; i++)
{
_x[i] = new Complex();
_dft[i] = new Complex();
}
}
public void Run(double[] re, double[] im)
{
// init input values
for (int i = 0; i < _n; i++)
{
var complex = _x[i];
complex.Re = re[i];
complex.Im = im[i];
}
// perform fft
Rad2FFT(_x, _dft);
for (int i = 0; i < _n; i++)
{
var complex = _dft[i];
re[i] = complex.Re;
im[i] = complex.Im;
}
}
public void Run(short[] input, double[] output)
{
if (input.Length != _n) throw new InvalidOperationException();
for (int i = 0; i < _n; i++)
{
_x[i].Re = input[i];
_x[i].Im = 0;
}
Rad2FFT(_x, _dft);
for (int i = 0; i < FftSize; i++)
{
output[i] = CalculateOutputValue(_dft[i]);
}
}
private double CalculateOutputValue(Complex complex)
{
double magnitude = Math.Sqrt(complex.Re * complex.Re + complex.Im * complex.Im);
// convert to magnitude to dB
return 20 * Math.Log10(magnitude / _n);
}
private void Rad2FFT(Complex[] x, Complex[] DFT)
{
int BSep; // BSep is memory spacing between butterflies
int BWidth; // BWidth is memory spacing of opposite ends of the butterfly
int P; // P is number of similar Wn's to be used in that stage
int iaddr; // bitmask for bit reversal
int ii; // Integer bitfield for bit reversal (Decimation in Time)
int DFTindex = 0; // Pointer to first elements in DFT array
// Decimation In Time - x[n] sample sorting
for (int i = 0; i < _n; i++, DFTindex++)
{
var pX = x[i]; // Calculate current x[n] from index i.
ii = 0; // Reset new address for DFT[n]
iaddr = i; // Copy i for manipulations
for (int l = 0; l < _m; l++) // Bit reverse i and store in ii...
{
if ((iaddr & 0x01) != 0) // Detemine least significant bit
ii += (1 << (_mm1 - l)); // Increment ii by 2^(M-1-l) if lsb was 1
iaddr >>= 1; // right shift iaddr to test next bit. Use logical operations for speed increase
if (iaddr == 0)
break;
}
var dft = DFT[ii]; // Calculate current DFT[n] from bit reversed index ii
dft.Re = pX.Re; // Update the complex array with address sorted time domain signal x[n]
dft.Im = pX.Im; // NB: Imaginary is always zero
}
// FFT Computation by butterfly calculation
for (int stage = 1; stage <= _m; stage++) // Loop for M stages, where 2^M = N
{
BSep = (int)(Math.Pow(2, stage)); // Separation between butterflies = 2^stage
P = _n / BSep; // Similar Wn's in this stage = N/Bsep
BWidth = BSep / 2; // Butterfly width (spacing between opposite points) = Separation / 2.
for (int j = 0; j < BWidth; j++) // Loop for j calculations per butterfly
{
if (j != 0) // Save on calculation if R = 0, as WN^0 = (1 + j0)
{
_wn.Re = Math.Cos(_twoPiN * P * j); // Calculate Wn (Real and Imaginary)
_wn.Im = -Math.Sin(_twoPiN * P * j);
}
// HiIndex is the index of the DFT array for the top value of each butterfly calc
for (int HiIndex = j; HiIndex < _n; HiIndex += BSep) // Loop for HiIndex Step BSep butterflies per stage
{
var pHi = DFT[HiIndex]; // Point to higher value
var pLo = DFT[HiIndex + BWidth]; // Point to lower value
if (j != 0) // If exponential power is not zero...
{
// Perform complex multiplication of LoValue with Wn
_temp.Re = (pLo.Re * _wn.Re) - (pLo.Im * _wn.Im);
_temp.Im = (pLo.Re * _wn.Im) + (pLo.Im * _wn.Re);
// Find new LoValue (complex subtraction)
pLo.Re = pHi.Re - _temp.Re;
pLo.Im = pHi.Im - _temp.Im;
// Find new HiValue (complex addition)
pHi.Re = (pHi.Re + _temp.Re);
pHi.Im = (pHi.Im + _temp.Im);
}
else
{
_temp.Re = pLo.Re;
_temp.Im = pLo.Im;
// Find new LoValue (complex subtraction)
pLo.Re = pHi.Re - _temp.Re;
pLo.Im = pHi.Im - _temp.Im;
// Find new HiValue (complex addition)
pHi.Re = (pHi.Re + _temp.Re);
pHi.Im = (pHi.Im + _temp.Im);
}
}
}
}
}
class Complex
{
public double Re, Im;
}
}
}StubAudioAnalyzerDataProvider.cs(Xamarin.iOS)
View source codeusing System;
using System.Reactive.Linq;
namespace Xamarin.Examples.Demo.Showcase.AudioAnalyzer
{
public class StubAudioAnalyzerDataProvider : IAudioAnalyzerDataProvider
{
private const int ItemsCount = 2048;
private readonly AudioData _audioData = new AudioData(ItemsCount);
private long _time = 0;
private AudioData OnNext()
{
var timeValues = _audioData.XData;
for (int i = 0; i < ItemsCount; i++)
{
timeValues[i] = _time++;
}
_provider.UpdateYValues(timeValues, _audioData.YData);
return _audioData;
}
public IObservable<AudioData> Data
{
get
{
return Observable
.Interval(TimeSpan.FromMilliseconds(20))
.Select(interval => OnNext());
}
}
public int BufferSize => ItemsCount;
public int SampleRate { get; } = 44100;
private readonly IYValuesProvider _provider = new AggregateYValuesProvider(new IYValuesProvider[]
{
new FrequencySinewaveYValuesProvider(8000, 0, 0, 1, 0.0000005),
new NoisySinewaveYValuesProvider(8000, 0, 0.000032, 200),
new NoisySinewaveYValuesProvider(6000, 0, 0.000016, 100),
new NoisySinewaveYValuesProvider(4000, 0, 0.000064, 100)
});
interface IYValuesProvider
{
void UpdateYValues(long[] timeValues, short[] yValuesToUpdate);
}
class FrequencySinewaveYValuesProvider : IYValuesProvider
{
private readonly double _amplitude;
private readonly double _phase;
private readonly double _minFrequency;
private readonly double _maxFrequency;
private readonly double _step;
private double _frequency;
public FrequencySinewaveYValuesProvider(double amplitude, double phase, double minFrequency, double maxFrequency, double step)
{
_amplitude = amplitude;
_phase = phase;
_minFrequency = minFrequency;
_maxFrequency = maxFrequency;
_step = step;
_frequency = minFrequency;
}
private short GetYValueForIndex(long index)
{
_frequency = _frequency <= _maxFrequency ? _frequency + _step : _minFrequency;
var wn = 2 * Math.PI * _frequency;
return (short)(_amplitude * Math.Sin(index * wn + _phase));
}
public void UpdateYValues(long[] timeValues, short[] yValuesToUpdate)
{
for (int i = 0; i < timeValues.Length; i++)
{
var time = timeValues[i];
_frequency = _frequency <= _maxFrequency ? _frequency + _step : _minFrequency;
var wn = 2 * Math.PI * _frequency;
yValuesToUpdate[i] += (short)(_amplitude * Math.Sin(time * wn + _phase));
}
}
}
class NoisySinewaveYValuesProvider : IYValuesProvider
{
private readonly Random _random = new Random();
private readonly double _amplitude;
private readonly double _phase;
private readonly double _wn;
private readonly double _noiseAmplitude;
public NoisySinewaveYValuesProvider(double amplitude, double phase, double frequency, double noiseAmplitude)
{
_amplitude = amplitude;
_phase = phase;
_wn = 2 * Math.PI * frequency;
_noiseAmplitude = noiseAmplitude;
}
public void UpdateYValues(long[] timeValues, short[] yValuesToUpdate)
{
for (int i = 0; i < timeValues.Length; i++)
{
var time = timeValues[i];
yValuesToUpdate[i] += (short)(_amplitude * Math.Sin(time * _wn + _phase) + (_random.NextDouble() - .5) * _noiseAmplitude);
}
}
}
class AggregateYValuesProvider : IYValuesProvider
{
private readonly IYValuesProvider[] _providers;
public AggregateYValuesProvider(IYValuesProvider[] providers)
{
_providers = providers;
}
public void UpdateYValues(long[] timeValues, short[] yValuesToUpdate)
{
Array.Clear(yValuesToUpdate, 0, yValuesToUpdate.Length);
for (int i = 0; i < _providers.Length; i++)
{
_providers[i].UpdateYValues(timeValues, yValuesToUpdate);
}
}
}
}
}