Xamarin Chart - Examples
Please note! These examples are new to SciChart Mobile v3 release! SciChart iOS & Android ship with Xamarin.iOS and Xamarin.Android bindings around our native iOS & Android Chart controls, allowing you to create fast & feature rich charts to your Xamarin applications. We include ~90 native iOS examples and 90 Android examples, but now also ~60 Xamarin Chart Examples to help you get started with SciChart. You can download the source for our Xamarin Chart Examples from Github, or browse the source code below.
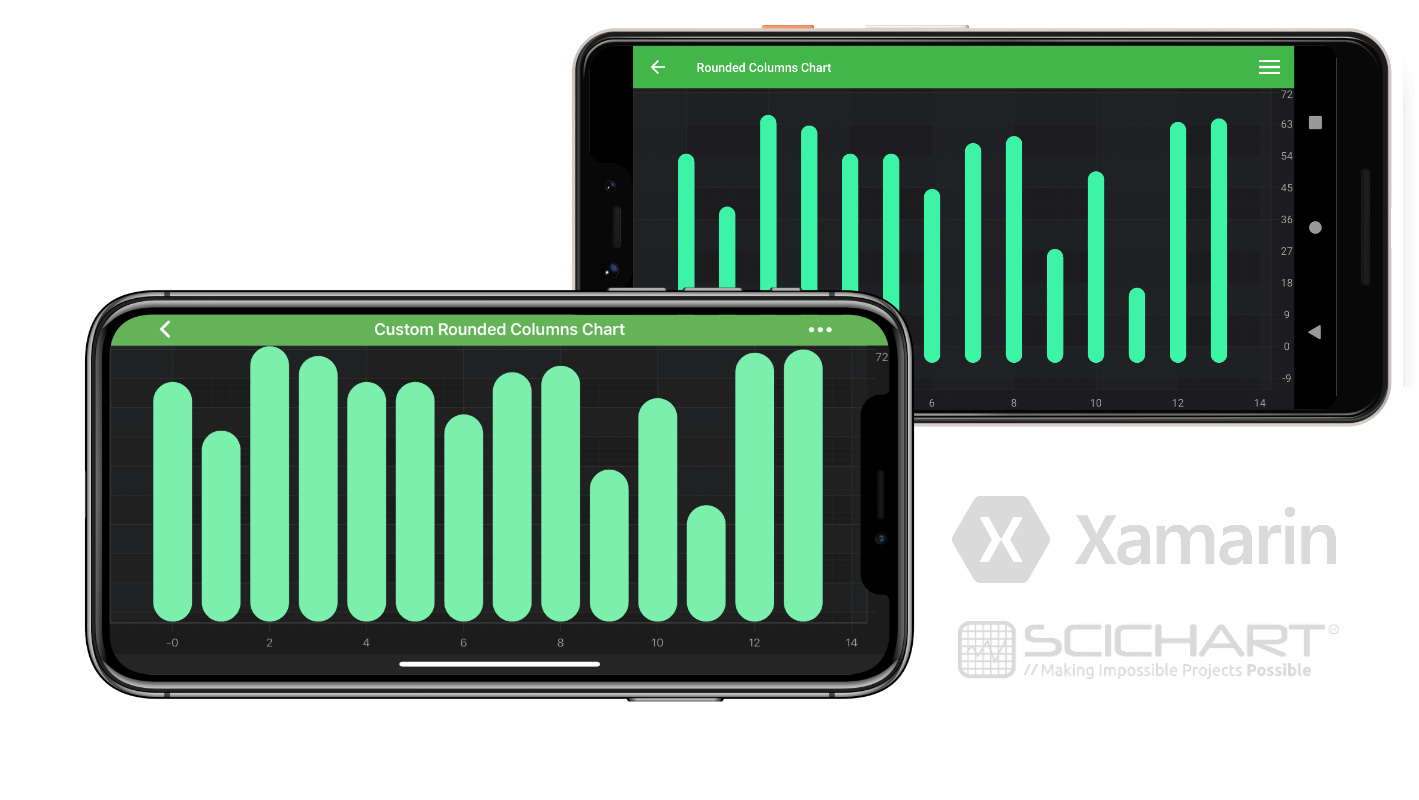
This example shows how to create a Custom series chart, in this case it is a rounded column example using the Custom Series API in SciChart Xamarin.iOS and Xamarin.Android.
For more information please see the documentation:
– Custom Renderable Series Rounded Columns iOS and Xamarin.iOS
– Custom Renderable Series Rounded Columns Android and Xamarin.Android

The C#/Xamarin.iOS/Xamarin.Android source code for the Xamarin Custom Series Rounded Column Example example is included below (Scroll down!).
Did you know you can also view the source code from one of the following sources as well?
- Clone the SciChart.Xamarin.Examples from Github.
- Also, the SciChart for Xamarin Trial contains the full source code for the Xamarin chart examples (link below).
RoundedColumnRenderableSeries.cs(Xamarin.iOS)
View source codeusing SciChart.iOS.Charting;
using ObjCRuntime;
namespace Xamarin.Examples.Demo.iOS
{
public class RoundedColumnRenderableSeries: SCIFastColumnRenderableSeries
{
private readonly SCIFloatValues topEllipsesBuffer = new SCIFloatValues();
private readonly SCIFloatValues rectsBuffer = new SCIFloatValues();
private readonly SCIFloatValues bottomEllipsesBuffer = new SCIFloatValues();
public RoundedColumnRenderableSeries() : base(new SCIColumnRenderPassData(), new SCIColumnHitProvider(), new SCINearestColumnPointProvider())
{
}
protected override void DisposeCachedData()
{
base.DisposeCachedData();
topEllipsesBuffer.Dispose();
rectsBuffer.Dispose();
bottomEllipsesBuffer.Dispose();
}
protected override void InternalDraw(IISCIRenderContext2D renderContext, IISCIAssetManager2D assetManager, IISCISeriesRenderPassData renderPassData)
{
// Don't draw transparent series
if (Opacity == 0) return;
SCIBrushStyle fillStyle = FillBrushStyle;
if (fillStyle == null || !fillStyle.IsVisible) return;
SCIColumnRenderPassData rpd = Runtime.GetNSObject<SCIColumnRenderPassData>(renderPassData.Handle);
updateDrawingBuffersWithData(rpd, rpd.ColumnPixelWidth, rpd.ZeroLineCoord);
IISCIBrush2D brush = assetManager.BrushWithStyle(fillStyle);
renderContext.FillRects(rectsBuffer.ItemsArray, 0, rectsBuffer.Count, brush);
renderContext.FillEllipses(topEllipsesBuffer.ItemsArray, 0, topEllipsesBuffer.Count, brush);
renderContext.FillEllipses(bottomEllipsesBuffer.ItemsArray, 0, bottomEllipsesBuffer.Count, brush);
}
void updateDrawingBuffersWithData(SCIColumnRenderPassData renderPassData, float columnPixelWidth, float zeroLine)
{
float halfWidth = columnPixelWidth / 2;
topEllipsesBuffer.Count = renderPassData.PointsCount * 4;
rectsBuffer.Count = renderPassData.PointsCount * 4;
bottomEllipsesBuffer.Count = renderPassData.PointsCount * 4;
for (var i = 0; i < renderPassData.PointsCount; i++)
{
float x = renderPassData.XCoords.GetValueAt(i);
float y = renderPassData.YCoords.GetValueAt(i);
topEllipsesBuffer.Set(x - halfWidth, i * 4);
topEllipsesBuffer.Set(y, i * 4 + 1);
topEllipsesBuffer.Set(x + halfWidth, i * 4 + 2);
topEllipsesBuffer.Set(y - columnPixelWidth, i * 4 + 3);
rectsBuffer.Set(x - halfWidth, i * 4);
rectsBuffer.Set(y - halfWidth, i * 4 + 1);
rectsBuffer.Set(x + halfWidth, i * 4 + 2);
rectsBuffer.Set(zeroLine + halfWidth, i * 4 + 3);
bottomEllipsesBuffer.Set(x - halfWidth, i * 4);
bottomEllipsesBuffer.Set(zeroLine + columnPixelWidth, i * 4 + 1);
bottomEllipsesBuffer.Set(x + halfWidth, i * 4 + 2);
bottomEllipsesBuffer.Set(zeroLine, i * 4 + 3);
}
}
}
}
RoundedColumnsChartViewController.cs(Xamarin.iOS)
View source codeusing SciChart.iOS.Charting;
namespace Xamarin.Examples.Demo.iOS
{
[ExampleDefinition("Custom Rounded Columns Chart", description: "Generates a rounded columns chart in code.", icon: ExampleIcon.ColumnChart)]
public class RoundedColumnsChartViewController : SingleChartViewController<SCIChartSurface>
{
protected override void InitExample()
{
var xAxis = new SCINumericAxis { GrowBy = new SCIDoubleRange(0.1, 0.1) };
var yAxis = new SCINumericAxis { GrowBy = new SCIDoubleRange(0.2, 0.2) };
var dataSeries = new XyDataSeries<double, double>();
var yValues = new[] { 50, 35, 61, 58, 50, 50, 40, 53, 55, 23, 45, 12, 59, 60 };
for (var i = 0; i < yValues.Length; i++)
{
dataSeries.Append(i, yValues[i]);
}
var rSeries = new RoundedColumnRenderableSeries {
DataSeries = dataSeries,
FillBrushStyle = new SCISolidBrushStyle(0xff3cf3a6)
};
using (Surface.SuspendUpdates())
{
Surface.XAxes.Add(xAxis);
Surface.YAxes.Add(yAxis);
Surface.RenderableSeries.Add(rSeries);
Surface.ChartModifiers.Add(CreateDefaultModifiers());
SCIAnimations.WaveSeries(rSeries, 3, new SCICubicEase());
}
}
}
}
RoundedColumnsChartFragment.cs(Xamarin.Android)
View source codeusing Android.Views.Animations;
using SciChart.Charting.Model;
using SciChart.Charting.Model.DataSeries;
using SciChart.Charting.Modifiers;
using SciChart.Charting.Visuals;
using SciChart.Charting.Visuals.Animations;
using SciChart.Charting.Visuals.Axes;
using SciChart.Data.Model;
using SciChart.Drawing.Common;
using Xamarin.Examples.Demo.Droid.Fragments.Base;
namespace Xamarin.Examples.Demo.Droid.Fragments.Examples
{
[ExampleDefinition("Custom Rounded Columns Chart", description: "Generates a rounded columns chart in code.", icon: ExampleIcon.ColumnChart)]
public class RoundedColumnsChartFragment : ExampleBaseFragment
{
public SciChartSurface Surface => View.FindViewById<SciChartSurface>(Resource.Id.chart);
public override int ExampleLayoutId => Resource.Layout.Example_Single_Chart_Fragment;
protected override void InitExample()
{
var xAxis = new NumericAxis(Activity) { GrowBy = new DoubleRange(0.1, 0.1) };
var yAxis = new NumericAxis(Activity) { GrowBy = new DoubleRange(0.2, 0.2) };
var dataSeries = new XyDataSeries<double, double>();
var yValues = new[] { 50, 35, 61, 58, 50, 50, 40, 53, 55, 23, 45, 12, 59, 60 };
for (var i = 0; i < yValues.Length; i++)
{
dataSeries.Append(i, yValues[i]);
}
var rSeries = new RoundedColumnsRenderableSeries
{
DataSeries = dataSeries,
FillBrushStyle = new SolidBrushStyle(0xFF3CF3A6),
};
using (Surface.SuspendUpdates())
{
Surface.XAxes.Add(xAxis);
Surface.YAxes.Add(yAxis);
Surface.RenderableSeries.Add(rSeries);
Surface.ChartModifiers = new ChartModifierCollection
{
new ZoomPanModifier(),
new PinchZoomModifier(),
new ZoomExtentsModifier(),
};
new ScaleAnimatorBuilder(rSeries) { Interpolator = new OvershootInterpolator(), Duration = 1500, StartDelay = 350 }.Start();
}
}
}
}
RoundedColumnsRenderableSeries.cs(Xamarin.Android)
View source codeusing SciChart.Charting.Visuals.RenderableSeries;
using SciChart.Charting.Visuals.RenderableSeries.Data;
using SciChart.Charting.Visuals.RenderableSeries.HitTest;
using SciChart.Core.Model;
using SciChart.Drawing.Common;
namespace Xamarin.Examples.Demo.Droid
{
public class RoundedColumnsRenderableSeries: FastColumnRenderableSeries
{
private FloatValues topEllipsesBuffer = new FloatValues();
private FloatValues rectsBuffer = new FloatValues();
private FloatValues bottomEllipsesBuffer = new FloatValues();
public RoundedColumnsRenderableSeries() : base(new ColumnRenderPassData(), new ColumnHitProvider(), new NearestColumnPointProvider())
{
}
protected override void DisposeCachedData()
{
base.DisposeCachedData();
topEllipsesBuffer.DisposeItems();
rectsBuffer.DisposeItems();
bottomEllipsesBuffer.DisposeItems();
}
protected override void InternalDraw(IRenderContext2D renderContext, IAssetManager2D assetManager, ISeriesRenderPassData renderPassData)
{
// Don't draw transparent series
if (Opacity == 0) return;
if (FillBrushStyle == null || !FillBrushStyle.IsVisible) return;
ColumnRenderPassData rpd = (ColumnRenderPassData)renderPassData;
float diameter = rpd.ColumnPixelWidth;
updateDrawingBuffers(rpd, diameter, rpd.ZeroLineCoord);
IBrush2D brush = assetManager.CreateBrush(FillBrushStyle);
renderContext.FillRects(rectsBuffer.GetItemsArray(), 0, rectsBuffer.Size(), brush);
renderContext.DrawEllipses(topEllipsesBuffer.GetItemsArray(), 0, topEllipsesBuffer.Size(), diameter, diameter, brush);
renderContext.DrawEllipses(bottomEllipsesBuffer.GetItemsArray(), 0, bottomEllipsesBuffer.Size(), diameter, diameter, brush);
}
void updateDrawingBuffers(ColumnRenderPassData renderPassData, float columnPixelWidth, float zeroLine)
{
float halfWidth = columnPixelWidth / 2;
topEllipsesBuffer.SetSize(renderPassData.PointsCount() * 2);
rectsBuffer.SetSize(renderPassData.PointsCount() * 4);
bottomEllipsesBuffer.SetSize(renderPassData.PointsCount() * 2);
float[] xCoordsArray = renderPassData.XCoords.GetItemsArray();
float[] yCoordsArray = renderPassData.YCoords.GetItemsArray();
for (int i = 0, count = renderPassData.PointsCount(); i < count; i++)
{
float x = xCoordsArray[i];
float y = yCoordsArray[i];
topEllipsesBuffer.Set(i * 2, x);
topEllipsesBuffer.Set(i * 2 + 1, y - halfWidth);
rectsBuffer.Set(i * 4, x - halfWidth);
rectsBuffer.Set(i * 4 + 1, y - halfWidth);
rectsBuffer.Set(i * 4 + 2, x + halfWidth);
rectsBuffer.Set(i * 4 + 3, zeroLine + halfWidth);
bottomEllipsesBuffer.Set(i * 2, x);
bottomEllipsesBuffer.Set(i * 2 + 1, zeroLine + halfWidth);
}
}
}
}
