Xamarin Chart - Examples
Please note! These examples are new to SciChart Mobile v3 release! SciChart iOS & Android ship with Xamarin.iOS and Xamarin.Android bindings around our native iOS & Android Chart controls, allowing you to create fast & feature rich charts to your Xamarin applications. We include ~90 native iOS examples and 90 Android examples, but now also ~60 Xamarin Chart Examples to help you get started with SciChart. You can download the source for our Xamarin Chart Examples from Github, or browse the source code below.
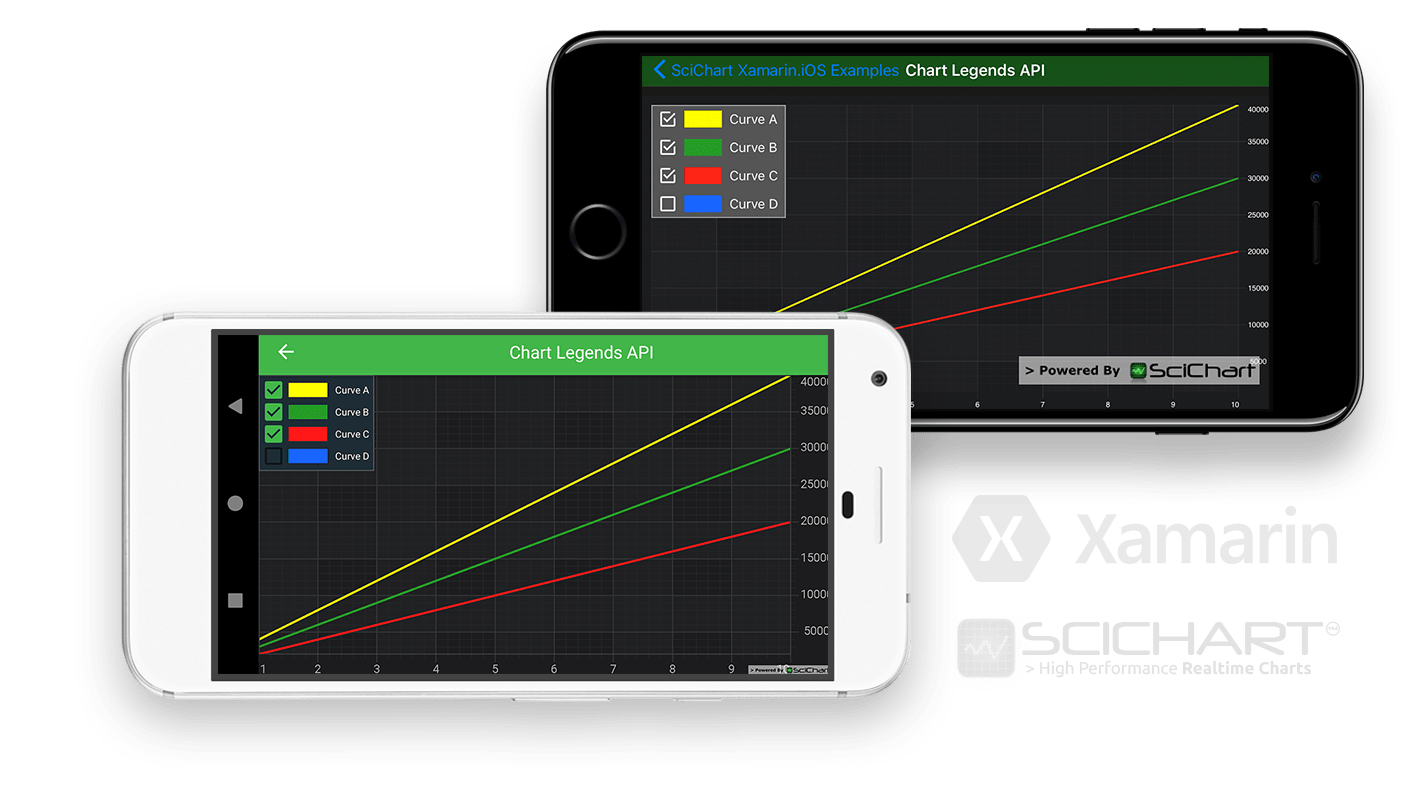
This example demonstrates how to create a simple Xamarin Line Chart with a legend on it.
See tutorials on how to work with legends on Xamarin.iOS and legends on Xamarin.Android
Tip!
There are many different configurations for the Legend control. The Legend displays the series names, colors and a checkbox which can be used to change visibility of the series. It is possible to change the legend orientation, to show/hide series markers or visibility checkboxes, as well as set the position of the legend in the chart. This example demonstrates how to create a simple Xamarin Line Chart with a legend to it.

The C#/Xamarin.iOS/Xamarin.Android source code for the Xamarin Chart with Legends example is included below (Scroll down!).
Did you know you can also view the source code from one of the following sources as well?
- Clone the SciChart.Xamarin.Examples from Github.
- Also, the SciChart for Xamarin Trial contains the full source code for the Xamarin chart examples (link below).
LegendViewController.cs (Xamarin.iOS)
View source codeusing Xamarin.Examples.Demo.Data;
using SciChart.iOS.Charting;
namespace Xamarin.Examples.Demo.iOS
{
[ExampleDefinition("Chart Legends API", description: "Demonstrates the SciChart Legend API", icon: ExampleIcon.LineChart)]
public class LegendViewController : SingleChartViewController<SCIChartSurface>
{
protected override void InitExample()
{
var xAxis = new SCINumericAxis();
var yAxis = new SCINumericAxis();
var ds1 = new XyDataSeries<double, double> { SeriesName = "Curve A" };
var ds2 = new XyDataSeries<double, double> { SeriesName = "Curve B" };
var ds3 = new XyDataSeries<double, double> { SeriesName = "Curve C" };
var ds4 = new XyDataSeries<double, double> { SeriesName = "Curve D" };
var ds1Points = DataManager.Instance.GetStraightLine(4000, 1.0, 10);
var ds2Points = DataManager.Instance.GetStraightLine(3000, 1.0, 10);
var ds3Points = DataManager.Instance.GetStraightLine(2000, 1.0, 10);
var ds4Points = DataManager.Instance.GetStraightLine(1000, 1.0, 10);
ds1.Append(ds1Points.XData, ds1Points.YData);
ds2.Append(ds2Points.XData, ds2Points.YData);
ds3.Append(ds3Points.XData, ds3Points.YData);
ds4.Append(ds4Points.XData, ds4Points.YData);
var rs1 = new SCIFastLineRenderableSeries { DataSeries = ds1, StrokeStyle = new SCISolidPenStyle(0xFFFFFF00, 2f) };
var rs2 = new SCIFastLineRenderableSeries { DataSeries = ds2, StrokeStyle = new SCISolidPenStyle(0xFF279B27, 2f) };
var rs3 = new SCIFastLineRenderableSeries { DataSeries = ds3, StrokeStyle = new SCISolidPenStyle(0xFFFF1919, 2f) };
var rs4 = new SCIFastLineRenderableSeries { DataSeries = ds4, StrokeStyle = new SCISolidPenStyle(0xFF1964FF, 2f), IsVisible = false };
using (Surface.SuspendUpdates())
{
Surface.XAxes.Add(xAxis);
Surface.YAxes.Add(yAxis);
Surface.RenderableSeries.Add(rs1);
Surface.RenderableSeries.Add(rs2);
Surface.RenderableSeries.Add(rs3);
Surface.RenderableSeries.Add(rs4);
Surface.ChartModifiers.Add(new SCILegendModifier { SourceMode = SCISourceMode.AllSeries });
SCIAnimations.SweepSeries(rs1, 3, new SCICubicEase());
SCIAnimations.SweepSeries(rs2, 3, new SCICubicEase());
SCIAnimations.SweepSeries(rs3, 3, new SCICubicEase());
SCIAnimations.SweepSeries(rs4, 3, new SCICubicEase());
}
}
}
}LegendChartFragment.cs (Xamarin.Android)
View source codeusing Android.Views.Animations;
using SciChart.Charting.Model;
using SciChart.Charting.Model.DataSeries;
using SciChart.Charting.Modifiers;
using SciChart.Charting.Visuals;
using SciChart.Charting.Visuals.Animations;
using SciChart.Charting.Visuals.Axes;
using SciChart.Charting.Visuals.RenderableSeries;
using SciChart.Drawing.Common;
using Xamarin.Examples.Demo.Data;
using Xamarin.Examples.Demo;
using Xamarin.Examples.Demo.Droid.Extensions;
using Xamarin.Examples.Demo.Droid.Fragments.Base;
namespace Xamarin.Examples.Demo.Droid.Fragments.Examples
{
[ExampleDefinition("Chart Legends API", description:"Demonstrates the SciChart Legend API", icon: ExampleIcon.LineChart)]
public class LegendFragment : ExampleBaseFragment
{
public override int ExampleLayoutId => Resource.Layout.Example_Single_Chart_Fragment;
private SciChartSurface Surface => View.FindViewById<SciChartSurface>(Resource.Id.chart);
protected override void InitExample()
{
var xAxis = new NumericAxis(Activity);
var yAxis = new NumericAxis(Activity);
var ds1 = new XyDataSeries<double, double> {SeriesName = "Curve A"};
var ds2 = new XyDataSeries<double, double> {SeriesName = "Curve B"};
var ds3 = new XyDataSeries<double, double> {SeriesName = "Curve C"};
var ds4 = new XyDataSeries<double, double> {SeriesName = "Curve D"};
var ds1Points = DataManager.Instance.GetStraightLine(4000, 1.0, 10);
var ds2Points = DataManager.Instance.GetStraightLine(3000, 1.0, 10);
var ds3Points = DataManager.Instance.GetStraightLine(2000, 1.0, 10);
var ds4Points = DataManager.Instance.GetStraightLine(1000, 1.0, 10);
ds1.Append(ds1Points.XData, ds1Points.YData);
ds2.Append(ds2Points.XData, ds2Points.YData);
ds3.Append(ds3Points.XData, ds3Points.YData);
ds4.Append(ds4Points.XData, ds4Points.YData);
var legendModifier = new LegendModifier(Activity);
legendModifier.SetSourceMode(SourceMode.AllSeries);
var line1 = new FastLineRenderableSeries { DataSeries = ds1, StrokeStyle = new SolidPenStyle(0xFFFFFF00, 2f.ToDip(Activity)) };
var line2 = new FastLineRenderableSeries { DataSeries = ds2, StrokeStyle = new SolidPenStyle(0xFF279B27, 2f.ToDip(Activity)) };
var line3 = new FastLineRenderableSeries { DataSeries = ds3, StrokeStyle = new SolidPenStyle(0xFFFF1919, 2f.ToDip(Activity)) };
var line4 = new FastLineRenderableSeries { DataSeries = ds4, IsVisible = false, StrokeStyle = new SolidPenStyle(0xFF1964FF, 2f.ToDip(Activity)) };
using (Surface.SuspendUpdates())
{
Surface.XAxes.Add(xAxis);
Surface.YAxes.Add(yAxis);
Surface.RenderableSeries = new RenderableSeriesCollection { line1, line2, line3, line4 };
Surface.ChartModifiers.Add(legendModifier);
new SweepAnimatorBuilder(line1) { Interpolator = new DecelerateInterpolator(), Duration = 3000, StartDelay = 350 }.Start();
new SweepAnimatorBuilder(line2) { Interpolator = new DecelerateInterpolator(), Duration = 3000, StartDelay = 350 }.Start();
new SweepAnimatorBuilder(line3) { Interpolator = new DecelerateInterpolator(), Duration = 3000, StartDelay = 350 }.Start();
new SweepAnimatorBuilder(line4) { Interpolator = new DecelerateInterpolator(), Duration = 3000, StartDelay = 350 }.Start();
}
}
}
}