Xamarin Chart - Examples
Please note! These examples are new to SciChart Mobile v3 release! SciChart iOS & Android ship with Xamarin.iOS and Xamarin.Android bindings around our native iOS & Android Chart controls, allowing you to create fast & feature rich charts to your Xamarin applications. We include ~90 native iOS examples and 90 Android examples, but now also ~60 Xamarin Chart Examples to help you get started with SciChart. You can download the source for our Xamarin Chart Examples from Github, or browse the source code below.
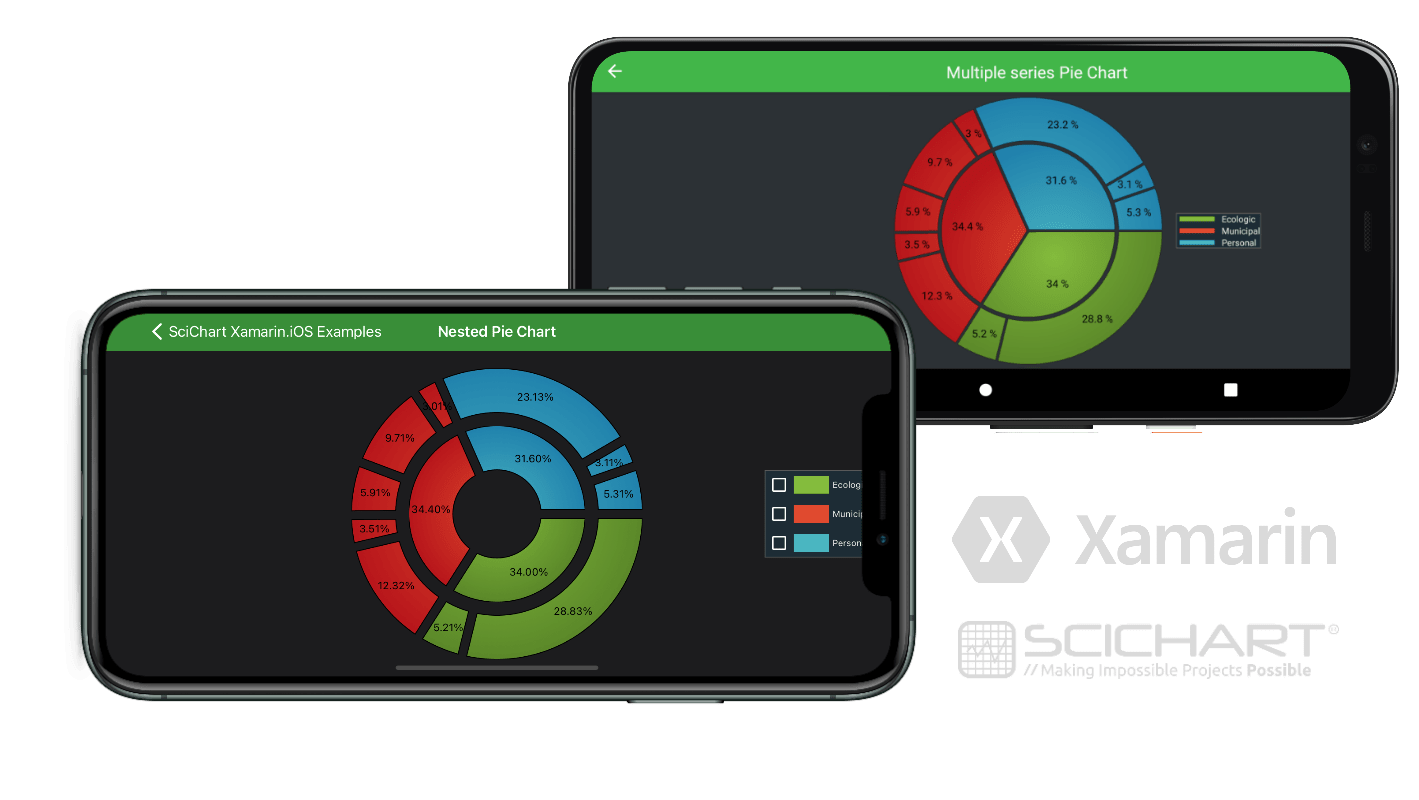
This example demonstrates how to create a Nested Pie Chart in code with Xamarin in SciChart.

The C#/Xamarin.iOS/Xamarin.Android source code for the Xamarin Nested Pie Chart Demo is included below (Scroll down!).
Did you know you can also view the source code from one of the following sources as well?
- Clone the SciChart.Xamarin.Examples from Github.
- Also, the SciChart for Xamarin Trial contains the full source code for the Xamarin chart examples (link below).
NestedPieChartsViewController.cs (Xamarin.iOS)
View source codeusing System.Threading.Tasks;
using SciChart.iOS.Charting;
using UIKit;
namespace Xamarin.Examples.Demo.iOS
{
[ExampleDefinition("Nested Pie Chart", description: "Creates a simple donut chart", icon: ExampleIcon.LineChart)]
public class NestedPieChartsViewController : SingleChartViewController<SCIPieChartSurface>
{
protected override void InitExample()
{
var pieSeries = new SCIDonutRenderableSeries
{
SegmentsCollection = new SCIPieSegmentCollection
{
new SCIPieSegment { Value = 34, Title = "Ecologic", FillStyle = new SCIRadialGradientBrushStyle(0xff84BC3D, 0xff5B8829) },
new SCIPieSegment { Value = 34.4, Title = "Municipal", FillStyle = new SCIRadialGradientBrushStyle(0xffe04a2f, 0xffB7161B) },
new SCIPieSegment { Value = 31.6, Title = "Personal", FillStyle = new SCIRadialGradientBrushStyle(0xff4AB6C1, 0xff2182AD) },
},
};
var donutSeries = new SCIDonutRenderableSeries
{
SegmentsCollection = new SCIPieSegmentCollection
{
new SCIPieSegment { Value = 28.8, Title = "Walking", FillStyle = new SCIRadialGradientBrushStyle(0xff84BC3D, 0xff5B8829) },
new SCIPieSegment { Value = 5.2, Title = "Bycicle", FillStyle = new SCIRadialGradientBrushStyle(0xff84BC3D, 0xff5B8829) },
new SCIPieSegment { Value = 12.3, Title = "Metro", FillStyle = new SCIRadialGradientBrushStyle(0xffe04a2f, 0xffB7161B) },
new SCIPieSegment { Value = 3.5, Title = "Tram", FillStyle = new SCIRadialGradientBrushStyle(0xffe04a2f, 0xffB7161B) },
new SCIPieSegment { Value = 5.9, Title = "Rail", FillStyle = new SCIRadialGradientBrushStyle(0xffe04a2f, 0xffB7161B) },
new SCIPieSegment { Value = 9.7, Title = "Bus", FillStyle = new SCIRadialGradientBrushStyle(0xffe04a2f, 0xffB7161B) },
new SCIPieSegment { Value = 3, Title = "Taxi", FillStyle = new SCIRadialGradientBrushStyle(0xffe04a2f, 0xffB7161B) },
new SCIPieSegment { Value = 23.1, Title = "Car", FillStyle = new SCIRadialGradientBrushStyle(0xff4AB6C1, 0xff2182AD) },
new SCIPieSegment { Value = 3.1, Title = "Motor", FillStyle = new SCIRadialGradientBrushStyle(0xff4AB6C1, 0xff2182AD) },
new SCIPieSegment { Value = 5.3, Title = "Other", FillStyle = new SCIRadialGradientBrushStyle(0xff4AB6C1, 0xff2182AD) },
},
};
Surface.RenderableSeries.Add(pieSeries);
Surface.RenderableSeries.Add(donutSeries);
Surface.ChartModifiers.Add(new SCIPieChartLegendModifier
{
SourceSeries = pieSeries,
Position = SCIAlignment.Bottom | SCIAlignment.CenterHorizontal,
Margins = new UIEdgeInsets(17, 17, 17, 17),
});
Surface.ChartModifiers.Add(new SCIPieChartTooltipModifier());
pieSeries.Scale = 0;
donutSeries.Scale = 0;
pieSeries.Animate(0.7);
donutSeries.Animate(0.7);
}
}
}
MultiplePieDonutChartFragment.cs (Xamarin.Android)
View source codeusing SciChart.Charting.Model;
using SciChart.Charting.Modifiers;
using SciChart.Charting.Visuals;
using SciChart.Charting.Visuals.Legend;
using SciChart.Charting.Visuals.RenderableSeries;
using SciChart.Drawing.Common;
using Xamarin.Examples.Demo;
using System.Drawing;
using Xamarin.Examples.Demo.Droid.Extensions;
using Xamarin.Examples.Demo.Droid.Fragments.Base;
namespace Xamarin.Examples.Demo.Droid.Fragments.Examples
{
[ExampleDefinition("Multiple series Pie Chart", description: "Demonstrates how to create a PieDonut Chart with multiple series", icon: ExampleIcon.PieChart)]
public class MultiplePieDonutChartFragment : ExampleBaseFragment
{
public override int ExampleLayoutId { get { return Resource.Layout.Example_Single_Pie_Chart_With_Legend_Fragment; } }
private SciPieChartSurface Surface => View.FindViewById<SciPieChartSurface>(Resource.Id.pieChart);
private SciChartLegend Legend => View.FindViewById<SciChartLegend>(Resource.Id.pieChartLegend);
protected override void InitExample()
{
var pieSeries = new PieRenderableSeries
{
SeriesName = "HowPeopleTravel",
SegmentsCollection = new PieSegmentCollection
{
new PieSegment { Value = 34, Title = "Ecologic", FillStyle = createRadialBrush(0xff84BC3D.ToColor(), 0xff5B8829.ToColor()) },
new PieSegment { Value = 34.4, Title = "Municipal", FillStyle = createRadialBrush(0xffe04a2f.ToColor(), 0xffB7161B.ToColor()) },
new PieSegment { Value = 31.6, Title = "Personal", FillStyle = createRadialBrush(0xff4AB6C1.ToColor(), 0xff2182AD.ToColor()) },
}
};
var donutSeries = new DonutRenderableSeries
{
SeriesName = "DetailedGroup",
SegmentsCollection = new PieSegmentCollection
{
new PieSegment { Value = 28.8, Title = "Walking", FillStyle = createRadialBrush(0xff84BC3D.ToColor(), 0xff5B8829.ToColor()) },
new PieSegment { Value = 5.2, Title = "Bicycle", FillStyle = createRadialBrush(0xff84BC3D.ToColor(), 0xff5B8829.ToColor()) },
new PieSegment { Value = 12.3, Title = "Metro", FillStyle = createRadialBrush(0xffe04a2f.ToColor(), 0xffB7161B.ToColor()) },
new PieSegment { Value = 3.5, Title = "Tram", FillStyle = createRadialBrush(0xffe04a2f.ToColor(), 0xffB7161B.ToColor()) },
new PieSegment { Value = 5.9, Title = "Rail", FillStyle = createRadialBrush(0xffe04a2f.ToColor(), 0xffB7161B.ToColor()) },
new PieSegment { Value = 9.7, Title = "Bus", FillStyle = createRadialBrush(0xffe04a2f.ToColor(), 0xffB7161B.ToColor()) },
new PieSegment { Value = 3.0, Title = "Taxi", FillStyle = createRadialBrush(0xffe04a2f.ToColor(), 0xffB7161B.ToColor()) },
new PieSegment { Value = 23.2, Title = "Car", FillStyle = createRadialBrush(0xff4AB6C1.ToColor(), 0xff2182AD.ToColor()) },
new PieSegment { Value = 3.1, Title = "Motorcycle", FillStyle = createRadialBrush(0xff4AB6C1.ToColor(), 0xff2182AD.ToColor()) },
new PieSegment { Value = 5.3, Title = "Other", FillStyle = createRadialBrush(0xff4AB6C1.ToColor(), 0xff2182AD.ToColor()) },
}
};
Surface.RenderableSeries.Add(pieSeries);
Surface.RenderableSeries.Add(donutSeries);
Surface.ChartModifiers = new PieChartModifierCollection
{
new PieChartLegendModifier(Legend).WithSourceSeries(pieSeries).WithShowCheckBoxes(false),
new PieChartTooltipModifier()
};
pieSeries.Animate(800);
donutSeries.Animate(800);
}
private BrushStyle createRadialBrush(Color centerColor, Color edgeColor)
{
var fillStyle = new RadialGradientBrushStyle(0.5f, 0.5f, 0.5f, 0.5f, new[] { centerColor, edgeColor }, new[] { 0f, 1f });
return fillStyle;
}
}
}