Xamarin Chart - Examples
Please note! These examples are new to SciChart Mobile v3 release! SciChart iOS & Android ship with Xamarin.iOS and Xamarin.Android bindings around our native iOS & Android Chart controls, allowing you to create fast & feature rich charts to your Xamarin applications. We include ~90 native iOS examples and 90 Android examples, but now also ~60 Xamarin Chart Examples to help you get started with SciChart. You can download the source for our Xamarin Chart Examples from Github, or browse the source code below.
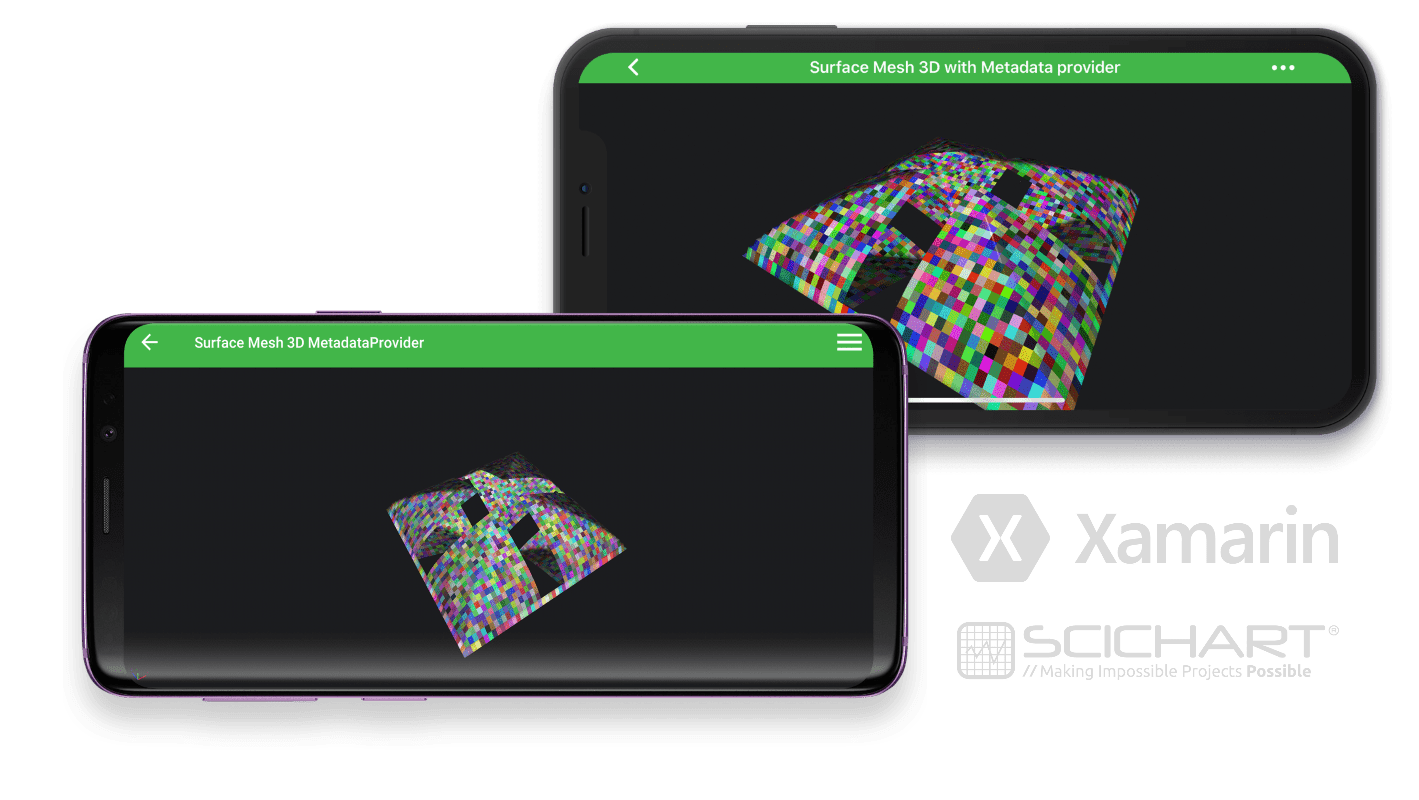
This example showcases how to use PaletteProvider API for a 3D Surface Mesh Chart to color the individual cells of the chart created with Xamarin.iOS and Xamarin.Android.
See more in the documentation about applying the paletters to a mesh:
Create a 3D Chart with Xamarin.Android
Create a 3D Chart with Xamarin.iOS
Applying Palettes to a Surface Meshes 3D Chart Type in Android

The C#/Xamarin.iOS/Xamarin.Android source code for the Xamarin Surface Mesh Palette Provider 3D Chart example is included below (Scroll down!).
Did you know you can also view the source code from one of the following sources as well?
- Clone the SciChart.Xamarin.Examples from Github.
- Also, the SciChart for Xamarin Trial contains the full source code for the Xamarin chart examples (link below).
SurfaceMeshWithMetadataProvider3DChartViewController.cs (Xamarin.iOS)
View source codeusing System;
using System.Timers;
using ObjCRuntime;
using Xamarin.Examples.Demo.Data;
using SciChart.iOS.Charting;
using Xamarin.Examples.Demo.Utils;
namespace Xamarin.Examples.Demo.iOS
{
[Example3DDefinition("Surface Mesh 3D MetadataProvider", description: "Use the MetadataProvider API to color SurfaceMesh cells individually", icon: ExampleIcon.Surface3D)]
class SurfaceMeshWithMetadataProvider3DChartViewController : SingleChartViewController<SCIChartSurface3D>
{
private const int TimerInterval = 10;
private volatile bool _isRunning = false;
private Timer _timer;
private const int XSize = 49, ZSize = 49;
private readonly UniformGridDataSeries3D<double, double, double> meshDataSeries0 = new UniformGridDataSeries3D<double, double, double>(XSize, ZSize);
private readonly UniformGridDataSeries3D<double, double, double> meshDataSeries1 = new UniformGridDataSeries3D<double, double, double>(XSize, ZSize);
protected override void InitExample()
{
for (int x = 48; x >= 24; x--)
{
double y = Math.Pow(x - 23.7, 0.3);
double y2 = Math.Pow(49.5 - x, 0.3);
meshDataSeries0.UpdateYAt(x, 24, y);
meshDataSeries1.UpdateYAt(x, 24, y2 + 1.505);
}
for (int x = 24; x >= 0; x--)
{
for (int z = 49; z > 25; z--)
{
double y = Math.Pow(z - 23.7, 0.3);
double y2 = Math.Pow(50.5 - z, 0.3) + 1.505;
meshDataSeries0.UpdateYAt(x + 24, 49 - z, y);
meshDataSeries0.UpdateYAt(z - 1, 24 - x, y);
meshDataSeries1.UpdateYAt(x + 24, 49 - z, y2);
meshDataSeries1.UpdateYAt(z - 1, 24 - x, y2);
meshDataSeries0.UpdateYAt(24 - x, 49 - z, y);
meshDataSeries0.UpdateYAt(49 - z, 24 - x, y);
meshDataSeries1.UpdateYAt(24 - x, 49 - z, y2);
meshDataSeries1.UpdateYAt(49 - z, 24 - x, y2);
meshDataSeries0.UpdateYAt(x + 24, z - 1, y);
meshDataSeries0.UpdateYAt(z - 1, x + 24, y);
meshDataSeries1.UpdateYAt(x + 24, z - 1, y2);
meshDataSeries1.UpdateYAt(z - 1, x + 24, y2);
meshDataSeries0.UpdateYAt(24 - x, z - 1, y);
meshDataSeries0.UpdateYAt(49 - z, x + 24, y);
meshDataSeries1.UpdateYAt(24 - x, z - 1, y2);
meshDataSeries1.UpdateYAt(49 - z, x + 24, y2);
}
}
var colors = new[] { ColorUtil.DarkBlue, ColorUtil.Blue, ColorUtil.CadetBlue, ColorUtil.Cyan, ColorUtil.LimeGreen, ColorUtil.GreenYellow, ColorUtil.Yellow, ColorUtil.Tomato, ColorUtil.IndianRed, ColorUtil.Red, ColorUtil.DarkRed};
var stops = new[] { 0, .1f, .2f, .3f, .4f, .5f, .6f, .7f, .8f, .9f, 1 };
var rSeries0 = new SCISurfaceMeshRenderableSeries3D
{
DataSeries = meshDataSeries0,
DrawMeshAs = SCIDrawMeshAs.SolidMesh,
DrawSkirt = false,
MeshColorPalette = new SCIGradientColorPalette(colors, stops),
MetadataProvider = new SurfaceMeshMetadataProvider3D()
};
var rSeries1 = new SCISurfaceMeshRenderableSeries3D
{
DataSeries = meshDataSeries1,
DrawMeshAs = SCIDrawMeshAs.SolidMesh,
DrawSkirt = false,
MeshColorPalette = new SCIGradientColorPalette(colors, stops),
MetadataProvider = new SurfaceMeshMetadataProvider3D()
};
using (Surface.SuspendUpdates())
{
Surface.XAxis = new SCINumericAxis3D
{
DrawMajorBands = false,
DrawMajorGridLines = false,
DrawMinorGridLines = false,
DrawLabels = false,
DrawMajorTicks = false,
DrawMinorTicks = false,
PlaneBorderThickness = 0,
};
Surface.YAxis = new SCINumericAxis3D
{
DrawMajorBands = false,
DrawMajorGridLines = false,
DrawMinorGridLines = false,
DrawLabels = false,
DrawMajorTicks = false,
DrawMinorTicks = false,
PlaneBorderThickness = 0,
};
Surface.ZAxis = new SCINumericAxis3D
{
DrawMajorBands = false,
DrawMajorGridLines = false,
DrawMinorGridLines = false,
DrawLabels = false,
DrawMajorTicks = false,
DrawMinorTicks = false,
PlaneBorderThickness = 0,
};
Surface.RenderableSeries.Add(rSeries0);
Surface.RenderableSeries.Add(rSeries1);
Surface.ChartModifiers.Add(CreateDefault3DModifiers());
Surface.Camera = new SCICamera3D();
}
Start();
}
private void Start()
{
if (_isRunning) return;
_isRunning = true;
_timer = new Timer(TimerInterval);
_timer.Elapsed += OnTick;
_timer.AutoReset = true;
_timer.Start();
}
private void OnTick(object sender, ElapsedEventArgs e)
{
InvokeOnMainThread(() =>
{
if (!_isRunning) return;
Surface.InvalidateElement();
});
}
private void Pause()
{
if (!_isRunning) return;
_isRunning = false;
_timer.Stop();
_timer.Elapsed -= OnTick;
_timer = null;
}
public override void ViewDidDisappear(bool animated)
{
base.ViewDidDisappear(animated);
Pause();
}
}
class SurfaceMeshMetadataProvider3D : SCIMetadataProvider3DBase<SCISurfaceMeshRenderableSeries3D>, IISCISurfaceMeshMetadataProvider3D
{
public void UpdateMeshColors(SCIUnsignedIntegerValues cellColors)
{
var currentRenderPassData = Runtime.GetNSObject<SCISurfaceMeshRenderPassData3D>(RenderableSeries.CurrentRenderPassData.Handle);
var dataManager = DataManager.Instance;
var countX = currentRenderPassData.CountX - 1;
var countZ = currentRenderPassData.CountZ - 1;
cellColors.Count = currentRenderPassData.PointsCount;
for (int x = 0; x < countX; x++)
{
for (int z = 0; z < countX; z++)
{
int index = x * countZ + z;
uint color = ((x >= 20 && x <= 26 && z > 0 && z < 47) || (z >= 20 && z <= 26 && x > 0 && x < 47))
? ColorUtil.Red
: (uint)dataManager.GetRandomColor().ToArgb();
cellColors.Set(color, index);
}
}
}
}
}SurfaceMeshWithMetadataProvider3DChartFragment.cs (Xamarin.Android)
View source codeusing SciChart.Charting3D.Model;
using SciChart.Charting3D.Model.DataSeries.Grid;
using SciChart.Charting3D.Modifiers;
using SciChart.Charting3D.Visuals;
using SciChart.Charting3D.Visuals.Axes;
using SciChart.Charting3D.Visuals.Camera;
using SciChart.Charting3D.Visuals.RenderableSeries.Data;
using SciChart.Charting3D.Visuals.RenderableSeries.MetadataProviders;
using SciChart.Charting3D.Visuals.RenderableSeries.SurfaceMesh;
using SciChart.Core.Model;
using Xamarin.Examples.Demo.Data;
using Xamarin.Examples.Demo;
using System;
using System.Drawing;
using Xamarin.Examples.Demo.Droid.Fragments.Base;
namespace Xamarin.Examples.Demo.Droid.Fragments.Examples3D
{
[Example3DDefinition("Surface Mesh 3D MetadataProvider", description: "Use the MetadataProvider API to color SurfaceMesh cells individually", icon: ExampleIcon.Surface3D)]
class SurfaceMeshWithMetadataProvider3DChartFragment : ExampleBaseFragment
{
private const int XSize = 49, ZSize = 49;
public SciChartSurface3D Surface => View.FindViewById<SciChartSurface3D>(Resource.Id.chart3d);
public override int ExampleLayoutId => Resource.Layout.Example_Single_3D_Chart_Fragment;
private readonly UniformGridDataSeries3D<double, double, double> meshDataSeries0 = new UniformGridDataSeries3D<double, double, double>(XSize, ZSize);
private readonly UniformGridDataSeries3D<double, double, double> meshDataSeries1 = new UniformGridDataSeries3D<double, double, double>(XSize, ZSize);
protected override void InitExample()
{
for (int x = 48; x >= 24; x--)
{
double y = Math.Pow(x - 23.7, 0.3);
double y2 = Math.Pow(49.5 - x, 0.3);
meshDataSeries0.UpdateYAt(x, 24, y);
meshDataSeries1.UpdateYAt(x, 24, y2 + 1.505);
}
for (int x = 24; x >= 0; x--)
{
for (int z = 49; z > 25; z--)
{
double y = Math.Pow(z - 23.7, 0.3);
double y2 = Math.Pow(50.5 - z, 0.3) + 1.505;
meshDataSeries0.UpdateYAt(x + 24, 49 - z, y);
meshDataSeries0.UpdateYAt(z - 1, 24 - x, y);
meshDataSeries1.UpdateYAt(x + 24, 49 - z, y2);
meshDataSeries1.UpdateYAt(z - 1, 24 - x, y2);
meshDataSeries0.UpdateYAt(24 - x, 49 - z, y);
meshDataSeries0.UpdateYAt(49 - z, 24 - x, y);
meshDataSeries1.UpdateYAt(24 - x, 49 - z, y2);
meshDataSeries1.UpdateYAt(49 - z, 24 - x, y2);
meshDataSeries0.UpdateYAt(x + 24, z - 1, y);
meshDataSeries0.UpdateYAt(z - 1, x + 24, y);
meshDataSeries1.UpdateYAt(x + 24, z - 1, y2);
meshDataSeries1.UpdateYAt(z - 1, x + 24, y2);
meshDataSeries0.UpdateYAt(24 - x, z - 1, y);
meshDataSeries0.UpdateYAt(49 - z, x + 24, y);
meshDataSeries1.UpdateYAt(24 - x, z - 1, y2);
meshDataSeries1.UpdateYAt(49 - z, x + 24, y2);
}
}
var colors = new Color[] { Color.DarkBlue, Color.Blue, Color.CadetBlue, Color.Cyan, Color.LimeGreen, Color.GreenYellow, Color.Yellow, Color.Tomato, Color.IndianRed, Color.Red, Color.DarkRed};
var stops = new float[] { 0, .1f, .2f, .3f, .4f, .5f, .6f, .7f, .8f, .9f, 1 };
var rs0 = new SurfaceMeshRenderableSeries3D()
{
DataSeries = meshDataSeries0,
DrawMeshAs = DrawMeshAs.SolidMesh,
DrawSkirt = false,
MeshColorPalette = new GradientColorPalette(colors, stops),
MetadataProvider = new SurfaceMeshMetadataProvider3D()
};
var rs1 = new SurfaceMeshRenderableSeries3D()
{
DataSeries = meshDataSeries1,
DrawMeshAs = DrawMeshAs.SolidMesh,
DrawSkirt = false,
MeshColorPalette = new GradientColorPalette(colors, stops),
MetadataProvider = new SurfaceMeshMetadataProvider3D()
};
using (Surface.SuspendUpdates())
{
Surface.XAxis = new NumericAxis3D()
{
DrawMajorBands = false,
DrawMajorGridLines = false,
DrawMinorGridLines = false,
DrawLabels = false,
DrawMajorTicks = false,
DrawMinorTicks = false,
PlaneBorderThickness = 0
};
Surface.YAxis = new NumericAxis3D()
{
DrawMajorBands = false,
DrawMajorGridLines = false,
DrawMinorGridLines = false,
DrawLabels = false,
DrawMajorTicks = false,
DrawMinorTicks = false,
PlaneBorderThickness = 0
};
Surface.ZAxis = new NumericAxis3D()
{
DrawMajorBands = false,
DrawMajorGridLines = false,
DrawMinorGridLines = false,
DrawLabels = false,
DrawMajorTicks = false,
DrawMinorTicks = false,
PlaneBorderThickness = 0
};
Surface.Camera = new Camera3D();
Surface.RenderableSeries.Add(rs0);
Surface.RenderableSeries.Add(rs1);
Surface.ChartModifiers = new ChartModifier3DCollection
{
new PinchZoomModifier3D(),
new OrbitModifier3D(),
new ZoomExtentsModifier3D()
};
}
}
}
class SurfaceMeshMetadataProvider3D : MetadataProvider3DBase<SurfaceMeshRenderableSeries3D>, ISurfaceMeshMetadataProvider3D
{
public void UpdateMeshColors(IntegerValues cellColors)
{
var currentRenderPassData = (SurfaceMeshRenderPassData3D)RenderableSeries.CurrentRenderPassData;
var dataManager = DataManager.Instance;
var countX = currentRenderPassData.CountX - 1;
var countZ = currentRenderPassData.CountZ - 1;
cellColors.SetSize(currentRenderPassData.PointsCount);
for (int x = 0; x < countX; x++)
{
for (int z = 0; z < countX; z++)
{
int index = x * countZ + z;
int color;
if ((x >= 20 && x <= 26 && z > 0 && z < 47) || (z >= 20 && z <= 26 && x > 0 && x < 47))
{
color = Color.Transparent.ToArgb();
}
else
{
color = dataManager.GetRandomColor().ToArgb();
}
cellColors.Set(index, color);
}
}
}
}
}