Xamarin Chart - Examples
Please note! These examples are new to SciChart Mobile v3 release! SciChart iOS & Android ship with Xamarin.iOS and Xamarin.Android bindings around our native iOS & Android Chart controls, allowing you to create fast & feature rich charts to your Xamarin applications. We include ~90 native iOS examples and 90 Android examples, but now also ~60 Xamarin Chart Examples to help you get started with SciChart. You can download the source for our Xamarin Chart Examples from Github, or browse the source code below.
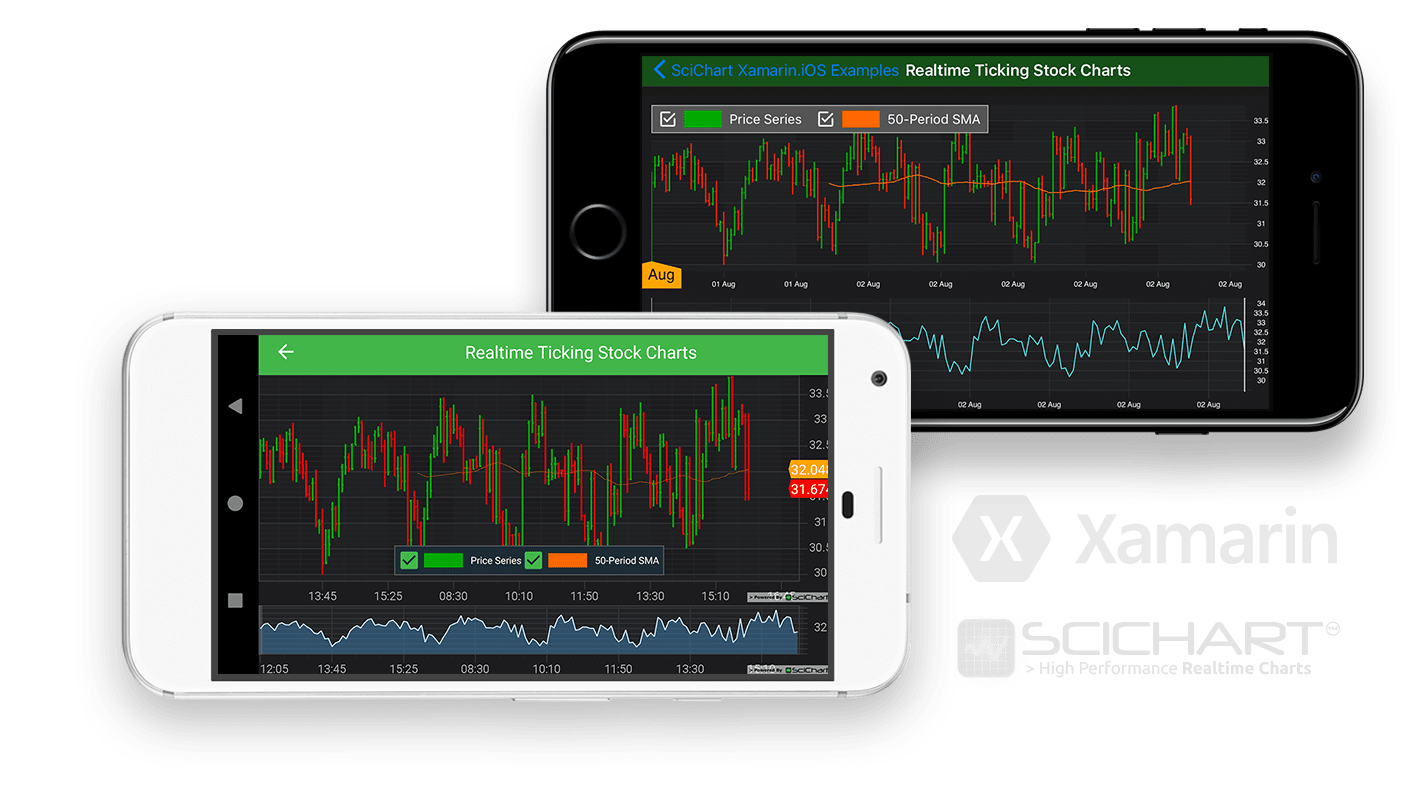
The Xamarin Realtime Ticking Stock Charts example demonstrates how SciChart library is suitable for real-time trading and stock chart apps even in demanding, live markets.
In this example you may see Ohlc or CandleStick charts updating in real-time. There are also two lines showing two moving averages. You may also see annotations used to show the latest prices on the YAxis.
The data updates in real time. In Android native we call OhlcDataSeries.append() and OhlcDataSeries.update() methods, to add new data to the chart when a timer ticks. Scrolling to the latest bar is handled in code by manipulating the XAxis.VisibleRange property.
In iOS native price data is updated in a SCIOhlcDataSeries in a timer callback. When the data updates, SciChart automatically redraws.
See tutorials on how to add realtime updates in Xamarin here:
- Adding realtime updates in Xamarin Android
- Adding realtime updates in Xamarin iOS
Example Usage
- Press the START button to start the real-time update or the PAUSE button to stop it.
- You can freely Pan the chart in horizontal direction even when it’s being updated.
- The X Axis can be dragged to scale the chart in horizontal direction.
- Double-tapping restores zoom level to the extents of the data.
- The Legend can be used to hide or show chart series.

The C#/Xamarin.iOS/Xamarin.Android source code for the Xamarin Realtime Ticking Stock Charts example is included below (Scroll down!).
Did you know you can also view the source code from one of the following sources as well?
- Clone the SciChart.Xamarin.Examples from Github.
- Also, the SciChart for Xamarin Trial contains the full source code for the Xamarin chart examples (link below).
CreateRealtimeTickingStockChartsViewController.cs (Xamarin.iOS)
View source codeCreateRealTimeTickingStockChartFragment.cs (Xamarin.Android)
View source codeusing System;
using System.Linq;
using SciChart.Charting.Model;
using SciChart.Charting.Model.DataSeries;
using SciChart.Charting.Modifiers;
using SciChart.Charting.Visuals;
using SciChart.Charting.Visuals.Axes;
using SciChart.Charting.Visuals.RenderableSeries;
using SciChart.Data.Model;
using SciChart.Drawing.Common;
using Xamarin.Examples.Demo.Data;
using Xamarin.Examples.Demo;
using Xamarin.Examples.Demo.Droid.Extensions;
using Xamarin.Examples.Demo.Droid.Fragments.Base;
using SciChart.Charting.Visuals.Annotations;
using Xamarin.Examples.Demo.Data;
using SciChart.Charting;
using SciChart.Core.Framework;
using Android.Views;
namespace Xamarin.Examples.Demo.Droid.Fragments.Examples
{
[ExampleDefinition("Realtime Ticking Stock Charts", description: "Creates a realtime stock chart which ticks and updates, simulating live a market", icon: ExampleIcon.RealTime)]
public class CreateRealTimeTickingStockChartFragment : ExampleBaseFragment
{
private const int DefaultPointCount = 150;
private const uint SmaSeriesColor = 0xFFFFA500;
private const uint StrokeUpColor = 0xFF00AA00;
private const uint StrokeDownColor = 0xFFFF0000;
private const float StrokeThickness = 1.5f;
// Create data series to hold the data
private readonly OhlcDataSeries<DateTime, double> _ohlcDataSeries = new OhlcDataSeries<DateTime, double> { SeriesName = "Price Series" };
private readonly XyDataSeries<DateTime, double> _xyDataSeries = new XyDataSeries<DateTime, double> { SeriesName = "50-Period SMA" };
private AxisMarkerAnnotation _smaAxisMarker;
private AxisMarkerAnnotation _ohlcAxisMarker;
// Create data service to populate the data
private readonly IMarketDataService _marketDataService = new MarketDataService(new DateTime(2000, 08, 01, 12, 00, 00), 5, 50);
private readonly MovingAverage _sma50 = new MovingAverage(50);
private PriceBar _lastPrice;
public SciChartSurface MainSurface => View.FindViewById<SciChartSurface>(Resource.Id.chart);
public SciChartSurface OverviewSurface => View.FindViewById<SciChartSurface>(Resource.Id.overview);
public override int ExampleLayoutId => Resource.Layout.Example_Real_Time_Ticking_Stock_Chart_Fragment;
protected override void InitExample()
{
InitData(_marketDataService);
CreateMainPriceChart();
BoxAnnotation overviewAnnotation0;
BoxAnnotation overviewAnnotation1;
CreateOverviewChart(out overviewAnnotation0, out overviewAnnotation1);
// Link the main price chart to the second
// On zoom and pan of the main price chart, we want to update
// the position of annotations on the second chart so that you can
// see the area of the data zoomed in (called an 'overview')
((AxisBase)MainSurface.XAxes[0]).VisibleRangeChange += (s, e) =>
{
// Left annotation starts on the left edge of the chart and ends on the right edge of the visible area
overviewAnnotation0.X1Value = OverviewSurface.XAxes[0].VisibleRange.MinAsDouble;
overviewAnnotation0.X2Value = MainSurface.XAxes[0].VisibleRange.MinAsDouble;
// Right annotation starts on the right edge of visible area and ends on the right edge of all the data
overviewAnnotation1.X1Value = MainSurface.XAxes[0].VisibleRange.MaxAsDouble;
overviewAnnotation1.X2Value = OverviewSurface.XAxes[0].VisibleRange.MaxAsDouble;
};
_marketDataService.SubscribePriceUpdate(OnNewPrice);
}
private void InitData(IMarketDataService marketDataService)
{
var prices = marketDataService.GetHistoricalData(DefaultPointCount);
_lastPrice = prices.Last();
// Populate data series with some data
_ohlcDataSeries.Append(prices.Select(x => x.DateTime),
prices.Select(x => x.Open),
prices.Select(x => x.High),
prices.Select(x => x.Low),
prices.Select(x => x.Close));
_xyDataSeries.Append(prices.Select(x => x.DateTime), prices.Select(y => _sma50.Push(y.Close).Current));
}
private void CreateMainPriceChart()
{
// Create an XAxis and YAxis for our chart
var xAxis = new CategoryDateAxis(Activity)
{
BarTimeFrame = TimeSpan.FromMinutes(5).TotalSeconds,
DrawMajorGridLines = false,
GrowBy = new DoubleRange(0, 0.1)
};
var yAxis = new NumericAxis(Activity) { AutoRange = AutoRange.Always };
// Create RenderableSeries to render the data
var ohlcSeries = new FastOhlcRenderableSeries
{
DataSeries = _ohlcDataSeries,
StrokeUpStyle = new SolidPenStyle(StrokeUpColor, StrokeThickness.ToDip(Activity)),
StrokeDownStyle = new SolidPenStyle(StrokeDownColor, StrokeThickness.ToDip(Activity)),
};
var movingAverage50Series = new FastLineRenderableSeries { DataSeries = _xyDataSeries, StrokeStyle = new SolidPenStyle(0xFFFF6600, 1.0f) };
// Create axis markers annotations to show the last values on real-time chart
_smaAxisMarker = new AxisMarkerAnnotation(Activity) { Y1Value = 0d };
_smaAxisMarker.SetBackgroundColor(SmaSeriesColor.ToAndroidColor());
_ohlcAxisMarker = new AxisMarkerAnnotation(Activity) { Y1Value = 0d };
_ohlcAxisMarker.SetBackgroundColor(StrokeUpColor.ToAndroidColor());
// Populate the chart with Axis, RenderableSeries. The chart automatically updates when any property changes
using (MainSurface.SuspendUpdates())
{
MainSurface.XAxes.Add(xAxis);
MainSurface.YAxes.Add(yAxis);
MainSurface.RenderableSeries.Add(ohlcSeries);
MainSurface.RenderableSeries.Add(movingAverage50Series);
MainSurface.Annotations.Add(_ohlcAxisMarker);
MainSurface.Annotations.Add(_smaAxisMarker);
// Populate some pinch and touch interactions. Pinch to zoom, drag to pan and double-tap to zoom extents
MainSurface.ChartModifiers = new ChartModifierCollection
{
new XAxisDragModifier(),
new ZoomPanModifier{ Direction = Direction2D.XDirection, ReceiveHandledEvents = true },
new ZoomExtentsModifier(),
new LegendModifier(Activity) { ReceiveHandledEvents = true }.WithOrientation(Orientation.Horizontal).WithPosition(GravityFlags.CenterHorizontal | GravityFlags.Bottom, 20),
};
}
}
private void CreateOverviewChart(out BoxAnnotation leftAreaAnnotation, out BoxAnnotation rightAreaAnnotation)
{
// Create an XAxis and YAxis for our chart
var xAxis1 = new CategoryDateAxis(Activity) { AutoRange = AutoRange.Always };
var yAxis1 = new NumericAxis(Activity) { GrowBy = new DoubleRange(0.1, 0.1), AutoRange = AutoRange.Always };
// Create the mountain chart for the overview , using the same price data but zoomed out
var mountainSeries = new FastMountainRenderableSeries { DataSeries = _ohlcDataSeries };
// Create some annotations to visualize the selected area on the main price chart
leftAreaAnnotation = new BoxAnnotation(Activity)
{
CoordinateMode = AnnotationCoordinateMode.RelativeY,
Y1Value = 0,
Y2Value = 1,
Background = Activity.GetDrawableCompat(Resource.Drawable.example_gray_box_annotation_background)
};
rightAreaAnnotation = new BoxAnnotation(Activity)
{
CoordinateMode = AnnotationCoordinateMode.RelativeY,
Y1Value = 0,
Y2Value = 1,
Background = Activity.GetDrawableCompat(Resource.Drawable.example_gray_box_annotation_background)
};
// Populate the chart with Axis, RenderableSeries. The chart automatically updates when any property changes
using (OverviewSurface.SuspendUpdates())
{
OverviewSurface.XAxes.Add(xAxis1);
OverviewSurface.YAxes.Add(yAxis1);
OverviewSurface.RenderableSeries.Add(mountainSeries);
OverviewSurface.Annotations.Add(leftAreaAnnotation);
OverviewSurface.Annotations.Add(rightAreaAnnotation);
}
}
private void OnNewPrice(PriceBar price)
{
// Update the last price, or append?
double smaLastValue;
if (_lastPrice.DateTime == price.DateTime)
{
_ohlcDataSeries.Update(_ohlcDataSeries.Count - 1, price.Open, price.High, price.Low, price.Close);
smaLastValue = _sma50.Update(price.Close).Current;
_xyDataSeries.UpdateYAt(_xyDataSeries.Count - 1, smaLastValue);
}
else
{
_ohlcDataSeries.Append(price.DateTime, price.Open, price.High, price.Low, price.Close);
smaLastValue = _sma50.Push(price.Close).Current;
_xyDataSeries.Append(price.DateTime, smaLastValue);
// If the latest appending point is inside the viewport (i.e. not off the edge of the screen)
// then scroll the viewport 1 bar, to keep the latest bar at the same place
var visibleRange = MainSurface.XAxes[0].VisibleRange;
if (visibleRange.MaxAsDouble > _ohlcDataSeries.Count)
{
visibleRange.SetMinMaxDouble(visibleRange.MinAsDouble + 1, visibleRange.MaxAsDouble + 1);
}
}
Activity.RunOnUiThread(() =>
{
_ohlcAxisMarker.SetBackgroundColor((price.Close >= price.Open ? StrokeUpColor : StrokeDownColor).ToAndroidColor());
});
_ohlcAxisMarker.Y1Value = price.Close;
_smaAxisMarker.Y1Value = smaLastValue;
_lastPrice = price;
}
public override void OnStop()
{
base.OnStop();
_marketDataService.ClearSubscriptions();
}
public override void InitExampleForUiTest()
{
base.InitExampleForUiTest();
_marketDataService.ClearSubscriptions();
_xyDataSeries.Clear();
_ohlcDataSeries.Clear();
_sma50.Clear();
_lastPrice = default(PriceBar);
var marketDataService = new MarketDataService(new DateTime(2000, 08, 01, 12, 00, 00), 5, 20);
// add initizal data
InitData(marketDataService);
// perform zoom extents to restore default VisibleRange
MainSurface.ZoomExtentsX();
// add one price bar to update location of annotations
OnNewPrice(marketDataService.GetNextBar());
}
}
}