 View on GitHub
iOS & macOS Charting Documentation - SciChart iOS & macOS Charts SDK v4.x
SciChart macOS examples Suite
Are you new to SciChart?
We have created a rich interactive examples application demo to showcase the SciChart macOS features and as well as the flexibility of our API. SciChart provides macOS native examples application demo. We also believe this application will be a good learning tool, where each little simple example will teach you piece by piece how to use the library to achieve what you need to do.
The Demo application contains:
- Approximately 80+ Rich of macOS native examples showcasing the features of SciChart macOS Charts;
- Search keying on a tag, example title, description, and source code;
- View source in the example application and links to GitHub.
How to get the demo app
Simply download it to your phone from the Mac App Store and you are ready to go, view search, and browse through examples.
If you want to run it yourself and play around with code right away you can
- Download zipped archive from our web resource at downloads
- Clone the SciChart macOS Examples from our Github repository.
Build and Run the Demo
To run the demo yourself you will need to do a couple of simple steps:
- Setup the XCode project and integrate SciChart Framework, please see the first paragraphs in “Creating your First App” if you need help.
- Set the (trial) licenses key and your key can be found at your profile page.
- Just do the ⌘ + B and ⌘ + R commands to run it.
If everything is ok this is what you should see the following:
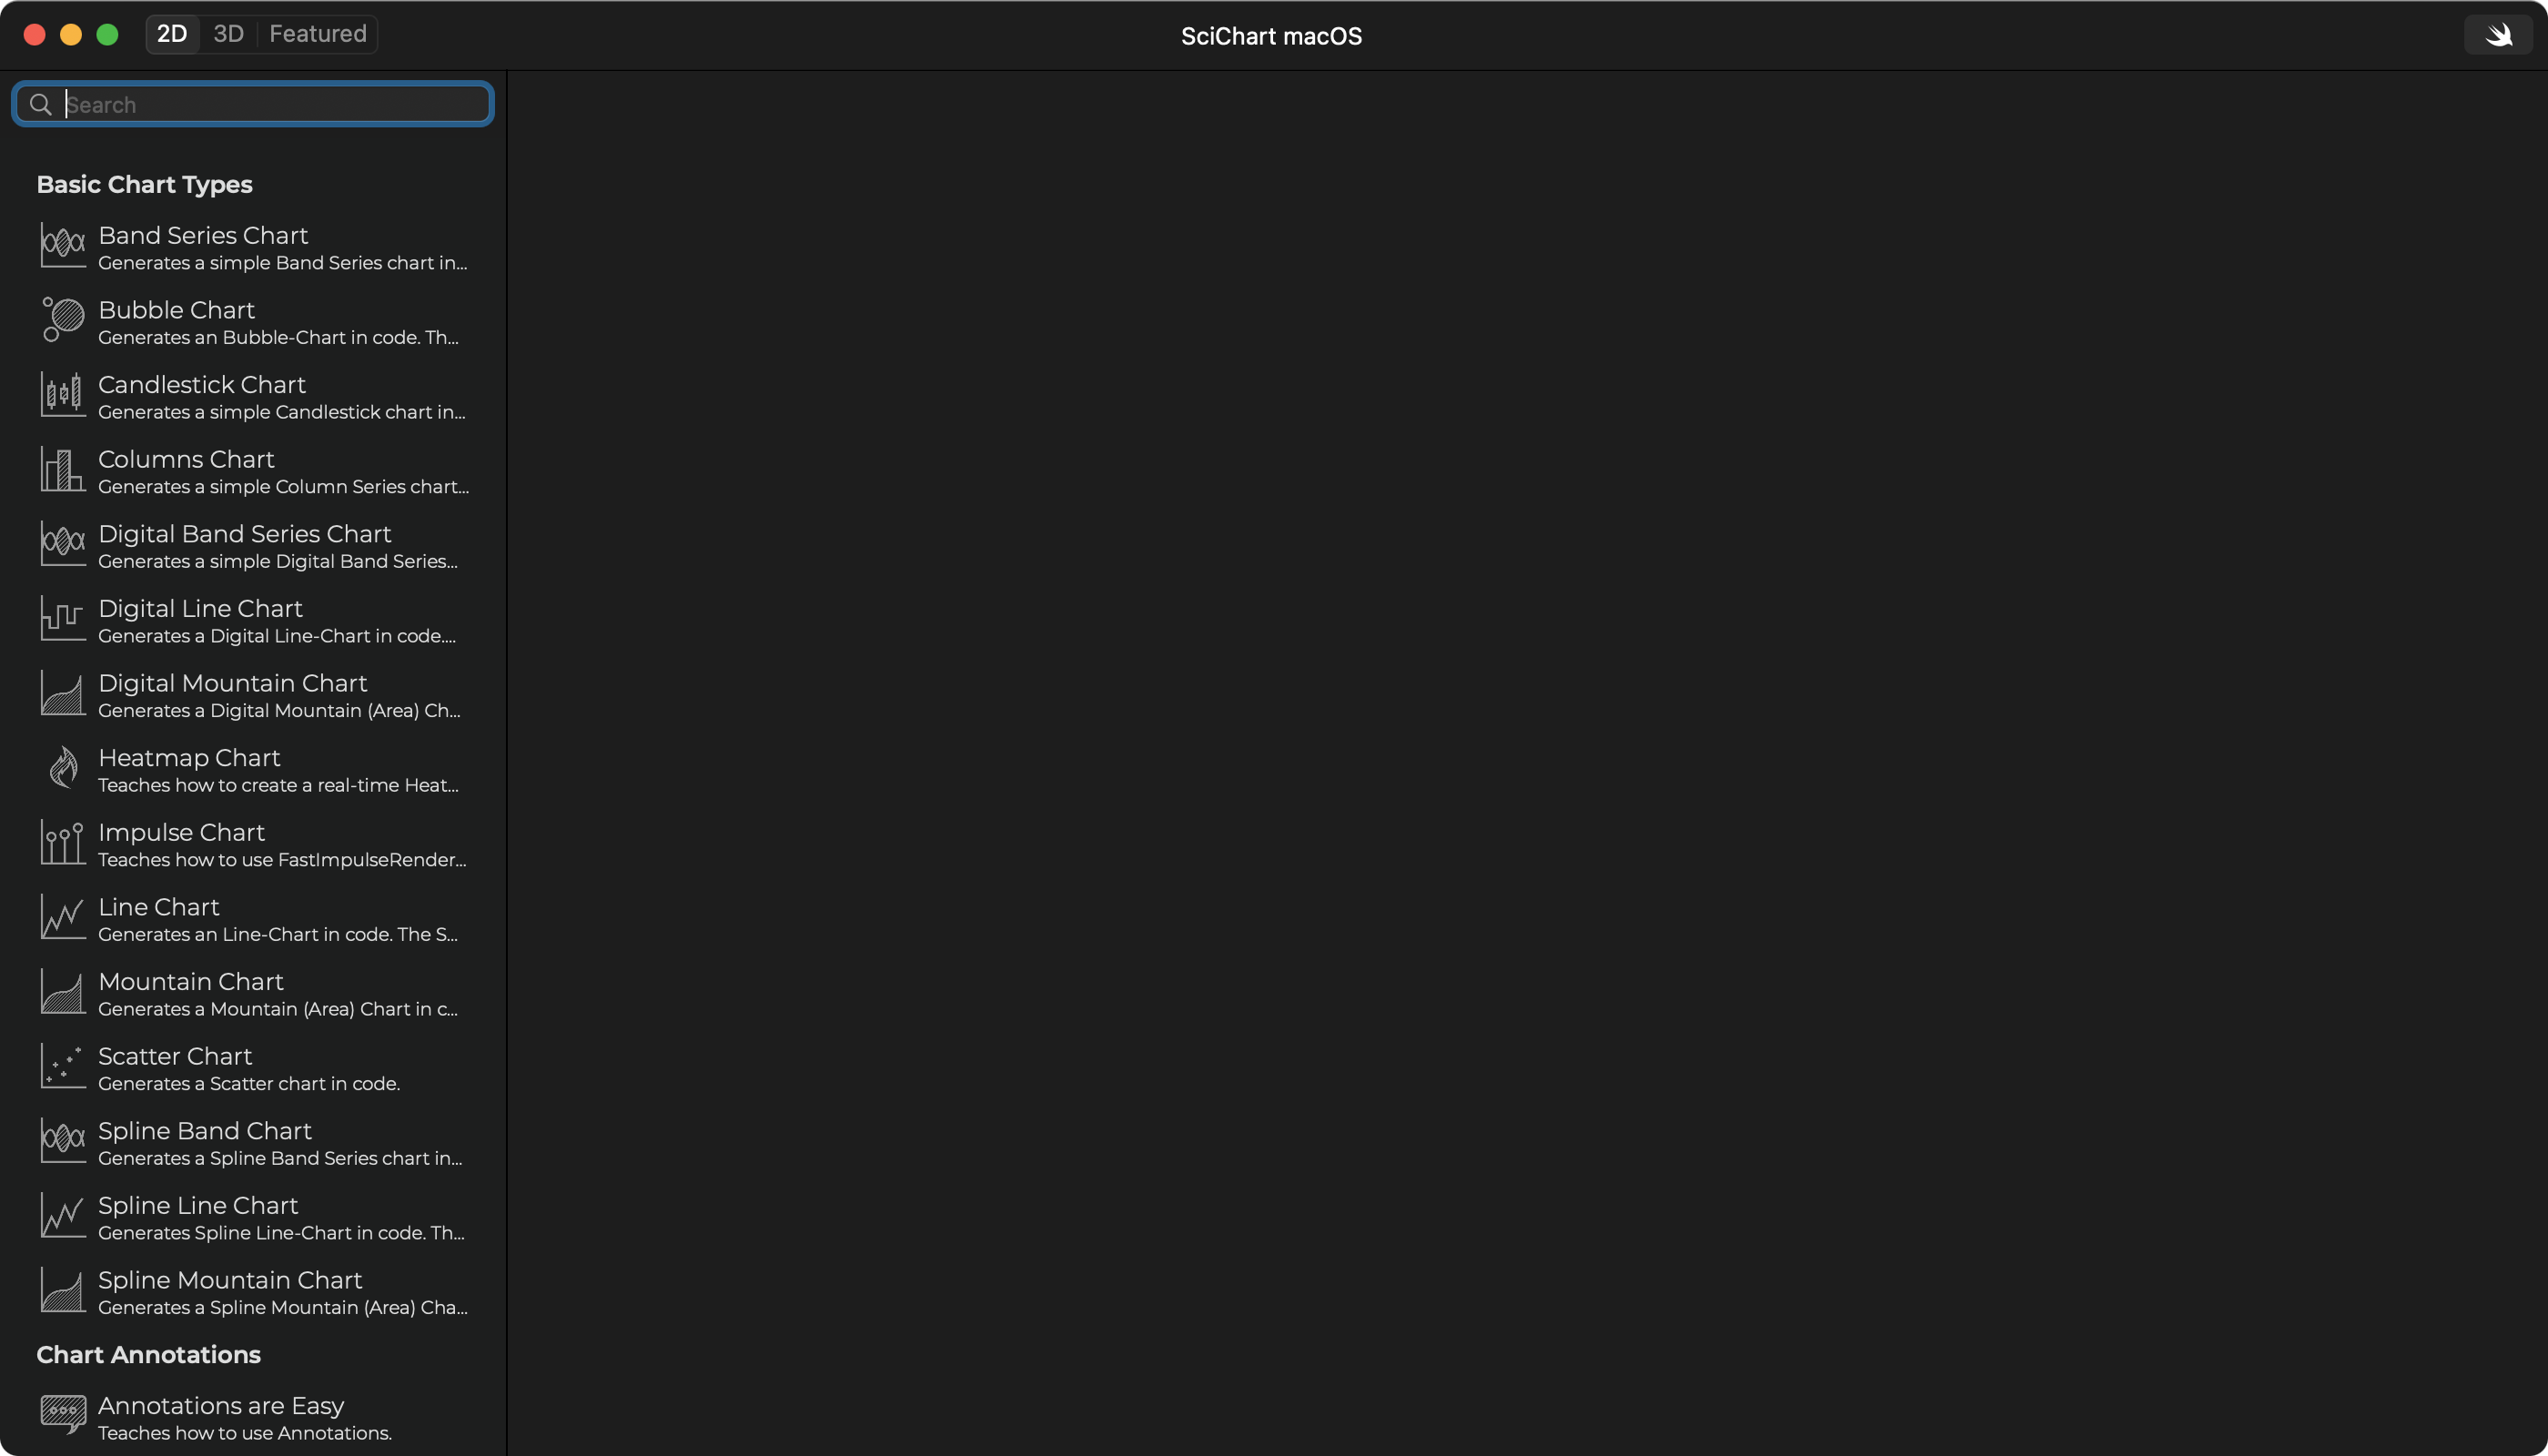
Now you can navigate through the Examples Suite! The application itself has a lot of useful features for you. You can not only take a look at each particular example, but also see its code, and configure the example.
Navigating the SciChart macOS Examples Suite
The SciChart macOS Examples Suite showcases the features of SciChart’s macOS Chart Control in an easy to navigate application that runs on your Mac.
All examples are grouped into three main categories. Those are 2D charts, 3D charts and Featured Apps. Each of these is further divided into categories by features or actions you might want to implement. For example:
| Category | Example | Description |
|---|---|---|
| 2D -> Basic Chart Types | Line Chart, Column Charts, Mountain Charts, etc. | Really simple examples, showing how to create the different chart types |
| 3D -> Axes | Date Axis 3D, Logarithmic Axis 3D | Shows how to add a specific axis to the 3D view of the chart. |
| Extra Features | Real-time Oscilloscope, Multiple Axes, Multiple Surfaces | Shows a bit more complex combinations of features and functionality. |
What else is in the Demo App
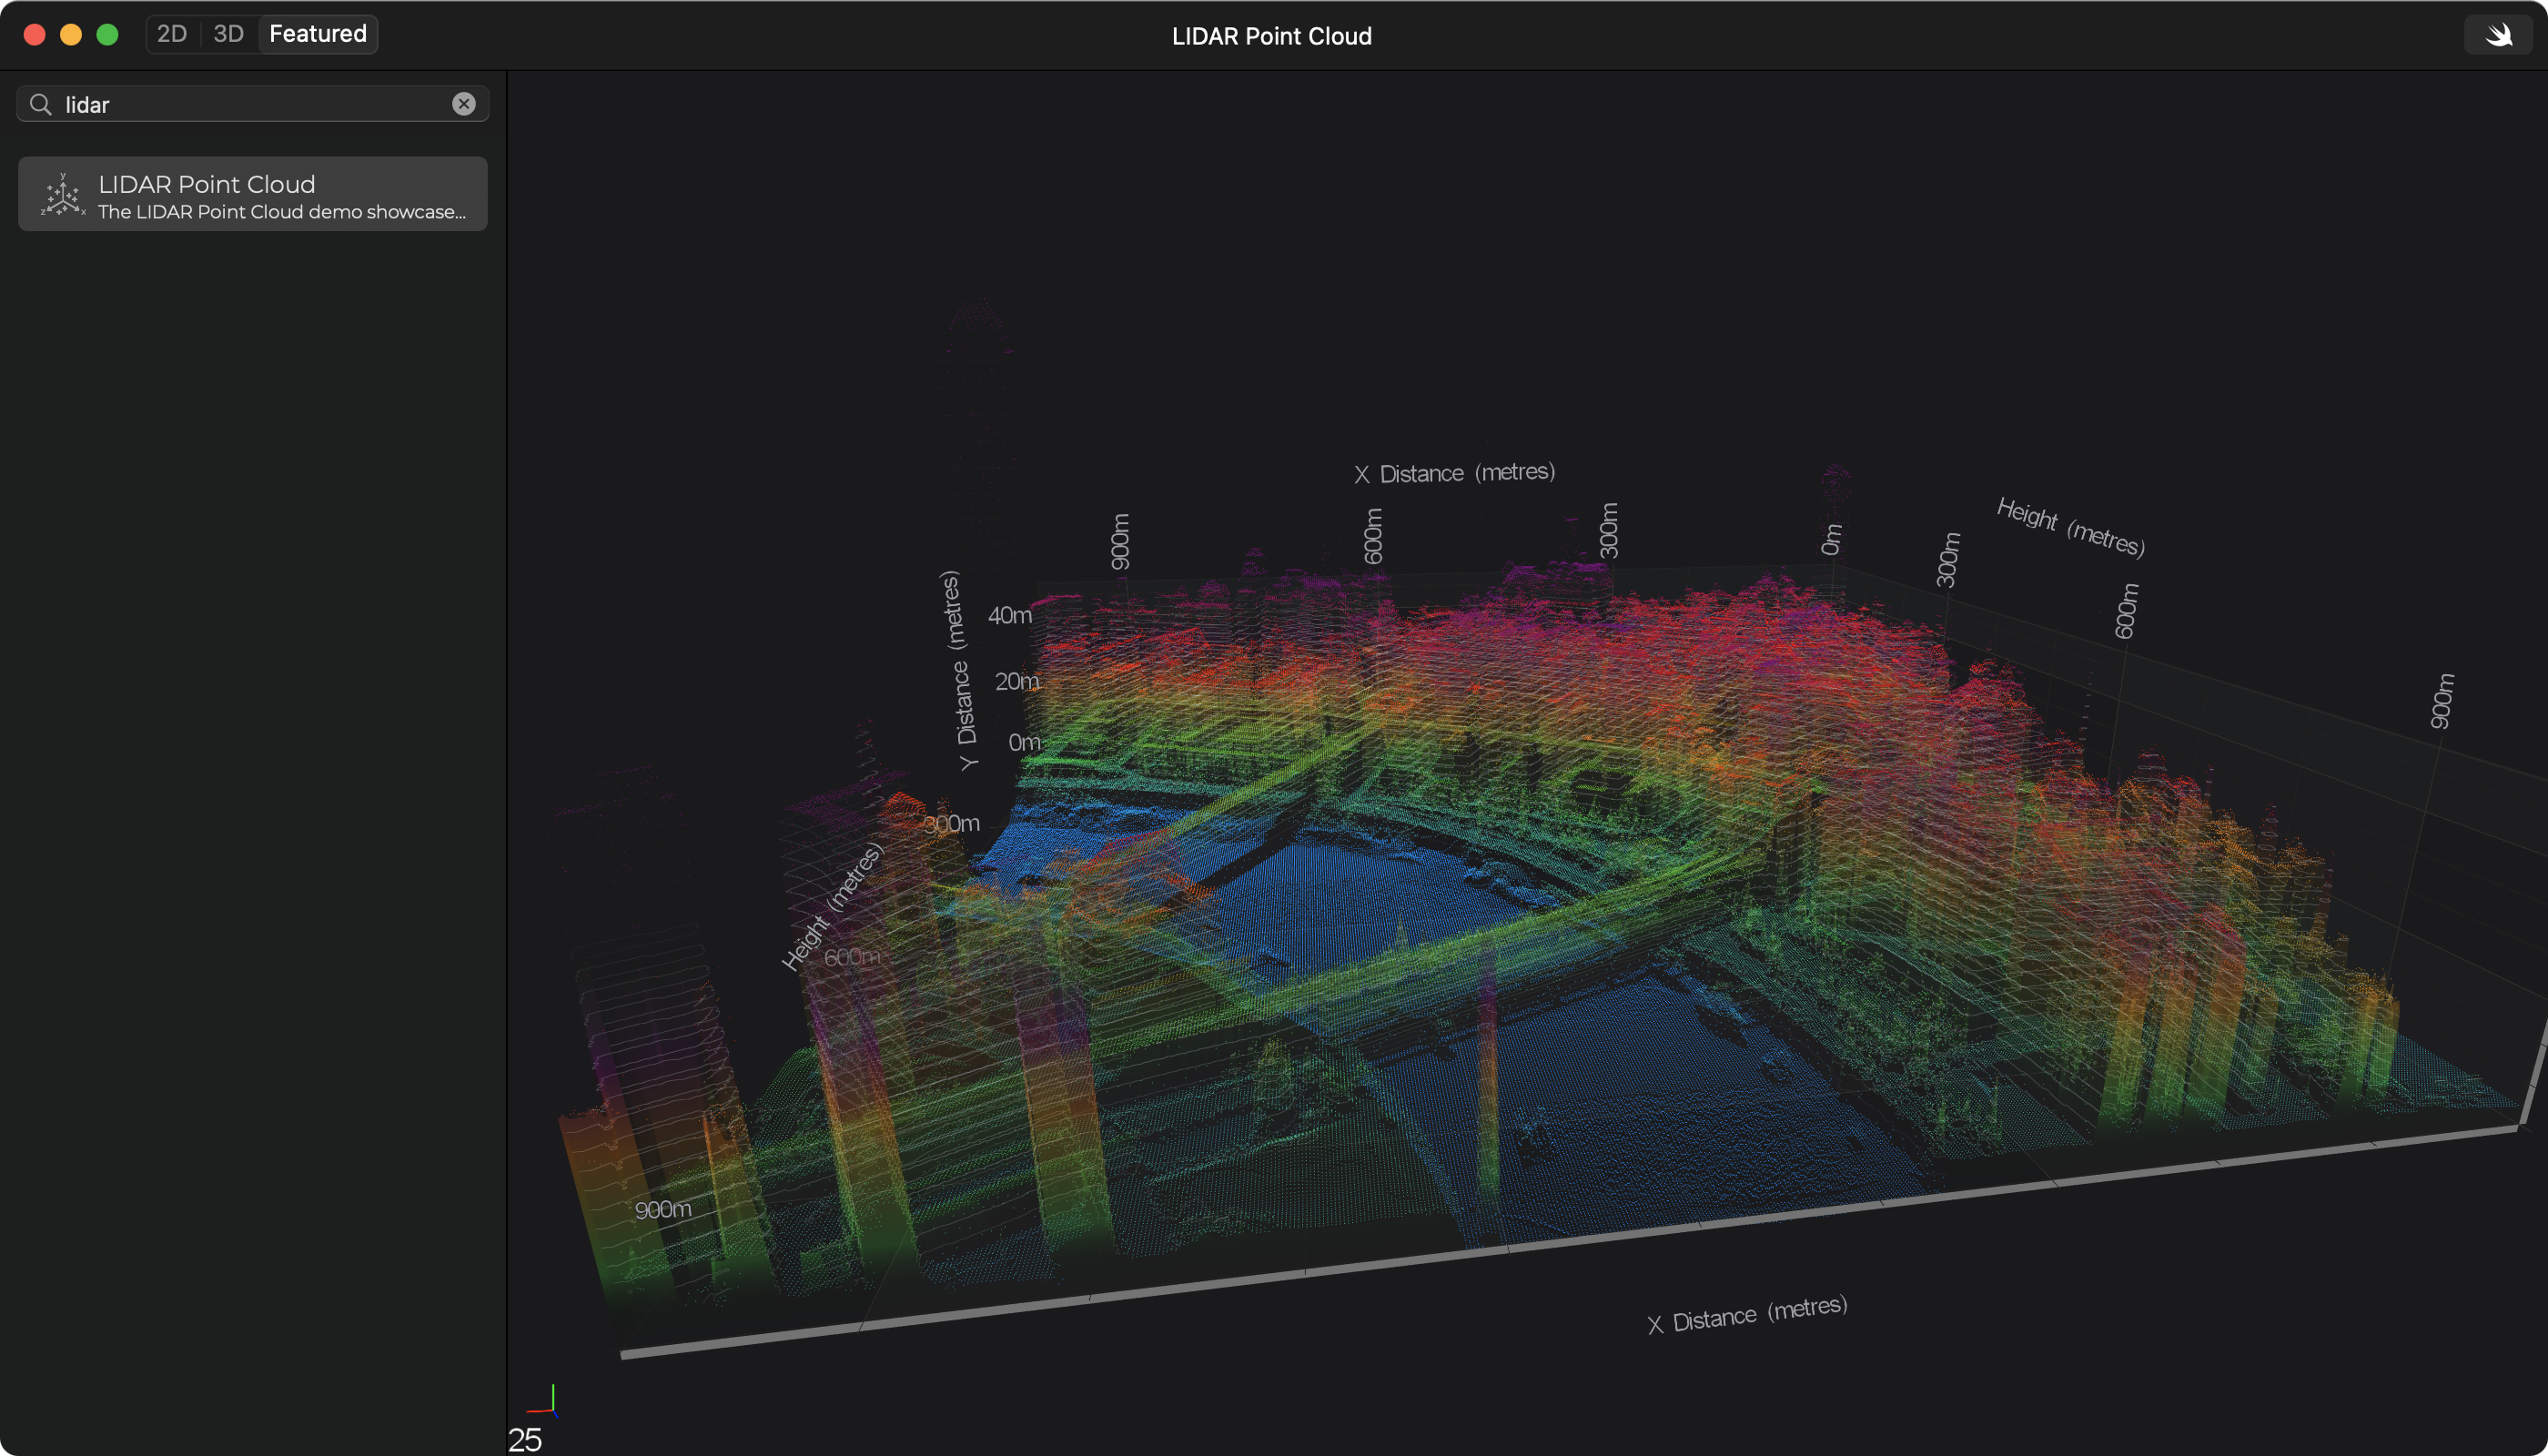
The menu at the top allows you to go back home if you wish to choose a different category. You may also search for an example by the keywords throughout the whole application.
In the top right corner, you can see a “Swift” button, which allows you to switch the language from Objective-C to SWIFT in runtime.
Here we have opened the LIDAR Point Cloud as an example. And there are many more examples in the demo application. Have a look for yourself!
Our website also has the full list of macOS Examples for your convenience.
Wish you have a great experience! We are always looking for your feedback!
See Also
https://www.scichart.com/documentation/ios/current/creating-your-first-scichart-macos-app.html https://www.scichart.com/documentation/ios/current/scichart-v4-migration-guide.html