NOTE: The xAxisId and yAxisId must be supplied if you have axis with non-default Axis Ids, e.g. in multi-axis scenario.
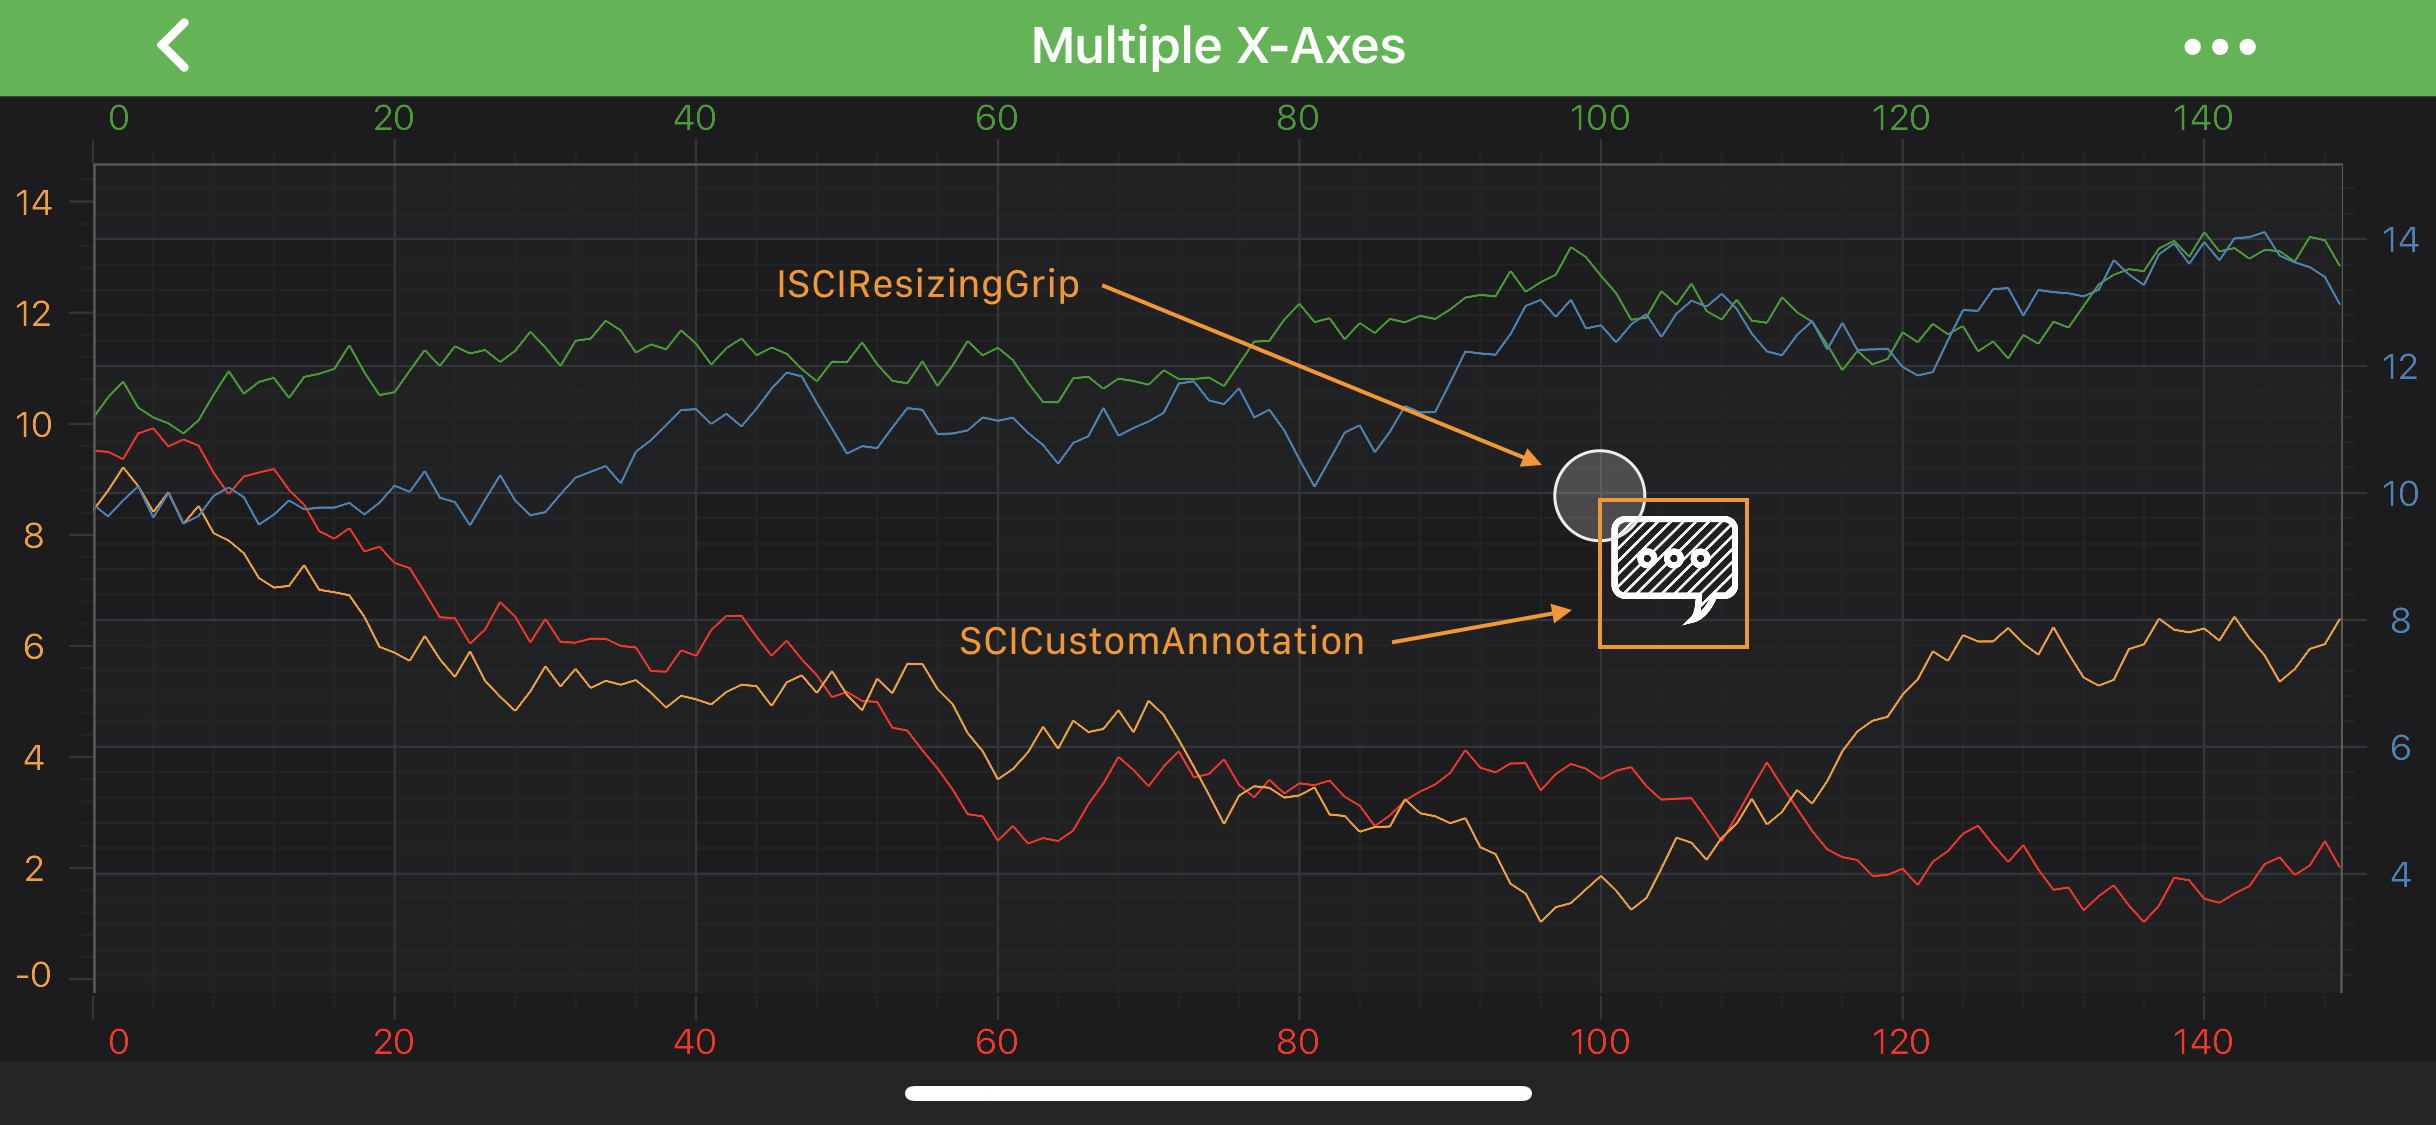
Also, because SCICustomAnnotation is derived from the SCIAnchorPointAnnotation it can be aligned relative to the X1 or Y1 coordinate by setting the Anchor Points. For more information about the Anchor Points - refer to the corresponding section Annotations APIs article.
// Assume a surface has been created and configured somewhere
id<ISCIChartSurface> surface;
// Prepare UIImageView for the CustomAnnotation
UIImageView *imageView = [[UIImageView alloc] initWithImage:[UIImage imageNamed:@“chart.annotation”]];
imageView.frame = CGRectMake(0, 0, 50, 50);
imageView.tintColor = UIColor.whiteColor;
// Create SCICustomAnnotation instance
SCICustomAnnotation *customAnnotation = [SCICustomAnnotation new];
// Supply it with UIImageView
customAnnotation.customView = imageView;
// Specify a desired position
customAnnotation.x1 = @(10);
customAnnotation.y1 = @(10);
// Allow to interact with the annotation in run-time
customAnnotation.isEditable = YES;
// In a multi-axis scenario, specify the XAxisId and YAxisId
customAnnotation.xAxisId = BottomAxisId;
customAnnotation.yAxisId = LeftAxisId;
// Add the annotation to the Annotations collection of the surface
[self.surface.annotations add:customAnnotation];
// Assume a surface has been created and configured somewhere
let surface: ISCIChartSurface
// Prepare UIImageView for the CustomAnnotation
let imageView = UIImageView(image:#imageLiteral(resourceName: “chart.annotation.png”))
imageView.frame = CGRect(origin: .zero, size: CGSize(width: 50, height: 50))
imageView.tintColor = .white
// Create SCICustomAnnotation instance
let customAnnotation = SCICustomAnnotation()
// Supply it with UIImageView
customAnnotation.customView = imageView
// Specify a desired position
customAnnotation.set(x1: 10)
customAnnotation.set(y1: 10)
// Allow to interact with the annotation in run-time
customAnnotation.isEditable = true
// In a multi-axis scenario, specify the XAxisId and YAxisId
customAnnotation.xAxisId = BottomAxisId
customAnnotation.yAxisId = LeftAxisId
// Add the annotation to the Annotations collection of the surface
self.surface.annotations.add(customAnnotation)
// Assume a surface has been created and configured somewhere
IISCIChartSurface surface;
// Prepare UIImageView for the CustomAnnotation
var imageView = new UIImageView(new UIImage(“chart.annotation.png”));
imageView.Frame = new CGRect(CGPoint.Empty, new CGSize(50, 50));
imageView.TintColor = UIColor.White;
// Create SCICustomAnnotation instance
var customAnnotation = new SCICustomAnnotation();
// Supply it with UIImageView
customAnnotation.CustomView = imageView;
// Specify a desired position
customAnnotation.X1Value = 10;
customAnnotation.Y1Value = 10;
// Allow to interact with the annotation in run-time
customAnnotation.IsEditable = true;
// In a multi-axis scenario, specify the XAxisId and YAxisId
customAnnotation.XAxisId = BottomAxisId;
customAnnotation.YAxisId = LeftAxisId;
// Add the annotation to the Annotations collection of the surface
Surface.Annotations.Add(customAnnotation);
NOTE: To learn more about other Annotation Types, available out of the box in SciChart, please find the comprehensive list in the Annotation APIs article.
 View on GitHub