 View on GitHub
iOS & macOS Charting Documentation - SciChart iOS & macOS Charts SDK v4.x
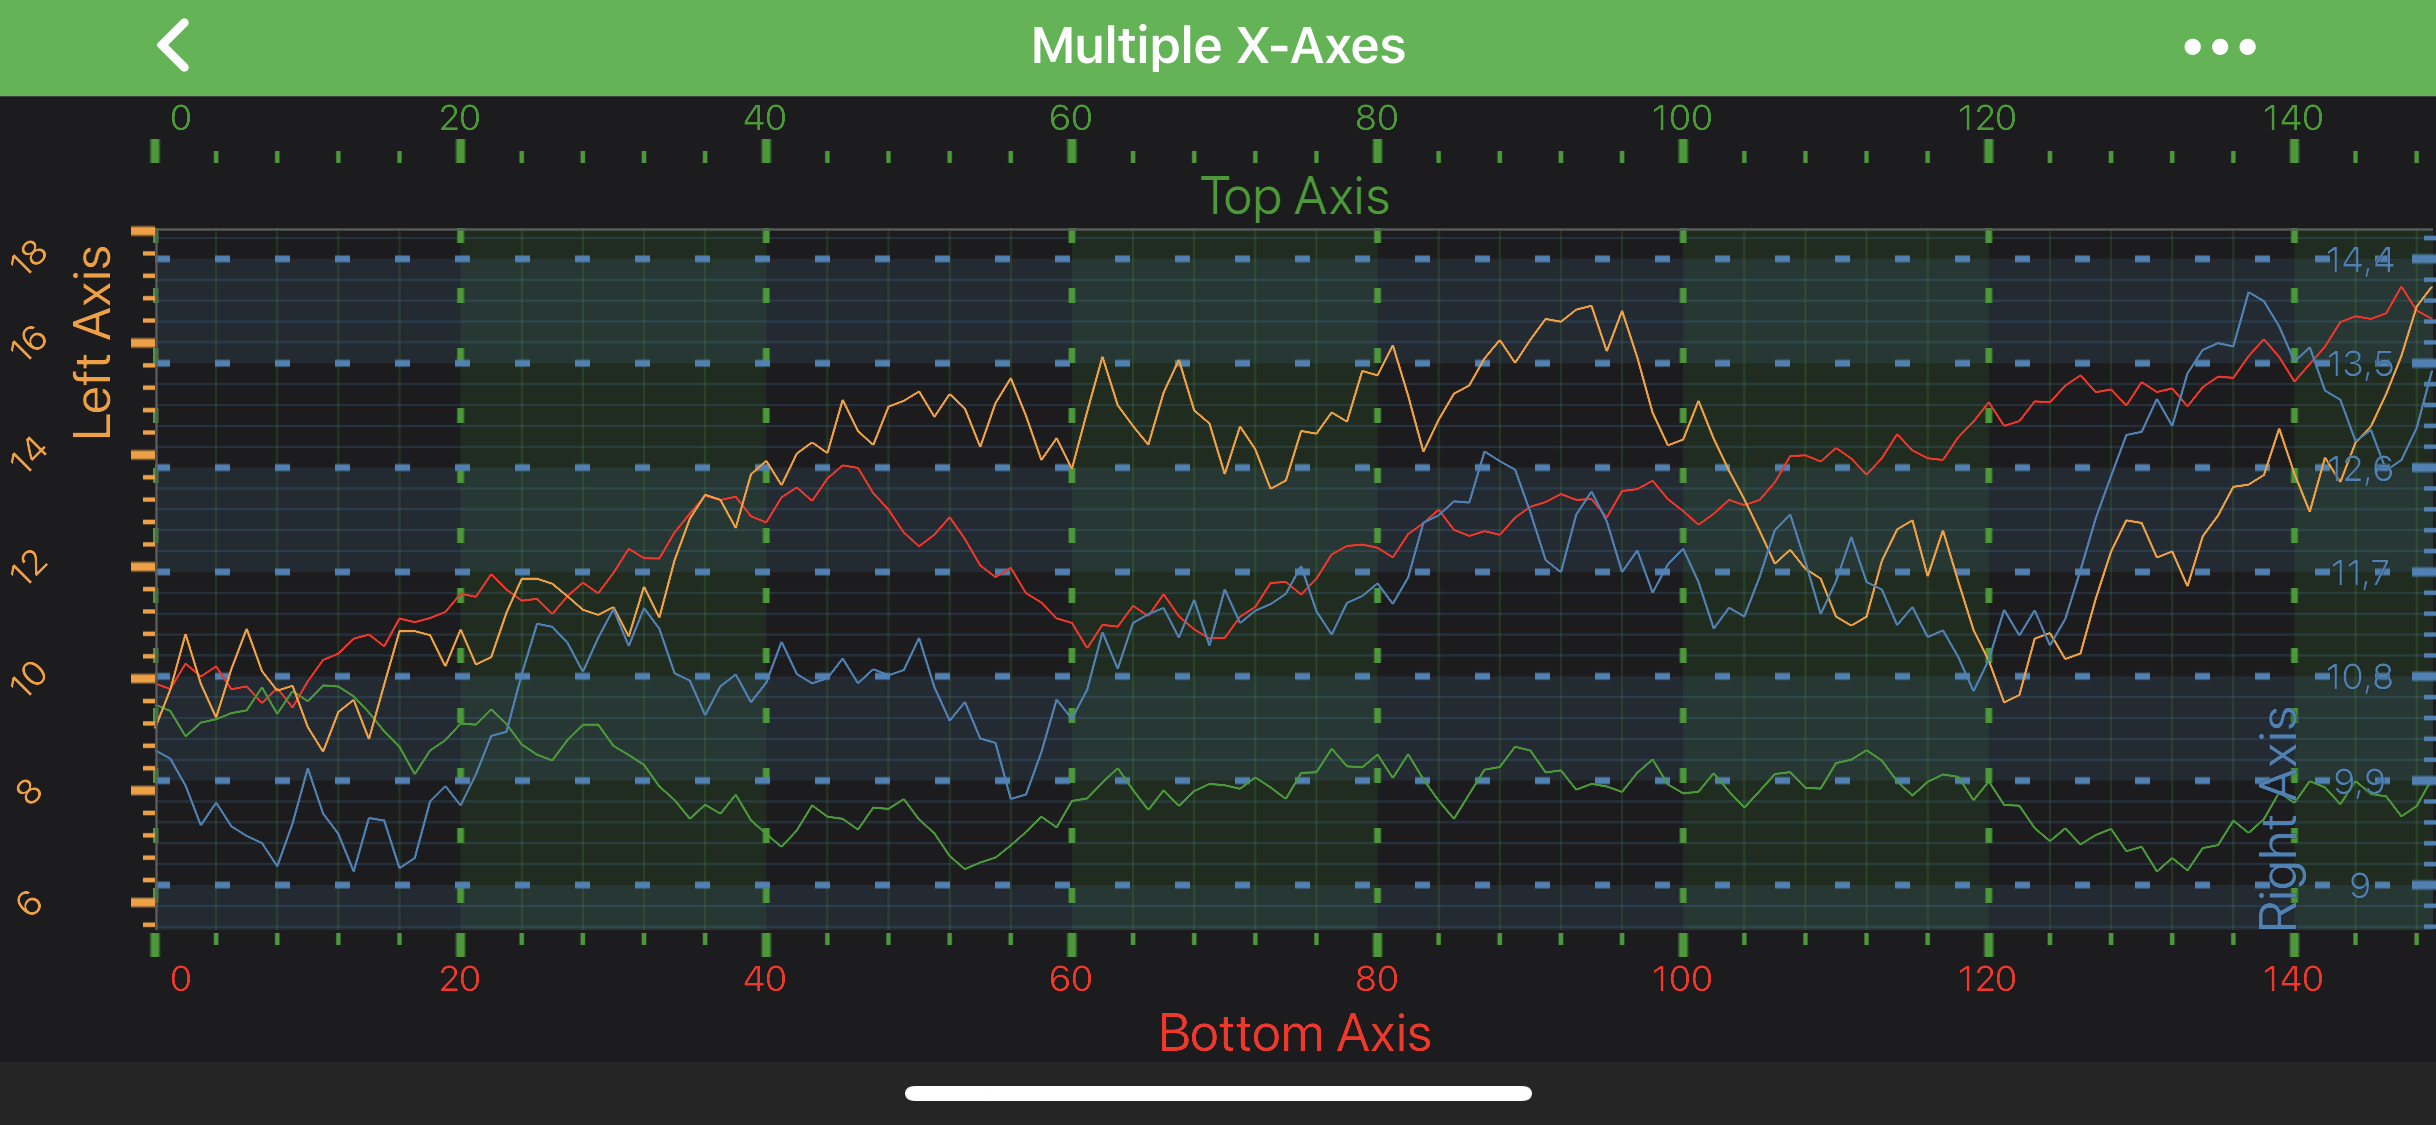
Axis Styling - Grid Lines, Ticks and Axis Bands
As mentioned in previous article on Axis Styling - Title and Labels - each and every aspect of the axis can be styled. The Axis is responsible for drawing the following parts:
- Title
- Axis Labels
- Tick Lines - small marks on the outside of an axis next to labels
- Grid Lines - major and minor
- Axis Bands - shading between the major grid-lines
In this article we are going to focus on Tick Lines, Gridlines and Axis Bands styling. So let’s pick up where we left off in previous article and proceed with some styling.
NOTE: It’s important to mention, that
X-Axisis responsible for vertical grid-lines and bands, whereasY-Axis- for horizontal ones.
NOTE: In SciChart, almost all styling methods expect an instance of either
SCIPenStyleorSCIBrushStyleto be passed in. Those that deals with text styling, expect an instance of aSCIFontStyle. To learn more about how to utilize them, please refer to the SCIPenStyle, SCIBrushStyle and SCIFontStyle article.
Axis Ticks
Axis Ticks can be styled via applying the SCIPenStyle onto the ISCIAxisCore.minorTickLineStyle property to affect Minor ticks, or onto the ISCIAxisCore.majorTickLineStyle - for the Major ticks. Ticks Length can also be controlled via ISCIAxisCore.majorTickLineLength and ISCIAxisCore.minorTickLineLength properties.
Also, ticks can be completely hidden or shown on an axis via the ISCIAxisCore.drawMinorTicks and ISCIAxisCore.drawMajorTicks properties.
Grid Lines
Grid Lines are styled the same way as Axis ticks - use the following properties to affect gridlines rendering:
ISCIAxisCore.drawMajorGridLinesISCIAxisCore.drawMinorGridLinesISCIAxisCore.majorGridLineStyleISCIAxisCore.minorGridLineStyle
Axis Bands
The colored strips between Major grid lines are called Axis Bands. They can be made visible or hidden via the ISCIAxisCore.drawMajorBands property. The fill can be changed via the ISCIAxisCore.axisBandsStyle property, that expects a SCIBrushStyle: