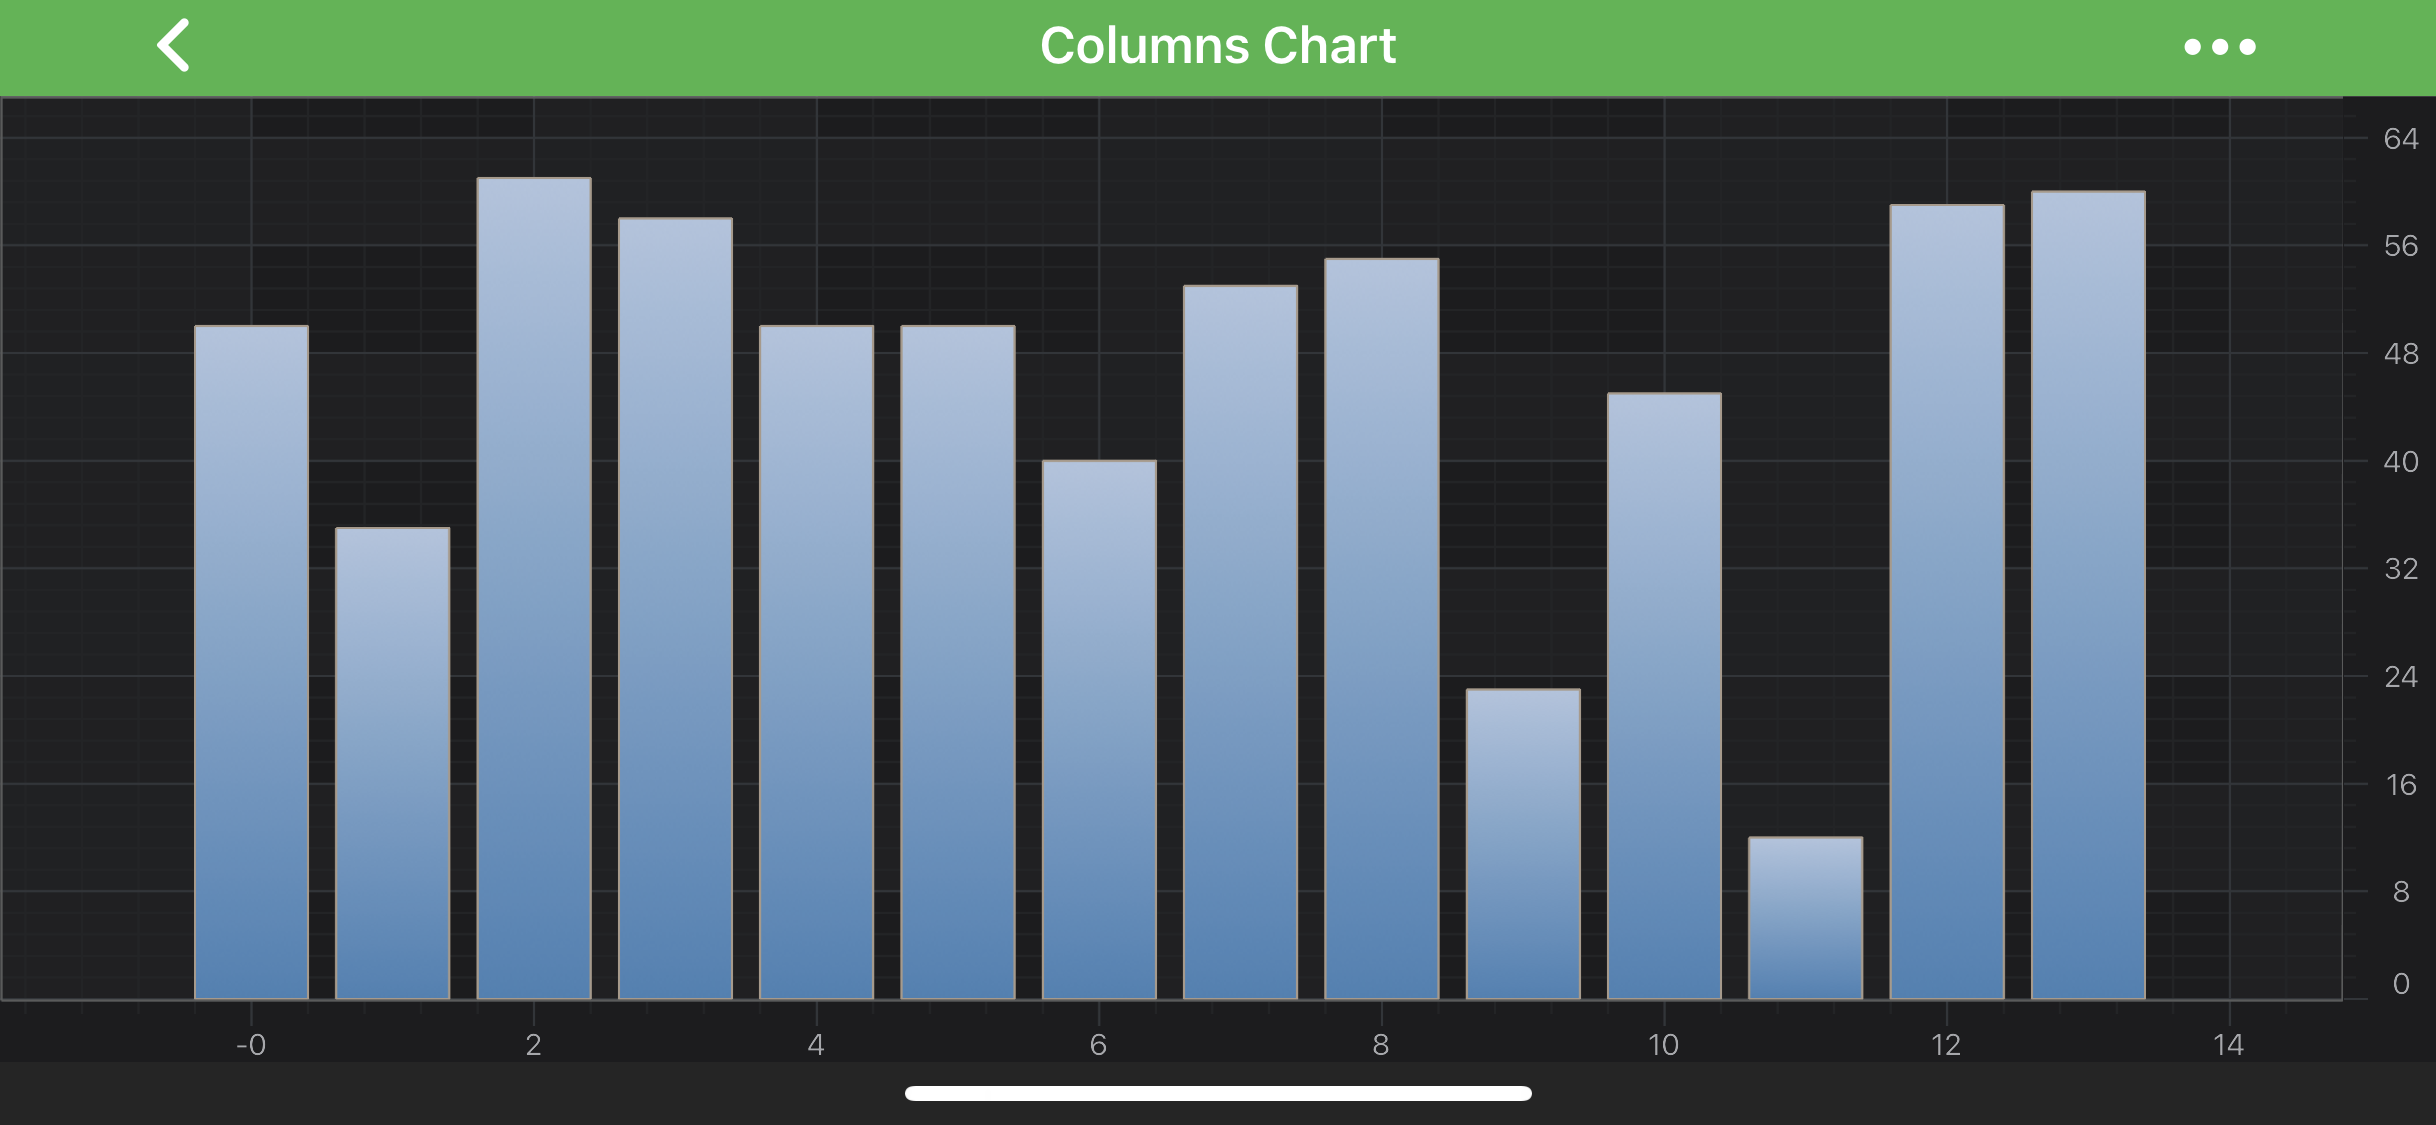
The SCIFastColumnRenderableSeries class allows to specify Fill brush, Stroke pen and relative DataPointWidth which will be applied to every column. You can also choose the SCITextureMappingMode for Fill brush which defines how columns are filled when a gradient is used. The DataPointWidth specifies how much space a single column occupies, varying from 0 to 1 (when columns are conjoined).
Also, it is possible to define the ZeroLineY baseline position via the SCIRenderableSeriesBase.zeroLineY property. All data points that have Y value less than ZeroLineY will appear downward, else - upward.
All those values can be assigned via the corresponding properties:
To create a Column Series, use the following code:
// Assume a surface has been created and configured somewhere
id<ISCIChartSurface> surface;
// Create DataSeries and fill it with some data
SCIXyDataSeries *dataSeries = [[SCIXyDataSeries alloc] initWithXType:SCIDataType_Double yType:SCIDataType_Double];
// Create and add Mountain Series
id<ISCIRenderableSeries> columnSeries = [SCIFastColumnRenderableSeries new];
columnSeries.dataSeries = dataSeries;
columnSeries.strokeStyle = [[SCISolidPenStyle alloc] initWithColorCode:0xFFA99A8A thickness:1.0];
columnSeries.fillBrushStyle = [[SCILinearGradientBrushStyle alloc] initWithStart:CGPointMake(0, 0) end:CGPointMake(0, 1) startColorCode:0xFF4682B4 endColorCode:0xFFB0C4DE];
[surface.renderableSeries add:columnSeries];
// Assume a surface has been created and configured somewhere
let surface: ISCIChartSurface
// Create DataSeries and fill it with some data
let dataSeries = SCIXyDataSeries(xType: .double, yType: .double)
// Create and add Mountain Series
let columnSeries = SCIFastColumnRenderableSeries()
columnSeries.dataSeries = dataSeries
columnSeries.strokeStyle = SCISolidPenStyle(colorCode: 0xFFA99A8A, thickness: 1)
columnSeries.fillBrushStyle = SCILinearGradientBrushStyle(start: CGPoint(x: 0, y: 0), end: CGPoint(x: 0, y: 1), startColorCode: 0xFF4682B4, endColorCode: 0xFFB0C4DE)
surface.renderableSeries.add(columnSeries)
// Assume a surface has been created and configured somewhere
IISCIChartSurface surface;
// Create DataSeries and fill it with some data
var dataSeries = new XyDataSeries<double, double>();
// Create and add Mountain Series
var columnSeries = new SCIFastColumnRenderableSeries();
columnSeries.DataSeries = dataSeries;
columnSeries.StrokeStyle = new SCISolidPenStyle(0xFFA99A8A, 1f);
columnSeries.FillBrushStyle = new SCILinearGradientBrushStyle(new CGPoint(0, 0), new CGPoint(0, 1), 0xFF4682B4, 0xFFB0C4DE);
surface.RenderableSeries.Add(columnSeries);
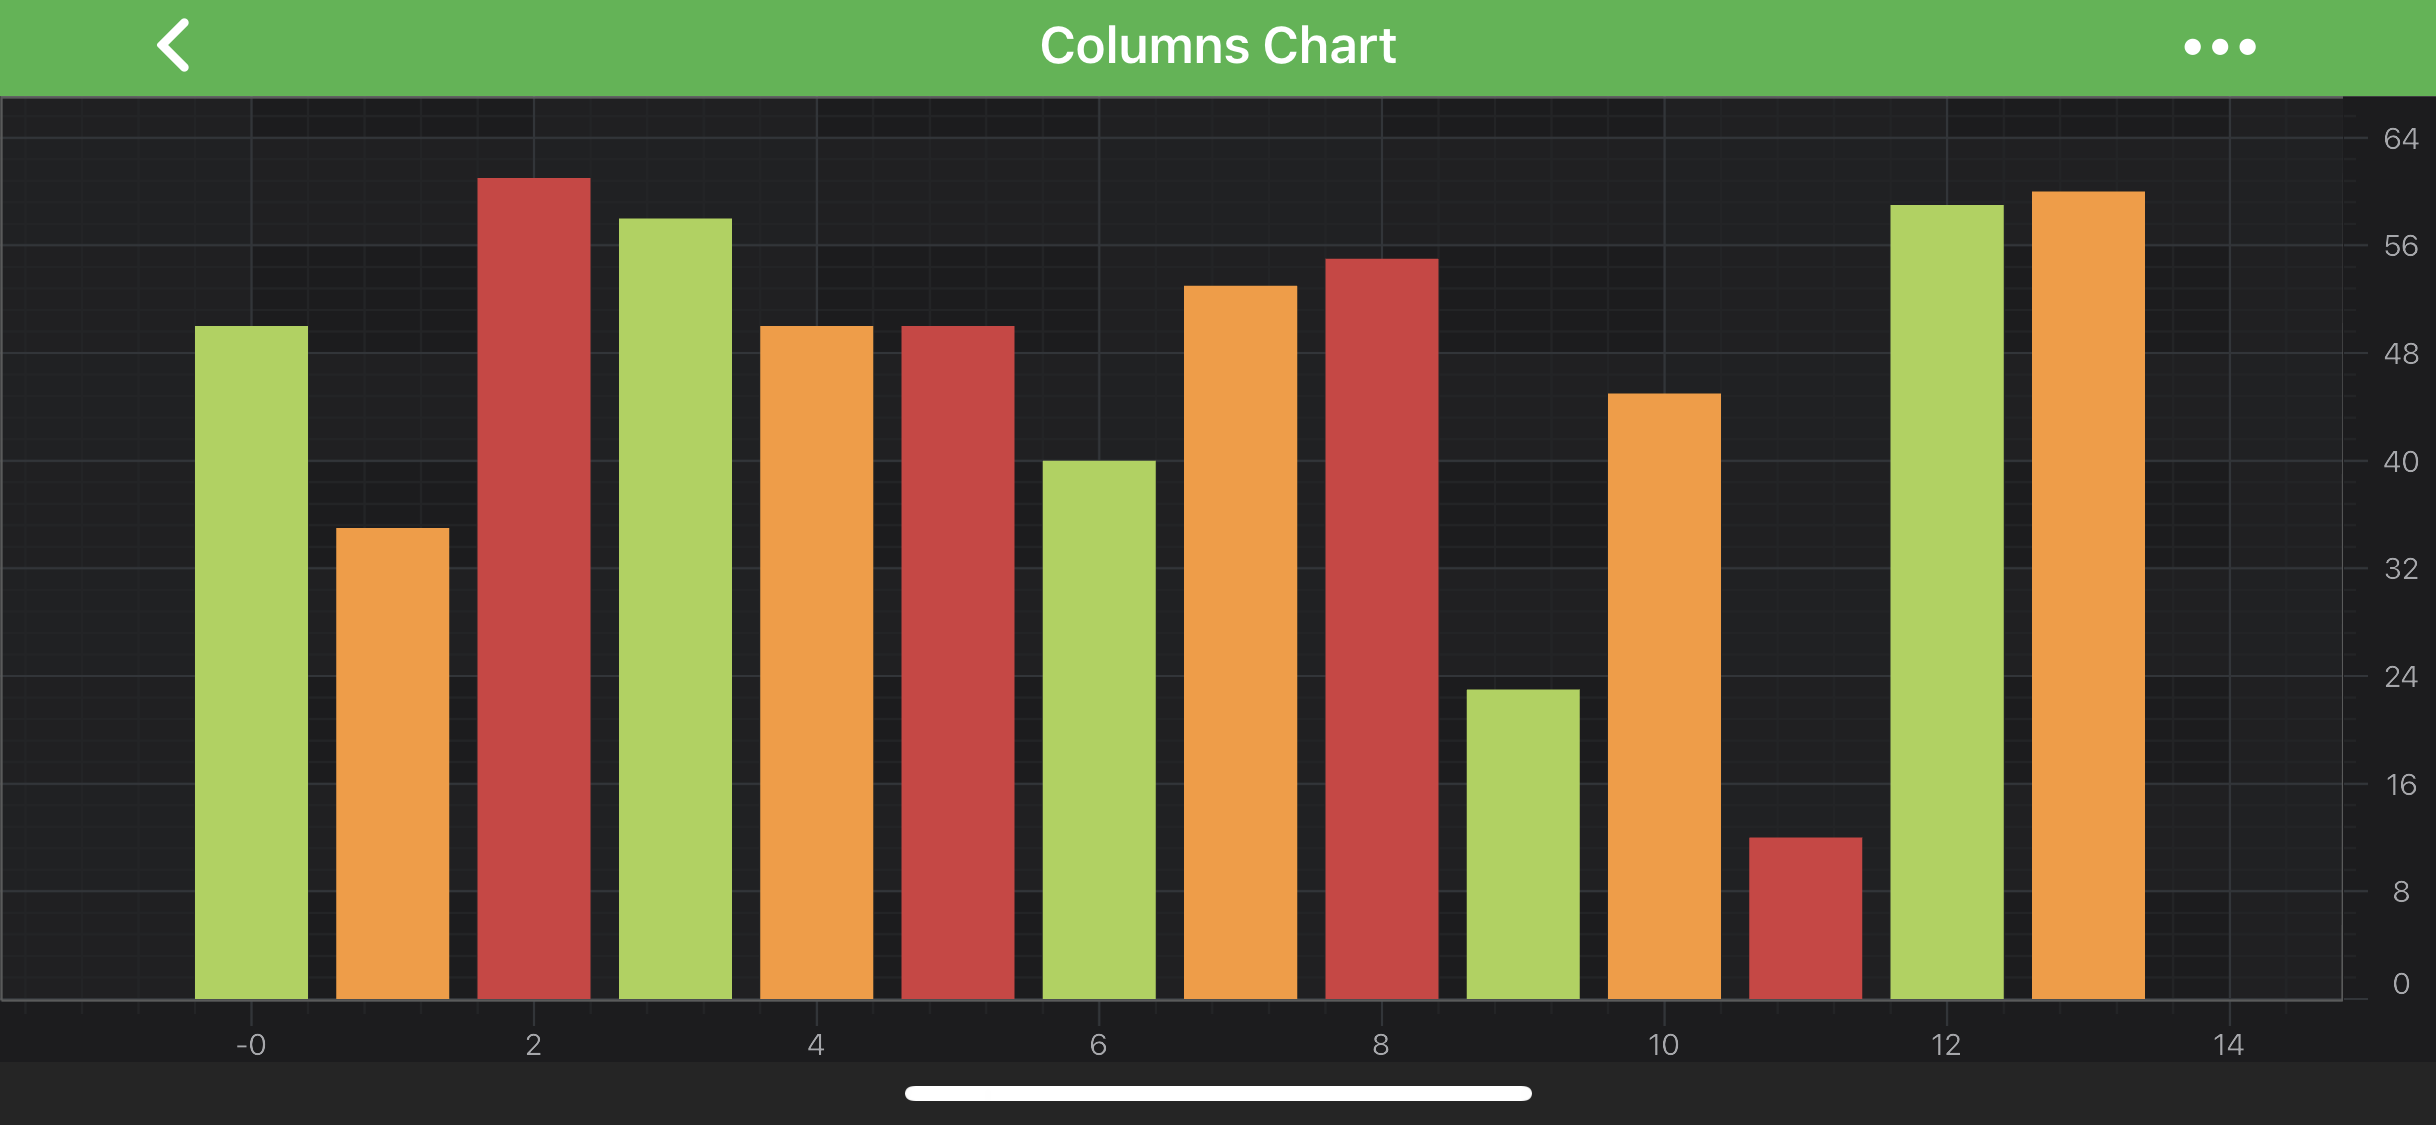
Column Series Features
Column Series also has some features similar to other series, such as:
It’s possible to render a Gap in Column series, by passing a data point with a NaN as the Y value. Please refer to the RenderableSeries APIs article for more details.
 View on GitHub