 View on GitHub
iOS & macOS Charting Documentation - SciChart iOS & macOS Charts SDK v4.x
SciChart iOS Tutorial - Tooltips and Legends
In the previous tutorials we’ve showed how to Create a Simple Chart and add some Zoom and Pan interaction via the Chart Modifiers API.
In this SciChart iOS tutorial we’re going show how to add a Legend and Tooltip to the chart.
Getting Started
This tutorial is suitable for Objective-C, Swift and C# with Xamarin.iOS.
NOTE: Source code for this tutorial can be found at our Github Repository:
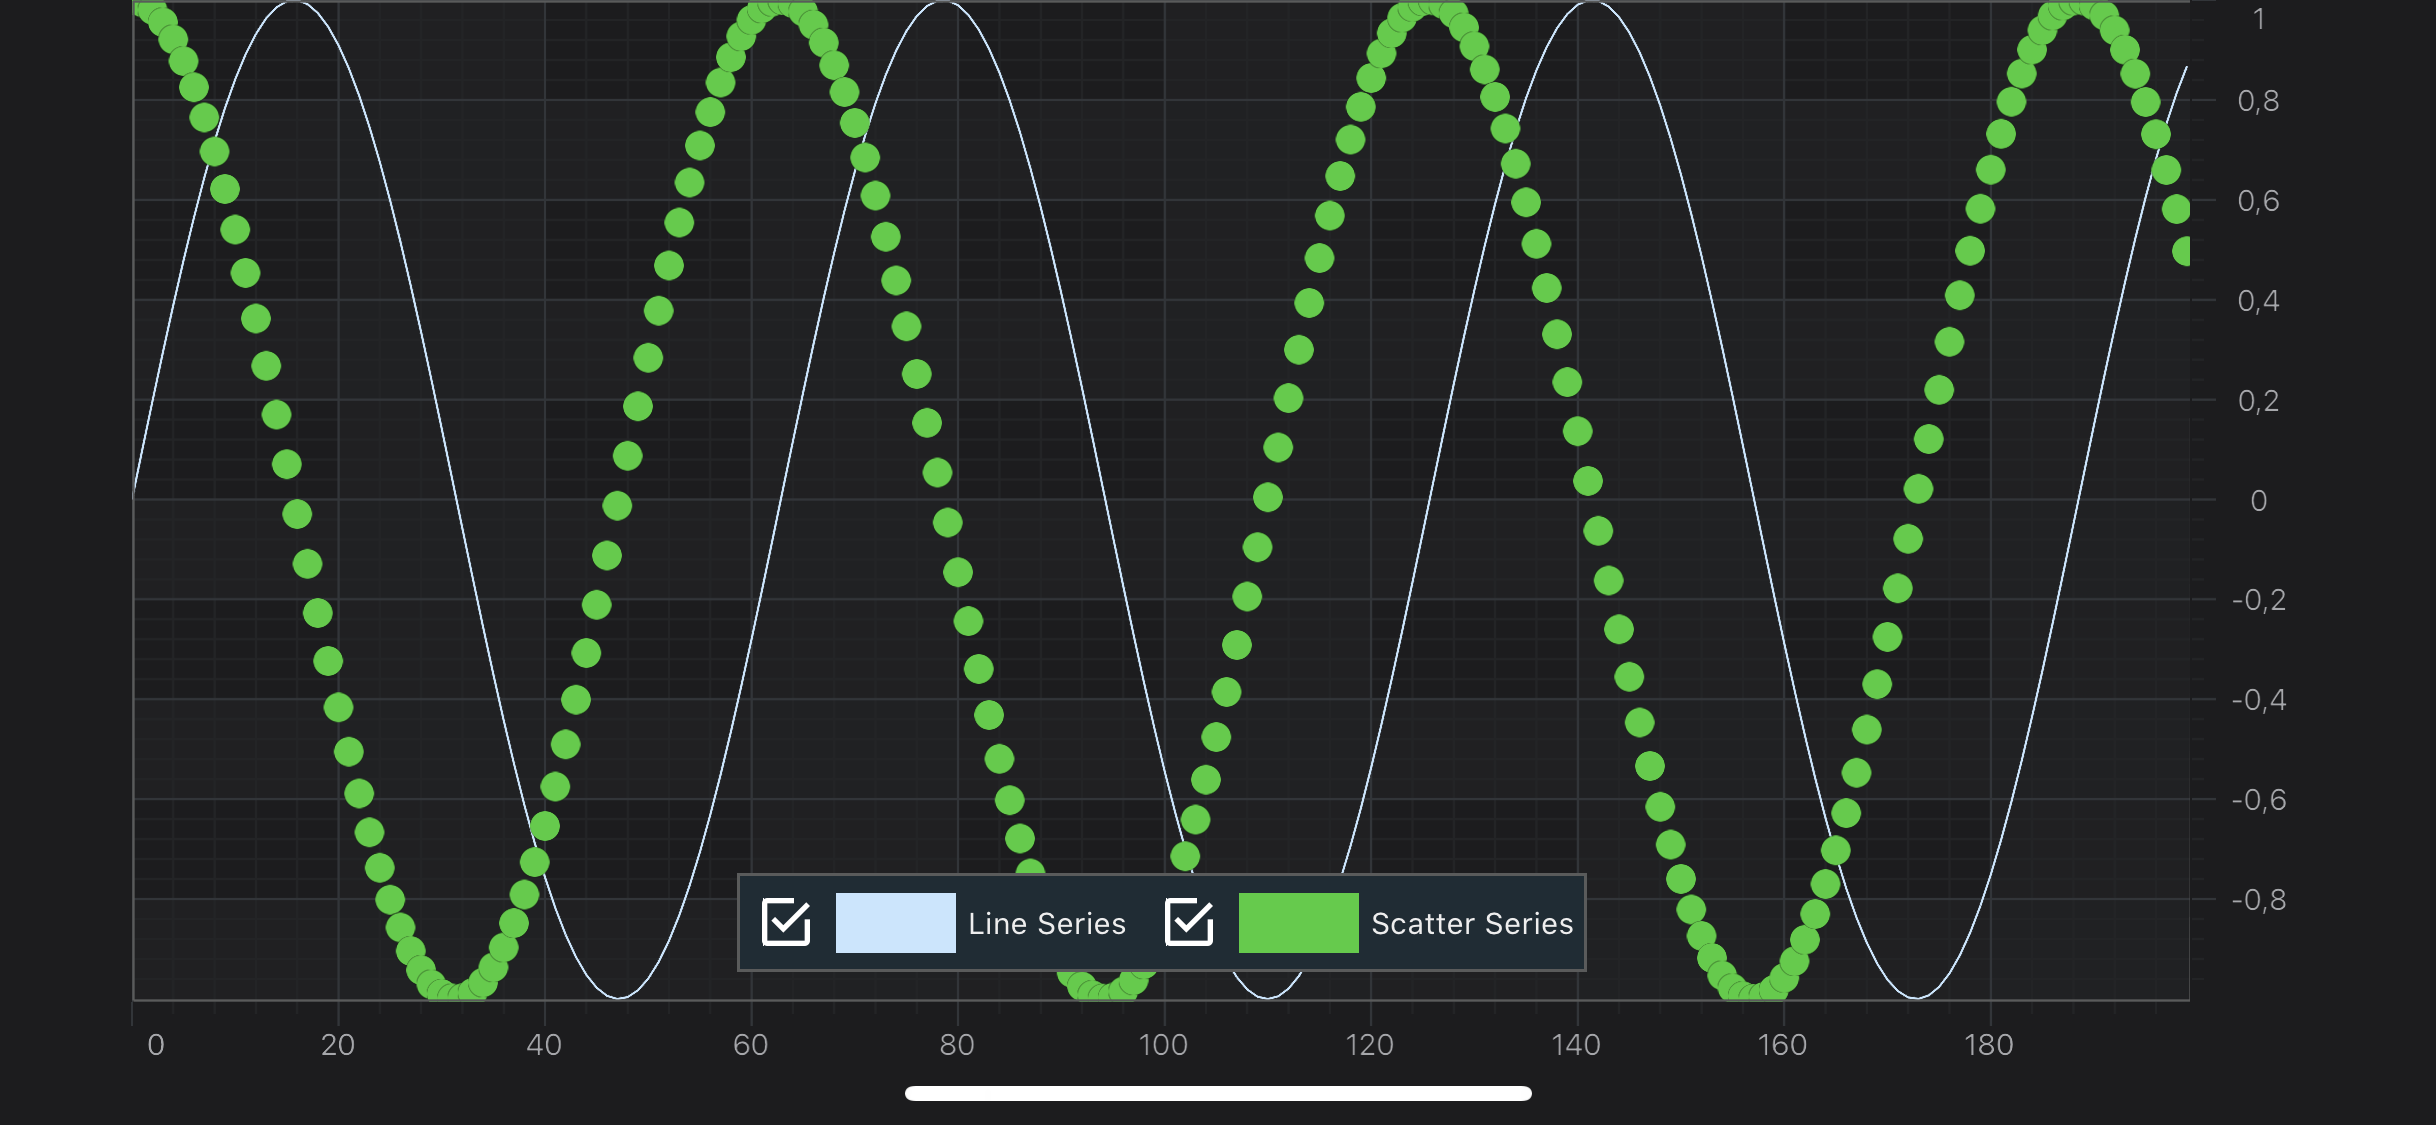
Add a Legend
In SciChart, a chart legend can be created and configured via the SCILegendModifier:
Also, if you want to have your series properly named inside the Legend, you will need to provide Series Names for your DataSeries instances, like showed below:
NOTE: You can find more information about legends in SciChart in the Legend Modifier article.
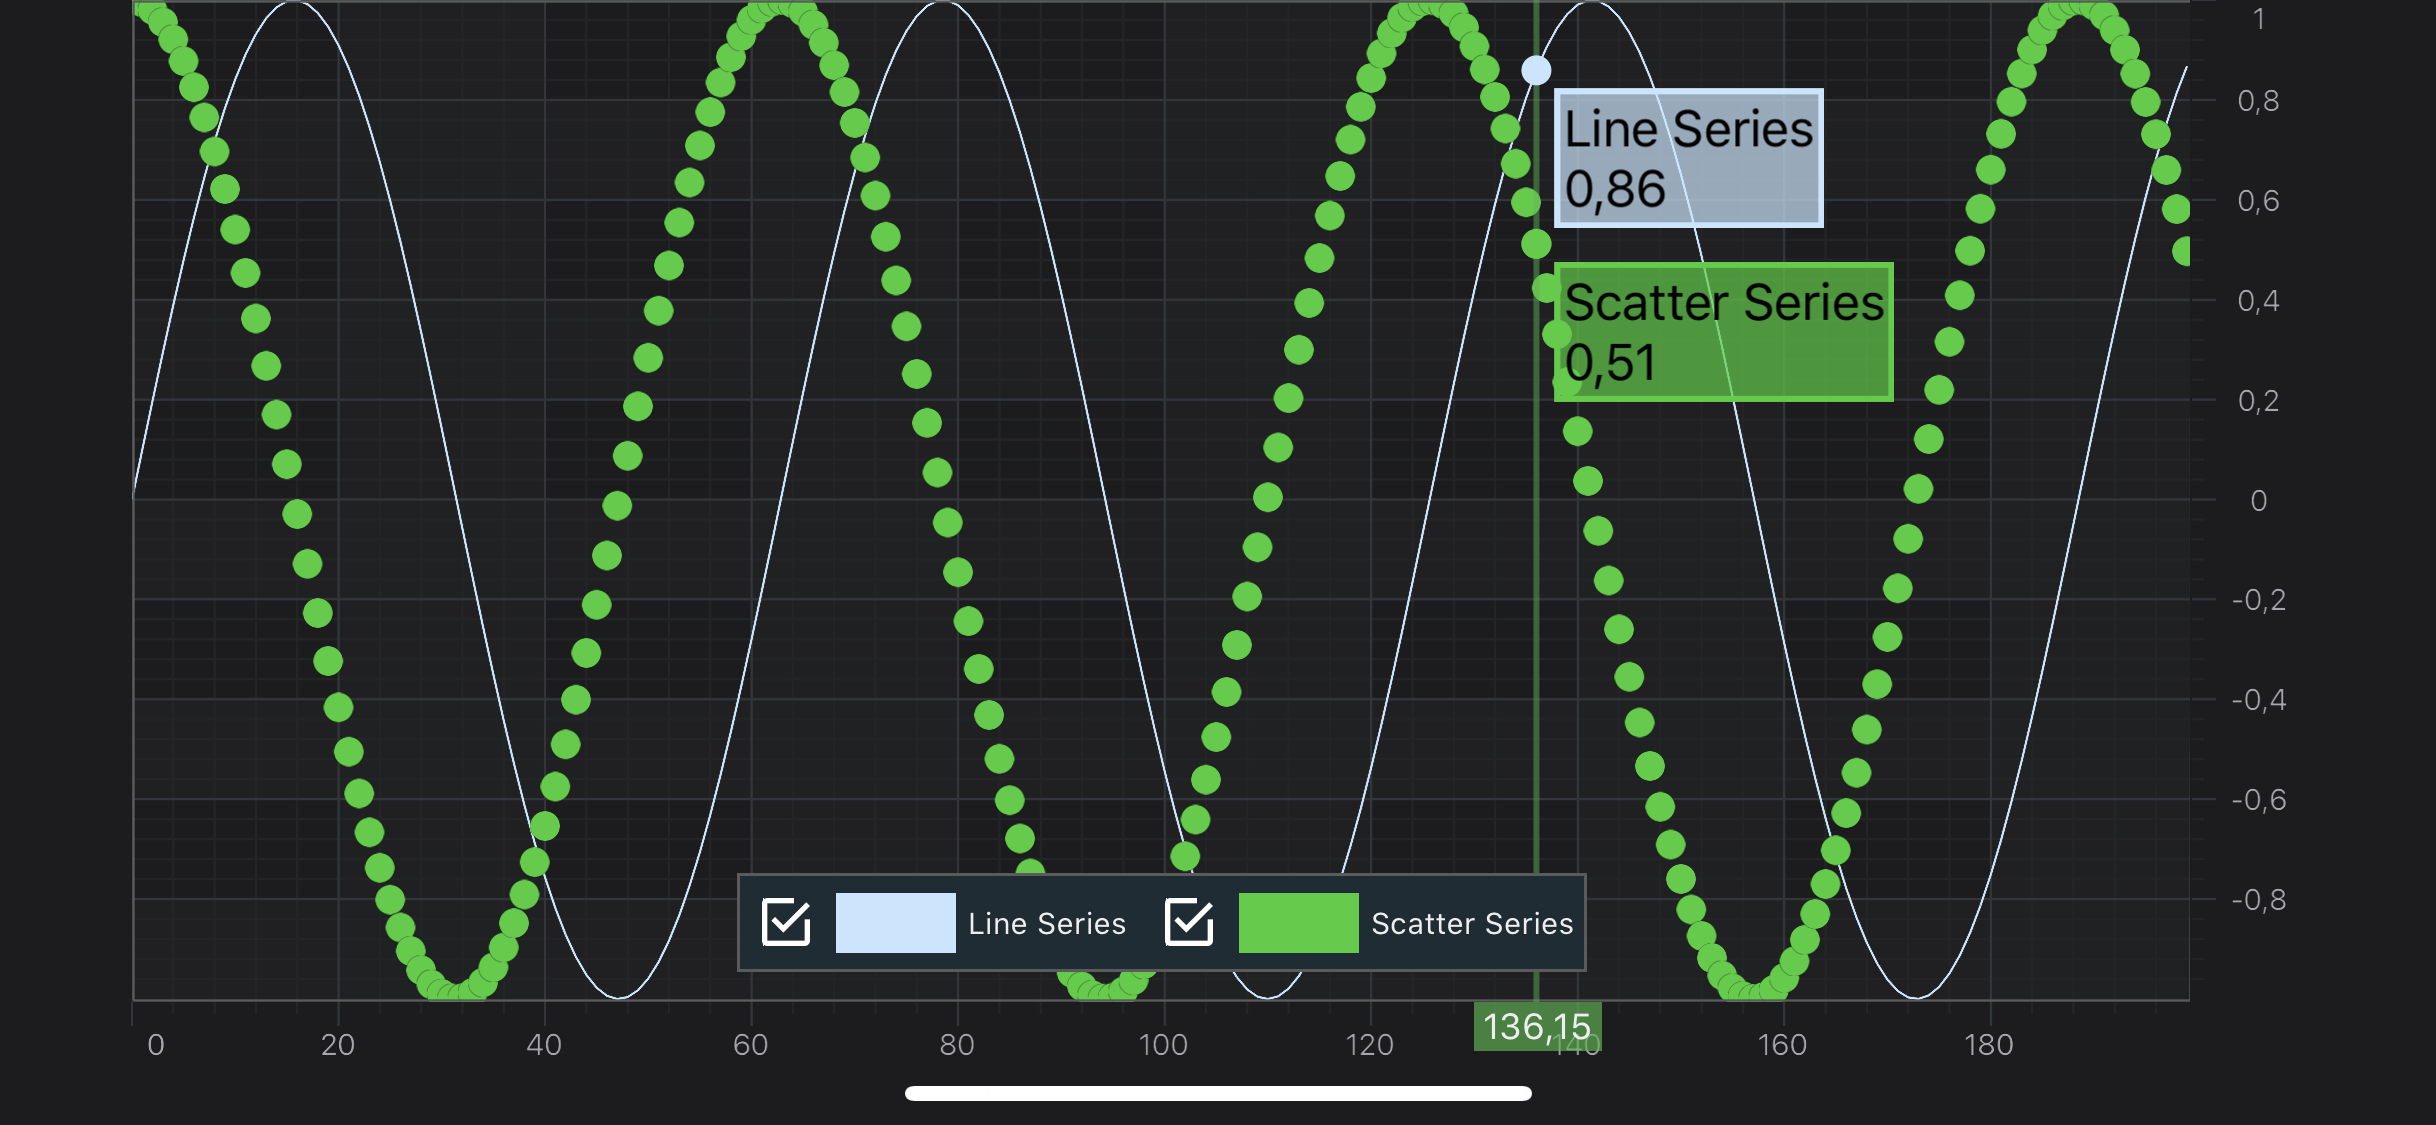
Adding tooltips using SCIRolloverModifier
Rollover Modifier adds a vertical section onto a SCIChartSurface.
When you put your finger on the screen - it shows all series values at the X-Coordinate of that point.
Adding the SCIRolloverModifier is fairly simple with just creation new instance and adding to the ISCIChartSurface.chartModifiers, like below:
NOTE: You can find more information about RolloverModifier in the corresponding Rollover Modifier article.
Where to Go From Here?
In SciChart there are a bunch of modifiers, which are able to provide information about series (inspect series), such as:
Also, all of the modifiers is highly customizable, and you can find more information in the Tooltips Customization article.
You can download the final project from our GitHub Repository:
Also, you can found next tutorial from this series here - SciChart iOS Tutorial - Adding Realtime Updates
Of course, this is not the maximum limit of what you can achieve with the SciChart iOS. You can find more information about modifiers which are used in this tutorial in the articles below:
Finally, start exploring. The SciChart iOS is quite extensive. You can look into our SciChart iOS Examples Suite which are full of 2D and 3D examples, which are also available on our GitHub.