SciChart® the market leader in Fast WPF Charts, WPF 3D Charts, iOS Chart, Android Chart and JavaScript Chart Components
Please note! These examples are new to SciChart iOS v4 release! SciChart’s OpenGL ES and Metal iOS and Metal macOS Chart library ships with hundred of Objective-C and Swift iOS&macOS Chart Examples which you can browse, play with and view the source-code. All of this is possible with the new and improved SciChart iOS Examples Suite and demo application for Mac, which ships as part of the SciChart SDK.
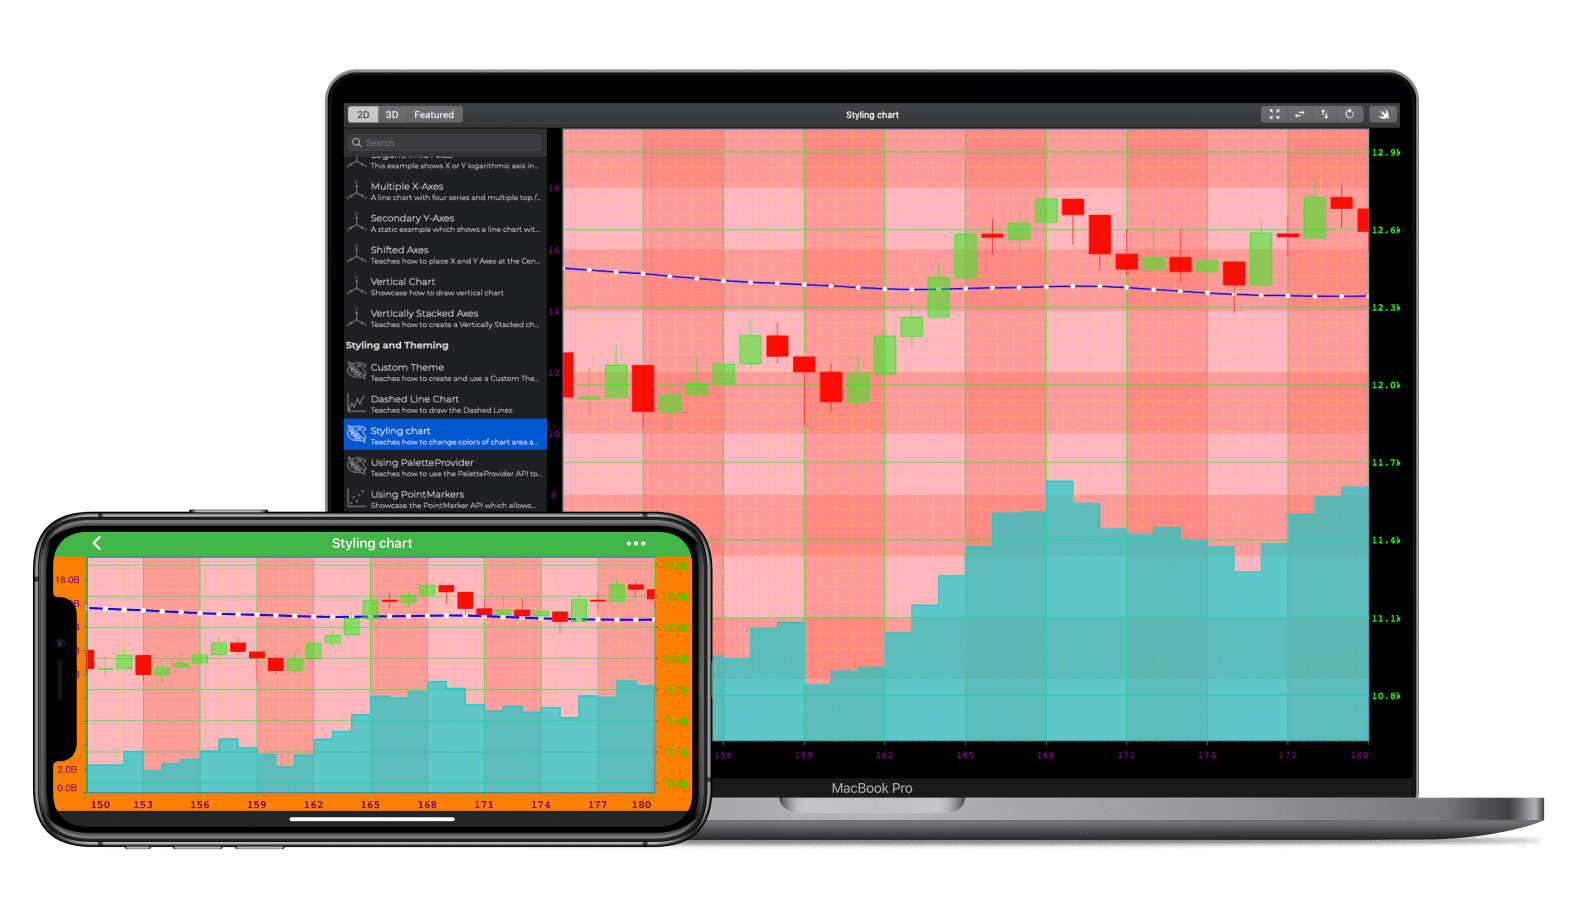
Using garish colors to demonstrate styling of the chart, axes, grid lines and common series types.
Almost any element in SciChart iOS is stylable and most parts of the chart are templated. You can easily set iOS Chart background color, grid line color, axis label color, viewport background color and chart series colors..
The Swift and Objective-C source code for the iOS and macOS Chart Custom Styling Exampleexample is included below (Scroll down!).
Did you know that we have the source code for all our example available for free on Github?
Clone the SciChart.iOS.Examples from Github.
Also the SciChart iOS and Scichart macOS Trials contain the full source for the examples (link below).
//******************************************************************************
// SCICHART® Copyright SciChart Ltd. 2011-2019. All rights reserved.
//
// Web: http://www.scichart.com
// Support: support@scichart.com
// Sales: sales@scichart.com
//
// StylingSciChartView.m is part of the SCICHART® Examples. Permission is hereby granted
// to modify, create derivative works, distribute and publish any part of this source
// code whether for commercial, private or personal use.
//
// The SCICHART® examples are distributed in the hope that they will be useful, but
// without any warranty. It is provided "AS IS" without warranty of any kind, either
// expressed or implied.
//******************************************************************************
#import "StylingSciChartView.h"
#import "SCDDataManager.h"
#import "ThousandsLabelProvider.h"
#import "BillionsLabelProvider.h"
@implementation StylingSciChartView
- (Class)associatedType { return SCIChartSurface.class; }
- (void)initExample {
SCIFontDescriptor *tickFontDescriptor = [SCIFontDescriptor fontDescriptorWithName:@"Courier-Bold" size:14];
SCIFontDescriptor *titleFontDescriptor = [SCIFontDescriptor fontDescriptorWithName:@"Courier-Bold" size:18];
// Create the XAxis
id<ISCIAxis> xAxis = [SCINumericAxis new];
xAxis.growBy = [[SCIDoubleRange alloc] initWithMin:0.1 max:0.1];
xAxis.visibleRange = [[SCIDoubleRange alloc] initWithMin:150 max:180];
// Brushes and styles for the XAxis, vertical gridlines, vertical tick marks, vertical axis bands and xaxis labels
xAxis.axisBandsStyle = [[SCISolidBrushStyle alloc] initWithColorCode:0x55ff6655];
xAxis.majorGridLineStyle = [[SCISolidPenStyle alloc] initWithColor:SCIColor.greenColor thickness:1];
xAxis.minorGridLineStyle = [[SCISolidPenStyle alloc] initWithColor:SCIColor.yellowColor thickness:0.5 strokeDashArray:@[@(10.f), @(3.f), @(10.f), @(3.f)]];
xAxis.tickLabelStyle = [[SCIFontStyle alloc] initWithFontDescriptor:tickFontDescriptor andTextColor:SCIColor.purpleColor];
xAxis.titleStyle = [[SCIFontStyle alloc] initWithFontDescriptor:titleFontDescriptor andTextColor:SCIColor.purpleColor];
xAxis.drawMajorTicks = YES;
xAxis.drawMinorTicks = YES;
xAxis.drawLabels = YES;
xAxis.drawMinorGridLines = YES;
xAxis.drawMajorGridLines = YES;
xAxis.majorTickLineLength = 5;
xAxis.majorTickLineStyle = [[SCISolidPenStyle alloc] initWithColor:SCIColor.greenColor thickness:1];
xAxis.minorTickLineLength = 2;
xAxis.minorTickLineStyle = [[SCISolidPenStyle alloc] initWithColor:SCIColor.yellowColor thickness:0.5];
// Create the right YAxis
id<ISCIAxis> yRightAxis = [SCINumericAxis new];
yRightAxis.growBy = [[SCIDoubleRange alloc] initWithMin:0.1 max:0.1];
yRightAxis.axisAlignment = SCIAxisAlignment_Right;
yRightAxis.autoRange = SCIAutoRange_Always;
yRightAxis.axisId = @"PrimaryAxisId";
// Brushes and styles for the Right YAxis, vertical gridlines, vertical tick marks, horizontal axis bands and right yaxis labels
yRightAxis.axisBandsStyle = [[SCISolidBrushStyle alloc] initWithColorCode:0x55ff6655];
yRightAxis.majorGridLineStyle = [[SCISolidPenStyle alloc] initWithColor:SCIColor.greenColor thickness:1];
yRightAxis.minorGridLineStyle = [[SCISolidPenStyle alloc] initWithColor:SCIColor.yellowColor thickness:0.5 strokeDashArray:@[@(10.f), @(3.f), @(10.f), @(3.f)]];
yRightAxis.labelProvider = [ThousandsLabelProvider new]; // For more info see the LabelProvider API Documentation
yRightAxis.tickLabelStyle = [[SCIFontStyle alloc] initWithFontDescriptor:tickFontDescriptor andTextColor:SCIColor.greenColor];
yRightAxis.titleStyle = [[SCIFontStyle alloc] initWithFontDescriptor:titleFontDescriptor andTextColor:SCIColor.greenColor];
yRightAxis.drawMajorTicks = YES;
yRightAxis.drawMinorTicks = YES;
yRightAxis.drawLabels = YES;
yRightAxis.drawMinorGridLines = YES;
yRightAxis.drawMajorGridLines = YES;
yRightAxis.majorTickLineLength = 3;
yRightAxis.majorTickLineStyle = [[SCISolidPenStyle alloc] initWithColor:SCIColor.purpleColor thickness:1];
yRightAxis.minorTickLineLength = 2;
yRightAxis.minorTickLineStyle = [[SCISolidPenStyle alloc] initWithColor:SCIColor.redColor thickness:0.5];
// Create the left YAxis
id<ISCIAxis> yLeftAxis = [SCINumericAxis new];
yLeftAxis.growBy = [[SCIDoubleRange alloc] initWithMin:0 max:3];
yLeftAxis.axisAlignment = SCIAxisAlignment_Left;
yLeftAxis.autoRange = SCIAutoRange_Always;
yLeftAxis.axisId = @"SecondaryAxisId";
// Brushes and styles for the Left YAxis, vertical gridlines, vertical tick marks, horizontal axis bands and left yaxis labels
yLeftAxis.axisBandsStyle = [[SCISolidBrushStyle alloc] initWithColorCode:0x55ff6655];
yLeftAxis.majorGridLineStyle = [[SCISolidPenStyle alloc] initWithColor:SCIColor.greenColor thickness:1];
yLeftAxis.minorGridLineStyle = [[SCISolidPenStyle alloc] initWithColor:SCIColor.yellowColor thickness:0.5 strokeDashArray:@[@(10.f), @(3.f), @(10.f), @(3.f)]];
yLeftAxis.labelProvider = [BillionsLabelProvider new]; // For more info see the LabelProvider API Documentation
yLeftAxis.tickLabelStyle = [[SCIFontStyle alloc] initWithFontDescriptor:tickFontDescriptor andTextColor:SCIColor.purpleColor];
yLeftAxis.titleStyle = [[SCIFontStyle alloc] initWithFontDescriptor:titleFontDescriptor andTextColor:SCIColor.purpleColor];
yLeftAxis.drawLabels = YES;
yLeftAxis.drawMajorTicks = YES;
yLeftAxis.drawMinorTicks = YES;
yLeftAxis.drawMajorGridLines = NO;
yLeftAxis.drawMinorGridLines = NO;
yLeftAxis.majorTickLineLength = 3;
yLeftAxis.majorTickLineStyle = [[SCISolidPenStyle alloc] initWithColor:SCIColor.blackColor thickness:1];
yLeftAxis.minorTickLineLength = 2;
yLeftAxis.minorTickLineStyle = [[SCISolidPenStyle alloc] initWithColor:SCIColor.blackColor thickness:0.5];
// Create and populate data series
SCDPriceSeries *priceSeries = [SCDDataManager getPriceDataIndu];
SCIXyDataSeries *mountainDataSeries = [[SCIXyDataSeries alloc] initWithXType:SCIDataType_Double yType:SCIDataType_Double];
mountainDataSeries.seriesName = @"Mountain Series";
SCIXyDataSeries *lineDataSeries = [[SCIXyDataSeries alloc] initWithXType:SCIDataType_Double yType:SCIDataType_Double];
lineDataSeries.seriesName = @"Line Series";
SCIXyDataSeries *columnDataSeries = [[SCIXyDataSeries alloc] initWithXType:SCIDataType_Double yType:SCIDataType_Long];
columnDataSeries.seriesName = @"Column Series";
SCIOhlcDataSeries *candlestickDataSeries = [[SCIOhlcDataSeries alloc] initWithXType:SCIDataType_Double yType:SCIDataType_Double];
candlestickDataSeries.seriesName = @"Candlestick Series";
[mountainDataSeries appendValuesX:priceSeries.indexesAsDouble y:[SCDDataManager offset:priceSeries.lowData offset:-1000]];
[lineDataSeries appendValuesX:priceSeries.indexesAsDouble y:[SCDDataManager computeMovingAverageOf:priceSeries.closeData length:50]];
[columnDataSeries appendValuesX:priceSeries.indexesAsDouble y:priceSeries.volumeData];
[candlestickDataSeries appendValuesX:priceSeries.indexesAsDouble open:priceSeries.openData high:priceSeries.highData low:priceSeries.lowData close:priceSeries.closeData];
SCIFastMountainRenderableSeries *mountainSeries = [SCIFastMountainRenderableSeries new];
mountainSeries.dataSeries = mountainDataSeries;
mountainSeries.yAxisId = @"PrimaryAxisId";
// mountain series area fill
mountainSeries.areaStyle = [[SCISolidBrushStyle alloc] initWithColorCode:0xA000D0D0];
// mountain series line (just on top of mountain). If set to nil, there will be no line
mountainSeries.strokeStyle = [[SCISolidPenStyle alloc] initWithColorCode:0xFF00D0D0 thickness:2];
// setting to true gives jagged mountains. set to false if you want regular mountain chart
mountainSeries.isDigitalLine = YES;
SCIFastLineRenderableSeries *lineSeries = [SCIFastLineRenderableSeries new];
lineSeries.dataSeries = lineDataSeries;
lineSeries.yAxisId = @"PrimaryAxisId";
// line series color and thickness
lineSeries.strokeStyle = [[SCISolidPenStyle alloc] initWithColorCode:0xFF0000FF thickness:3];
// setting to true gives jagged line. set to false if you want regular line chart
lineSeries.isDigitalLine = NO;
// one of the options for point markers. That one uses core graphics drawing to render texture for point markers
SCIEllipsePointMarker *pointMarker = [SCIEllipsePointMarker new];
pointMarker.size = CGSizeMake(7, 7);
// point marers at data points. set to nil if you don't need them
lineSeries.pointMarker = pointMarker;
SCIFastColumnRenderableSeries *columnSeries = [SCIFastColumnRenderableSeries new];
columnSeries.dataSeries = columnDataSeries;
columnSeries.yAxisId = @"SecondaryAxisId";
// column series fill color
columnSeries.fillBrushStyle = [[SCISolidBrushStyle alloc] initWithColorCode:0xE0D030D0];
// column series outline color and width. It is set to nil to disable outline
columnSeries.strokeStyle = SCIPenStyle.TRANSPARENT;
SCIFastCandlestickRenderableSeries *candlestickSeries = [SCIFastCandlestickRenderableSeries new];
candlestickSeries.dataSeries = candlestickDataSeries;
candlestickSeries.yAxisId = @"PrimaryAxisId";
// candlestick series has separate color for data where close is higher that open value (up) and oposite when close is lower than open (down)
// candlestick stroke color and thicknes for "up" data
candlestickSeries.strokeUpStyle = [[SCISolidPenStyle alloc] initWithColorCode:0xFF00FF00 thickness:1];
// candlestick fill color for "up" data
candlestickSeries.fillUpBrushStyle = [[SCISolidBrushStyle alloc] initWithColorCode:0x7000FF00];
// candlestick stroke color and thicknes for "down" data
candlestickSeries.strokeDownStyle = [[SCISolidPenStyle alloc] initWithColorCode:0xFFFF0000 thickness:1];
// candlestick fill color for "down" data
candlestickSeries.fillDownBrushStyle = [[SCISolidBrushStyle alloc] initWithColorCode:0xFFFF0000];
[SCIUpdateSuspender usingWithSuspendable:self.surface withBlock:^{
[self.surface.xAxes add:xAxis];
[self.surface.yAxes add:yRightAxis];
[self.surface.yAxes add:yLeftAxis];
[self.surface.renderableSeries add:mountainSeries];
[self.surface.renderableSeries add:lineSeries];
[self.surface.renderableSeries add:columnSeries];
[self.surface.renderableSeries add:candlestickSeries];
[self.surface.chartModifiers add:[SCDExampleBaseViewController createDefaultModifiers]];
[SCIAnimations scaleSeries:mountainSeries withZeroLine:10500 duration:3.0 andEasingFunction:[SCIElasticEase new]];
[SCIAnimations scaleSeries:lineSeries withZeroLine:11700 duration:3.0 andEasingFunction:[SCIElasticEase new]];
[SCIAnimations scaleSeries:columnSeries withZeroLine:12250 duration:3.0 andEasingFunction:[SCIElasticEase new]];
[SCIAnimations scaleSeries:candlestickSeries withZeroLine:10500 duration:3.0 andEasingFunction:[SCIElasticEase new]];
}];
}
- (void)tryUpdateChartTheme:(SCIChartTheme)theme {
[super tryUpdateChartTheme:theme];
// self.surface background. If you set color for chart area than it is color only for axes area
self.surface.platformBackgroundColor = SCIColor.orangeColor;
// chart area background fill color
self.surface.renderableSeriesAreaFillStyle = [[SCISolidBrushStyle alloc] initWithColorCode:0xFFFFB6C1];
// chart area border color and thickness
self.surface.renderableSeriesAreaBorderStyle = [[SCISolidPenStyle alloc] initWithColorCode:0xFF4682b4 thickness:2];
}
@end
//******************************************************************************
// SCICHART® Copyright SciChart Ltd. 2011-2019. All rights reserved.
//
// Web: http://www.scichart.com
// Support: support@scichart.com
// Sales: sales@scichart.com
//
// StylingSciChartView.swift is part of the SCICHART® Examples. Permission is hereby granted
// to modify, create derivative works, distribute and publish any part of this source
// code whether for commercial, private or personal use.
//
// The SCICHART® examples are distributed in the hope that they will be useful, but
// without any warranty. It is provided "AS IS" without warranty of any kind, either
// expressed or implied.
//******************************************************************************
class StylingSciChartView: SCDSingleChartViewController<SCIChartSurface> {
override var associatedType: AnyClass { return SCIChartSurface.self }
override func initExample() {
// Create the XAxis
let xAxis = SCINumericAxis()
xAxis.growBy = SCIDoubleRange(min: 0.1, max: 0.1)
xAxis.visibleRange = SCIDoubleRange(min: 150, max: 180)
// Brushes and styles for the XAxis, vertical gridlines, vertical tick marks, vertical axis bands and xaxis labels
xAxis.axisBandsStyle = SCISolidBrushStyle(color: 0x55ff6655);
xAxis.majorGridLineStyle = SCISolidPenStyle(color: .green, thickness: 1)
xAxis.minorGridLineStyle = SCISolidPenStyle(color: .yellow, thickness: 0.5, strokeDashArray: [10.0, 3.0, 10.0, 3.0])
xAxis.tickLabelStyle = SCIFontStyle(fontDescriptor: SCIFontDescriptor(name: "Courier-Bold", size: 14.0), andTextColor: .purple)
xAxis.drawMajorTicks = true
xAxis.drawMinorTicks = true
xAxis.drawMajorGridLines = true
xAxis.drawMinorGridLines = true
xAxis.drawLabels = true
xAxis.majorTickLineLength = 5
xAxis.majorTickLineStyle = SCISolidPenStyle(color: .green, thickness: 1)
xAxis.minorTickLineLength = 2
xAxis.minorTickLineStyle = SCISolidPenStyle(color: .yellow, thickness: 0.5, strokeDashArray: [10.0, 3.0, 10.0, 3.0])
// Create the Right YAxis
let yRightAxis = SCINumericAxis()
yRightAxis.growBy = SCIDoubleRange(min: 0.1, max: 0.1)
yRightAxis.axisAlignment = .right
yRightAxis.autoRange = .always
yRightAxis.axisId = "PrimaryAxisId"
// Brushes and styles for the Right YAxis, horizontal gridlines, horizontal tick marks, horizontal axis bands and right yaxis labels
yRightAxis.axisBandsStyle = SCISolidBrushStyle(color: 0x55ff6655)
yRightAxis.majorGridLineStyle = SCISolidPenStyle(color: .green, thickness: 1)
yRightAxis.minorGridLineStyle = SCISolidPenStyle(color: .yellow, thickness: 0.5, strokeDashArray: [10.0, 3.0, 10.0, 3.0])
yRightAxis.labelProvider = SCDThousandsLabelProvider() // see LabelProvider API documentation for more info
yRightAxis.tickLabelStyle = SCIFontStyle(fontDescriptor: SCIFontDescriptor(name: "Helvetica", size: 14.0), andTextColor: .green)
yRightAxis.drawMajorTicks = true
yRightAxis.drawMinorTicks = true
yRightAxis.drawLabels = true
yRightAxis.drawMajorGridLines = true
yRightAxis.drawMinorGridLines = true
yRightAxis.majorTickLineLength = 3
yRightAxis.majorTickLineStyle = SCISolidPenStyle(color: .purple, thickness: 1)
yRightAxis.minorTickLineLength = 2
yRightAxis.minorTickLineStyle = SCISolidPenStyle(color: .red, thickness: 0.5)
// Create the left YAxis
let yLeftAxis = SCINumericAxis()
yLeftAxis.growBy = SCIDoubleRange(min: 0, max: 3)
yLeftAxis.axisAlignment = .left;
yLeftAxis.autoRange = .always;
yLeftAxis.axisId = "SecondaryAxisId";
// Brushes and styles for the Left YAxis, horizontal gridlines, horizontal tick marks, horizontal axis bands and left yaxis labels
yLeftAxis.drawMajorBands = false
yLeftAxis.drawMajorGridLines = false
yLeftAxis.drawMinorGridLines = false
yLeftAxis.drawMajorTicks = true
yLeftAxis.drawMinorTicks = true
yLeftAxis.drawLabels = true
yLeftAxis.labelProvider = SCDBillionsLabelProvider() // See LabelProvider API documentation
yLeftAxis.tickLabelStyle = SCIFontStyle(fontDescriptor: SCIFontDescriptor(name: "Helvetica", size: 12.0), andTextColor: .purple)
yLeftAxis.majorTickLineLength = 3
yLeftAxis.majorTickLineStyle = SCISolidPenStyle(color: .black, thickness: 1)
yLeftAxis.minorTickLineLength = 2
yLeftAxis.minorTickLineStyle = SCISolidPenStyle(color: .black, thickness: 0.5)
// Create and populate data series
let priceData = SCDDataManager.getPriceDataIndu()
let mountainDataSeries = SCIXyDataSeries(xType: .double, yType: .double)
mountainDataSeries.seriesName = "Mountain Series"
let lineDataSeries = SCIXyDataSeries(xType: .double, yType: .double)
lineDataSeries.seriesName = "Line Series"
let columnDataSeries = SCIXyDataSeries(xType: .double, yType: .long)
columnDataSeries.seriesName = "Column Series"
let candlestickDataSeries = SCIOhlcDataSeries(xType: .double, yType: .double)
candlestickDataSeries.seriesName = "Candlestick Series"
mountainDataSeries.append(x: priceData.indexesAsDouble, y: SCDDataManager.offset(priceData.closeData, offset: -1000))
lineDataSeries.append(x: priceData.indexesAsDouble, y: SCDDataManager.computeMovingAverage(of: priceData.closeData, length: 50))
columnDataSeries.append(x: priceData.indexesAsDouble, y: priceData.volumeData)
candlestickDataSeries.append(x: priceData.indexesAsDouble, open:priceData.openData, high:priceData.highData, low:priceData.lowData, close:priceData.closeData)
let mountainSeries = SCIFastMountainRenderableSeries()
mountainSeries.dataSeries = mountainDataSeries
mountainSeries.yAxisId = "PrimaryAxisId"
// mountain series area fill
mountainSeries.areaStyle = SCISolidBrushStyle(color: 0xA000D0D0)
// mountain series line (just on top of mountain). If set to nil, there will be no line
mountainSeries.strokeStyle = SCISolidPenStyle(color: 0xFF00D0D0, thickness: 2)
// setting to true gives jagged mountains. set to false if you want regular mountain chart
mountainSeries.isDigitalLine = true
let lineSeries = SCIFastLineRenderableSeries()
lineSeries.dataSeries = lineDataSeries
lineSeries.yAxisId = "PrimaryAxisId"
// line series color and thickness
lineSeries.strokeStyle = SCISolidPenStyle(color: 0xFF0000FF, thickness: 3)
// setting to true gives jagged line. set to false if you want regular line chart
lineSeries.isDigitalLine = false
// one of the options for point markers.
let pointMarker = SCIEllipsePointMarker()
pointMarker.size = CGSize(width: 7, height: 7)
// point marers at data points. set to nil if you don't need them
lineSeries.pointMarker = pointMarker
let columnSeries = SCIFastColumnRenderableSeries()
columnSeries.dataSeries = columnDataSeries
columnSeries.yAxisId = "SecondaryAxisId"
// column series fill color
columnSeries.fillBrushStyle = SCISolidBrushStyle(color: 0xE0D030D0)
// column series outline color and width. It is set to nil to disable outline
columnSeries.strokeStyle = SCIPenStyle.transparent
let candlestickSeries = SCIFastCandlestickRenderableSeries()
candlestickSeries.dataSeries = candlestickDataSeries
candlestickSeries.yAxisId = "PrimaryAxisId"
// candlestick series has separate color for data where close is higher that open value (up) and oposite when close is lower than open (down)
// candlestick stroke color and thicknes for "up" data
candlestickSeries.strokeUpStyle = SCISolidPenStyle(color: 0xFF00FF00, thickness: 1)
// candlestick fill color for "up" data
candlestickSeries.fillUpBrushStyle = SCISolidBrushStyle(color: 0x7000FF00)
// candlestick stroke color and thicknes for "down" data
candlestickSeries.strokeDownStyle = SCISolidPenStyle(color: 0xFFFF0000, thickness: 1)
// candlestick fill color for "down" data
candlestickSeries.fillDownBrushStyle = SCISolidBrushStyle(color: 0xFFFF0000)
SCIUpdateSuspender.usingWith(surface) {
self.surface.xAxes.add(xAxis)
self.surface.yAxes.add(items: yRightAxis, yLeftAxis)
self.surface.renderableSeries.add(items: mountainSeries, lineSeries, candlestickSeries, columnSeries)
self.surface.chartModifiers.add(SCDExampleBaseViewController.createDefaultModifiers())
SCIAnimations.scale(mountainSeries, withZeroLine: 10500, duration: 3.0, andEasingFunction: SCIElasticEase())
SCIAnimations.scale(lineSeries, withZeroLine: 11700, duration: 3.0, andEasingFunction: SCIElasticEase())
SCIAnimations.scale(columnSeries, withZeroLine: 12250, duration: 3.0, andEasingFunction: SCIElasticEase())
SCIAnimations.scale(candlestickSeries, withZeroLine: 10500, duration: 3.0, andEasingFunction: SCIElasticEase())
}
}
override func tryUpdateChartTheme(_ theme: SCIChartTheme) {
super.tryUpdateChartTheme(theme)
// surface background. If you set color for chart background than it is color only for axes area
surface.platformBackgroundColor = .orange
// chart area (viewport) background fill color
surface.renderableSeriesAreaFillStyle = SCISolidBrushStyle(color: 0xFFFFB6C1)
// chart area border color and thickness
surface.renderableSeriesAreaBorderStyle = SCISolidPenStyle(color: 0xFF4682b4, thickness: 2)
}
}