SciChart® the market leader in Fast WPF Charts, WPF 3D Charts, iOS Chart, Android Chart and JavaScript Chart Components
Please note! These examples are new to SciChart iOS v4 release! SciChart’s OpenGL ES and Metal iOS and Metal macOS Chart library ships with hundred of Objective-C and Swift iOS&macOS Chart Examples which you can browse, play with and view the source-code. All of this is possible with the new and improved SciChart iOS Examples Suite and demo application for Mac, which ships as part of the SciChart SDK.
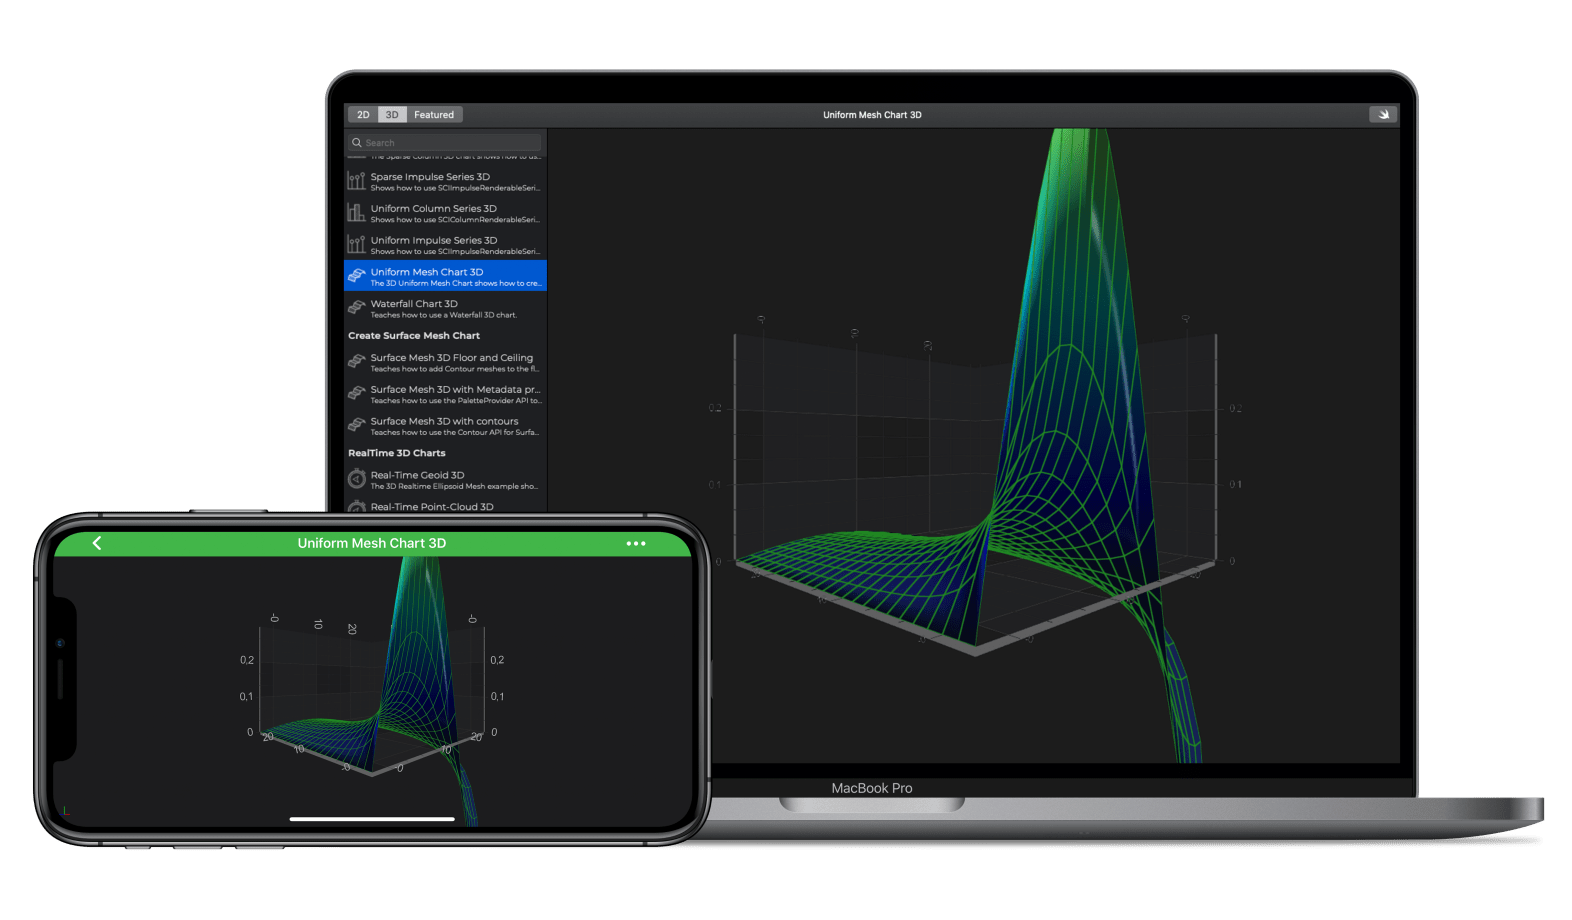
SciChart iOS 3D Charting Component supports plotting the basics Surface Meshes. This example shows how to use SCISurfaceMeshRenderableSeries3D and SCIUniformGridDataSeries3D to plot the iOS Uniform Mesh 3D graph.
With scientific and engineering implications in mind SciChart support a versatile number of charts, including rendering of 3D surfaces / dynamic or updating surfaces (terrains or height maps) / grids / contour mapping or wire frame / spectrogram and heatmaps which could be used for visualizing Topology data, Statistical analysis, Volatility Smiles etc.
Please read more about The SurfaceMesh 3D Chart Type in SciChart 3D iOS Documentation.
The Swift and Objective-C source code for the iOS and macOS Simple Uniform Mesh Chart 3D example is included below (Scroll down!).
Did you know that we have the source code for all our example available for free on Github?
Clone the SciChart.iOS.Examples from Github.
Also the SciChart iOS and Scichart macOS Trials contain the full source for the examples (link below).
//******************************************************************************
// SCICHART® Copyright SciChart Ltd. 2011-2019. All rights reserved.
//
// Web: http://www.scichart.com
// Support: support@scichart.com
// Sales: sales@scichart.com
//
// SimpleUniformMesh3DChartView.m is part of the SCICHART® Examples. Permission is hereby granted
// to modify, create derivative works, distribute and publish any part of this source
// code whether for commercial, private or personal use.
//
// The SCICHART® examples are distributed in the hope that they will be useful, but
// without any warranty. It is provided "AS IS" without warranty of any kind, either
// expressed or implied.
//******************************************************************************
#import "SimpleUniformMesh3DChartView.h"
@implementation SimpleUniformMesh3DChartView
- (Class)associatedType { return SCIChartSurface3D.class; }
- (void)initExample {
SCINumericAxis3D *xAxis = [SCINumericAxis3D new];
xAxis.growBy = [[SCIDoubleRange alloc] initWithMin:0.1 max:0.1];
SCINumericAxis3D *yAxis = [SCINumericAxis3D new];
yAxis.growBy = [[SCIDoubleRange alloc] initWithMin:0.1 max:0.1];
yAxis.visibleRange = [[SCIDoubleRange alloc] initWithMin:0.0 max:0.3];
SCINumericAxis3D *zAxis = [SCINumericAxis3D new];
zAxis.growBy = [[SCIDoubleRange alloc] initWithMin:0.1 max:0.1];
SCIUniformGridDataSeries3D *ds = [[SCIUniformGridDataSeries3D alloc] initWithXType:SCIDataType_Double yType:SCIDataType_Double zType:SCIDataType_Double xSize:25 zSize:25];
for (int x = 0; x < 25; ++x) {
for (int z = 0; z < 25; ++z) {
double xVal = 25 * x / 25;
double zVal = 25 * z / 25;
double yVal = sin(xVal * 0.2) / ((zVal + 1.0) * 2);
[ds updateYValue:@(yVal) atXIndex:x zIndex:z];
}
}
unsigned int colors[7] = { 0xFF1D2C6B, 0xFF0000FF, 0xFF00FFFF, 0xFFADFF2F, 0xFFFFFF00, 0xFFFF0000, 0xFF8B0000 };
float stops[7] = { 0.0, 0.1, 0.3, 0.5, 0.7, 0.9, 1.0};
SCIGradientColorPalette *palette = [[SCIGradientColorPalette alloc] initWithColors:colors stops:stops count:7];
SCISurfaceMeshRenderableSeries3D *rSeries = [SCISurfaceMeshRenderableSeries3D new];
rSeries.dataSeries = ds;
rSeries.drawMeshAs = SCIDrawMeshAs_SolidWireframe;
rSeries.stroke = 0x77228B22;
rSeries.strokeThickness = 2.0;
rSeries.drawSkirt = NO;
rSeries.meshColorPalette = palette;
[SCIUpdateSuspender usingWithSuspendable:self.surface withBlock:^{
self.surface.xAxis = xAxis;
self.surface.yAxis = yAxis;
self.surface.zAxis = zAxis;
[self.surface.renderableSeries add:rSeries];
[self.surface.chartModifiers add:[SCDExampleBaseViewController createDefaultModifiers3D]];
}];
}
@end
//******************************************************************************
// SCICHART® Copyright SciChart Ltd. 2011-2019. All rights reserved.
//
// Web: http://www.scichart.com
// Support: support@scichart.com
// Sales: sales@scichart.com
//
// SimpleUniformMesh3DChartView.swift is part of the SCICHART® Examples. Permission is hereby granted
// to modify, create derivative works, distribute and publish any part of this source
// code whether for commercial, private or personal use.
//
// The SCICHART® examples are distributed in the hope that they will be useful, but
// without any warranty. It is provided "AS IS" without warranty of any kind, either
// expressed or implied.
//******************************************************************************
class SimpleUniformMesh3DChartView: SCDSingleChartViewController<SCIChartSurface3D> {
override var associatedType: AnyClass { return SCIChartSurface3D.self }
let Size: Int = 25
override func initExample() {
let xAxis = SCINumericAxis3D()
xAxis.growBy = SCIDoubleRange(min: 0.1, max: 0.1)
let yAxis = SCINumericAxis3D()
yAxis.growBy = SCIDoubleRange(min: 0.1, max: 0.1)
yAxis.visibleRange = SCIDoubleRange(min: 0, max: 0.3)
let zAxis = SCINumericAxis3D()
zAxis.growBy = SCIDoubleRange(min: 0.1, max: 0.1)
let ds = SCIUniformGridDataSeries3D(xType: .double, yType: .double, zType: .double, xSize: Size, zSize: Size)
for x in 0 ..< Size {
for z in 0 ..< Size {
let xVal = Double(25 * x / Size)
let zVal = Double(25 * z / Size)
let y = sin(xVal * 0.2) / ((zVal + 1.0) * 2.0)
ds.update(y: y, atX: x, z: z)
}
}
let colors: [UInt32] = [0xFF1D2C6B, 0xFF0000FF, 0xFF00FFFF, 0xFFADFF2F, 0xFFFFFF00, 0xFFFF0000, 0xFF8B0000]
let stops: [Float] = [0, 0.1, 0.3, 0.5, 0.7, 0.9, 1]
let palette = SCIGradientColorPalette(colors: colors, stops: stops, count: 7)
let rSeries = SCISurfaceMeshRenderableSeries3D()
rSeries.dataSeries = ds
rSeries.drawMeshAs = .solidWireframe
rSeries.stroke = 0x77228B22
rSeries.contourStroke = 0x77228B22
rSeries.strokeThickness = 2.0
rSeries.drawSkirt = false
rSeries.meshColorPalette = palette
SCIUpdateSuspender.usingWith(surface) {
self.surface.xAxis = xAxis
self.surface.yAxis = yAxis
self.surface.zAxis = zAxis
self.surface.renderableSeries.add(rSeries)
self.surface.chartModifiers.add(SCDExampleBaseViewController.createDefaultModifiers3D())
}
}
}