SciChart® the market leader in Fast WPF Charts, WPF 3D Charts, iOS Chart, Android Chart and JavaScript Chart Components
Please note! These examples are new to SciChart iOS v4 release! SciChart’s OpenGL ES and Metal iOS and Metal macOS Chart library ships with hundred of Objective-C and Swift iOS&macOS Chart Examples which you can browse, play with and view the source-code. All of this is possible with the new and improved SciChart iOS Examples Suite and demo application for Mac, which ships as part of the SciChart SDK.
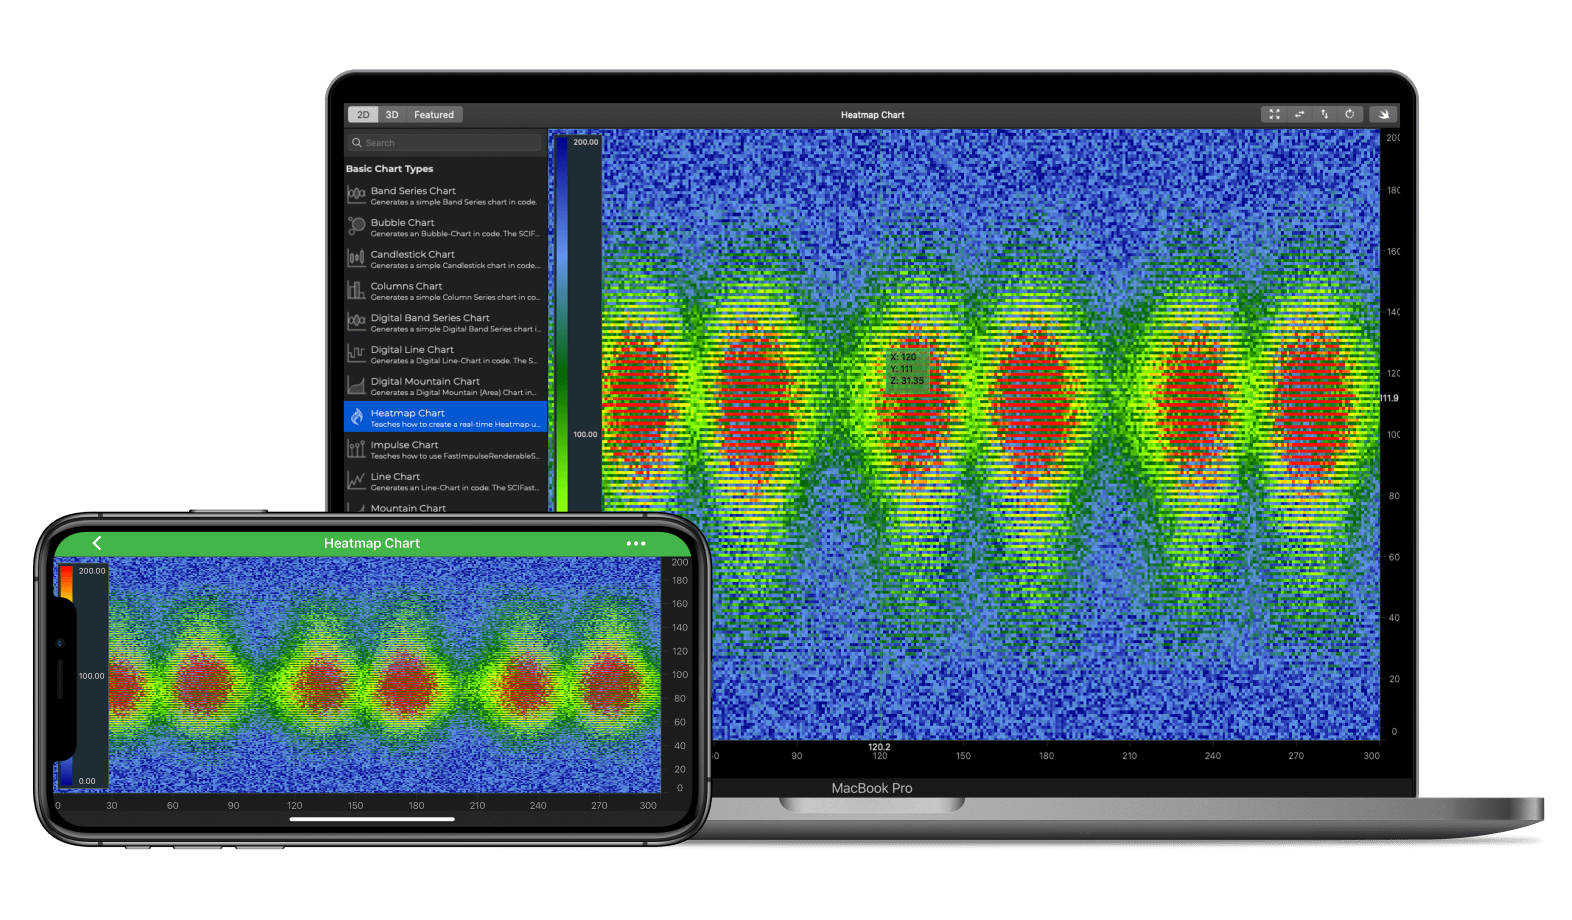
Demonstrates how to create a real-time iOS Heatmap using SciChart. See Documentation on how to use this type here: The iOS Heatmap Chart Documentation.
iOS Heatmap Charts can be used to visualise a variety of scientific and statistical data. Display a real-time spectrogram (Fourier Transform plus Time) of audio data. To overlay areas of heat on a background image such as a map or image, or to quickly bring to life 2-dimensional data and show the relative intensities via the heat color.
The SCIFastUniformHeatmapRenderableSeries expects a 2D Array of data in the form of a SCIUniformHeatmapDataSeries and has a user-defined colour map which can be displayed as a legend over the chart.
In this example you can tap and drag on the chart to see the animated-zoom performance while the heatmap is updating.
The Swift and Objective-C source code for the iOS and macOS Heatmap Chart example is included below (Scroll down!).
Did you know that we have the source code for all our example available for free on Github?
Clone the SciChart.iOS.Examples from Github.
Also the SciChart iOS and Scichart macOS Trials contain the full source for the examples (link below).
//******************************************************************************
// SCICHART® Copyright SciChart Ltd. 2011-2019. All rights reserved.
//
// Web: http://www.scichart.com
// Support: support@scichart.com
// Sales: sales@scichart.com
//
// HeatmapChartView.m is part of the SCICHART® Examples. Permission is hereby granted
// to modify, create derivative works, distribute and publish any part of this source
// code whether for commercial, private or personal use.
//
// The SCICHART® examples are distributed in the hope that they will be useful, but
// without any warranty. It is provided "AS IS" without warranty of any kind, either
// expressed or implied.
//******************************************************************************
#import "HeatmapChartView.h"
#import "SCDDataManager.h"
const int HEIGHT = 200;
const int WIDTH = 300;
const int SERIES_PER_PERIOD = 30;
const float TIME_INTERVAL = 0.04;
@interface HeatmapChartView ()
@property (strong, nonatomic) SCIUniformHeatmapDataSeries *dataSeries;
@property (strong, nonatomic) NSMutableArray<SCIDoubleValues *> *valuesArray;
@property (strong, nonatomic) NSTimer *timer;
@property (nonatomic) int timerIndex;
@property (nonatomic) BOOL running;
@end
@implementation HeatmapChartView
- (void)initExample {
id<ISCIAxis> xAxis = [SCINumericAxis new];
id<ISCIAxis> yAxis = [SCINumericAxis new];
_dataSeries = [[SCIUniformHeatmapDataSeries alloc] initWithXType:SCIDataType_Int yType:SCIDataType_Int zType:SCIDataType_Double xSize:WIDTH ySize:HEIGHT];
NSArray<SCIColor *> *colors = @[[SCIColor fromARGBColorCode:0xFF00008B], [SCIColor fromARGBColorCode:0xFF6495ED], [SCIColor fromARGBColorCode:0xFF006400], [SCIColor fromARGBColorCode:0xFF7FFF00], SCIColor.yellowColor, SCIColor.redColor];
SCIFastUniformHeatmapRenderableSeries *heatmapRenderableSeries = [SCIFastUniformHeatmapRenderableSeries new];
heatmapRenderableSeries.dataSeries = _dataSeries;
heatmapRenderableSeries.minimum = 0;
heatmapRenderableSeries.maximum = 200;
heatmapRenderableSeries.colorMap = [[SCIColorMap alloc] initWithColors:colors andStops:@[@0.0, @0.2, @0.4, @0.6, @0.8, @1.0]];
_valuesArray = [NSMutableArray<SCIDoubleValues *> new];
for (int i = 0; i < SERIES_PER_PERIOD; i++) {
[_valuesArray addObject:[self createValues:i]];
}
self.heatmapColourMap.minimum = heatmapRenderableSeries.minimum;
self.heatmapColourMap.maximum = heatmapRenderableSeries.maximum;
self.heatmapColourMap.colourMap = heatmapRenderableSeries.colorMap;
[self.surface.xAxes add:xAxis];
[self.surface.yAxes add:yAxis];
[self.surface.renderableSeries add:heatmapRenderableSeries];
[self.surface.chartModifiers add:[SCDExampleBaseViewController createDefaultModifiers]];
[self.surface.chartModifiers add:[SCICursorModifier new]];
}
- (SCIDoubleValues *)createValues:(int)index {
SCIDoubleValues *values = [[SCIDoubleValues alloc] initWithCapacity:WIDTH * HEIGHT];
double angle = M_PI * 2.0 * index / SERIES_PER_PERIOD;
double cx = 150;
double cy = 100;
for (int x = 0; x < WIDTH; x++) {
for (int y = 0; y < HEIGHT; y++) {
double v = (1 + sin(x * 0.04 + angle)) * 50 + (1 + sin(y * 0.1 + angle)) * 50 * (1 + sin(angle * 2));
double r = sqrt((x - cx) * (x - cx) + (y - cy) * (y - cy));
double exp = MAX(0, 1 - r * 0.008);
[values add:v * exp + arc4random_uniform(50)];
}
}
return values;
}
- (void)updateHeatmapData:(NSTimer *)timer {
__weak typeof(self) wSelf = self;
[SCIUpdateSuspender usingWithSuspendable:self.surface withBlock:^{
SCIDoubleValues *values = wSelf.valuesArray[wSelf.timerIndex % SERIES_PER_PERIOD];
[wSelf.dataSeries updateZValues:values];
wSelf.timerIndex++;
}];
}
- (void)viewWillAppear:(BOOL)animated {
_timer = [NSTimer scheduledTimerWithTimeInterval:TIME_INTERVAL target:self selector:@selector(updateHeatmapData:) userInfo:nil repeats:YES];
}
- (void)viewDidDisappear:(BOOL)animated {
[_timer invalidate];
_timer = nil;
}
@end
//******************************************************************************
// SCICHART® Copyright SciChart Ltd. 2011-2019. All rights reserved.
//
// Web: http://www.scichart.com
// Support: support@scichart.com
// Sales: sales@scichart.com
//
// HeatmapChartView.swift is part of the SCICHART® Examples. Permission is hereby granted
// to modify, create derivative works, distribute and publish any part of this source
// code whether for commercial, private or personal use.
//
// The SCICHART® examples are distributed in the hope that they will be useful, but
// without any warranty. It is provided "AS IS" without warranty of any kind, either
// expressed or implied.
//******************************************************************************
class HeatmapChartView: SCDHeatmapChartViewControllerBase {
static let height: Int = 200
static let width: Int = 300
let seriesPerPeriod = 30
let timeInterval = 0.04
var _dataSeries = SCIUniformHeatmapDataSeries(xType: .int, yType: .int, zType: .double, xSize: width, ySize: height)
var _timerIndex: Int = 0
var timer: Timer!
var _running: Bool = false
var _valuesArray = [SCIDoubleValues]()
override func initExample() {
let xAxis = SCINumericAxis()
let yAxis = SCINumericAxis()
let colors = [SCIColor.fromARGBColorCode(0xFF00008B), SCIColor.fromARGBColorCode(0xFF6495ED), SCIColor.fromARGBColorCode(0xFF006400), SCIColor.fromARGBColorCode(0xFF7FFF00), .yellow, .red]
let heatmapRenderableSeries = SCIFastUniformHeatmapRenderableSeries()
heatmapRenderableSeries.dataSeries = _dataSeries
heatmapRenderableSeries.minimum = 0.0
heatmapRenderableSeries.maximum = 200.0
heatmapRenderableSeries.colorMap = SCIColorMap(colors: colors, andStops: [0.0, 0.2, 0.4, 0.6, 0.8, 1.0])
for i in 0 ..< seriesPerPeriod {
_valuesArray.append(createValues(index: i))
}
heatmapColourMap.minimum = heatmapRenderableSeries.minimum
heatmapColourMap.maximum = heatmapRenderableSeries.maximum
heatmapColourMap.colourMap = heatmapRenderableSeries.colorMap
surface.xAxes.add(xAxis)
surface.yAxes.add(yAxis)
surface.renderableSeries.add(heatmapRenderableSeries)
surface.chartModifiers.add(SCDExampleBaseViewController.createDefaultModifiers())
surface.chartModifiers.add(SCICursorModifier())
}
fileprivate func createValues(index: Int) -> SCIDoubleValues! {
let values = SCIDoubleValues(capacity: HeatmapChartView.width * HeatmapChartView.height)
let angle = .pi * 2.0 * Double(index) / Double(seriesPerPeriod)
let cx = 150.0
let cy = 100.0
for x in 0 ..< HeatmapChartView.width {
for y in 0 ..< HeatmapChartView.height {
let v = (1 + sin(Double(x) * 0.04 + angle)) * 50 + (1 + sin(Double(y) * 0.1 + angle)) * 50 * (1 + sin(angle * 2))
let r = sqrt((Double(x) - cx) * (Double(x) - cx) + (Double(y) - cy) * (Double(y) - cy))
let exp = max(0, 1 - r * 0.008)
values.add(v * exp + Double(arc4random_uniform(50)))
}
}
return values;
}
@objc func updateHeatmapData() {
SCIUpdateSuspender.usingWith(surface) {
let values = self._valuesArray[self._timerIndex % self.seriesPerPeriod]
self._dataSeries.update(z: values)
self._timerIndex += 1
}
}
override func viewWillAppear(_ animated: Bool) {
if timer == nil {
timer = Timer.scheduledTimer(timeInterval: timeInterval, target: self, selector: #selector(updateHeatmapData), userInfo: nil, repeats: true)
}
}
override func viewDidDisappear(_ animated: Bool) {
if timer != nil {
timer.invalidate()
timer = nil
}
}
}