Search Results for

    Show / Hide Table of Contents

    The CustomAnnotation

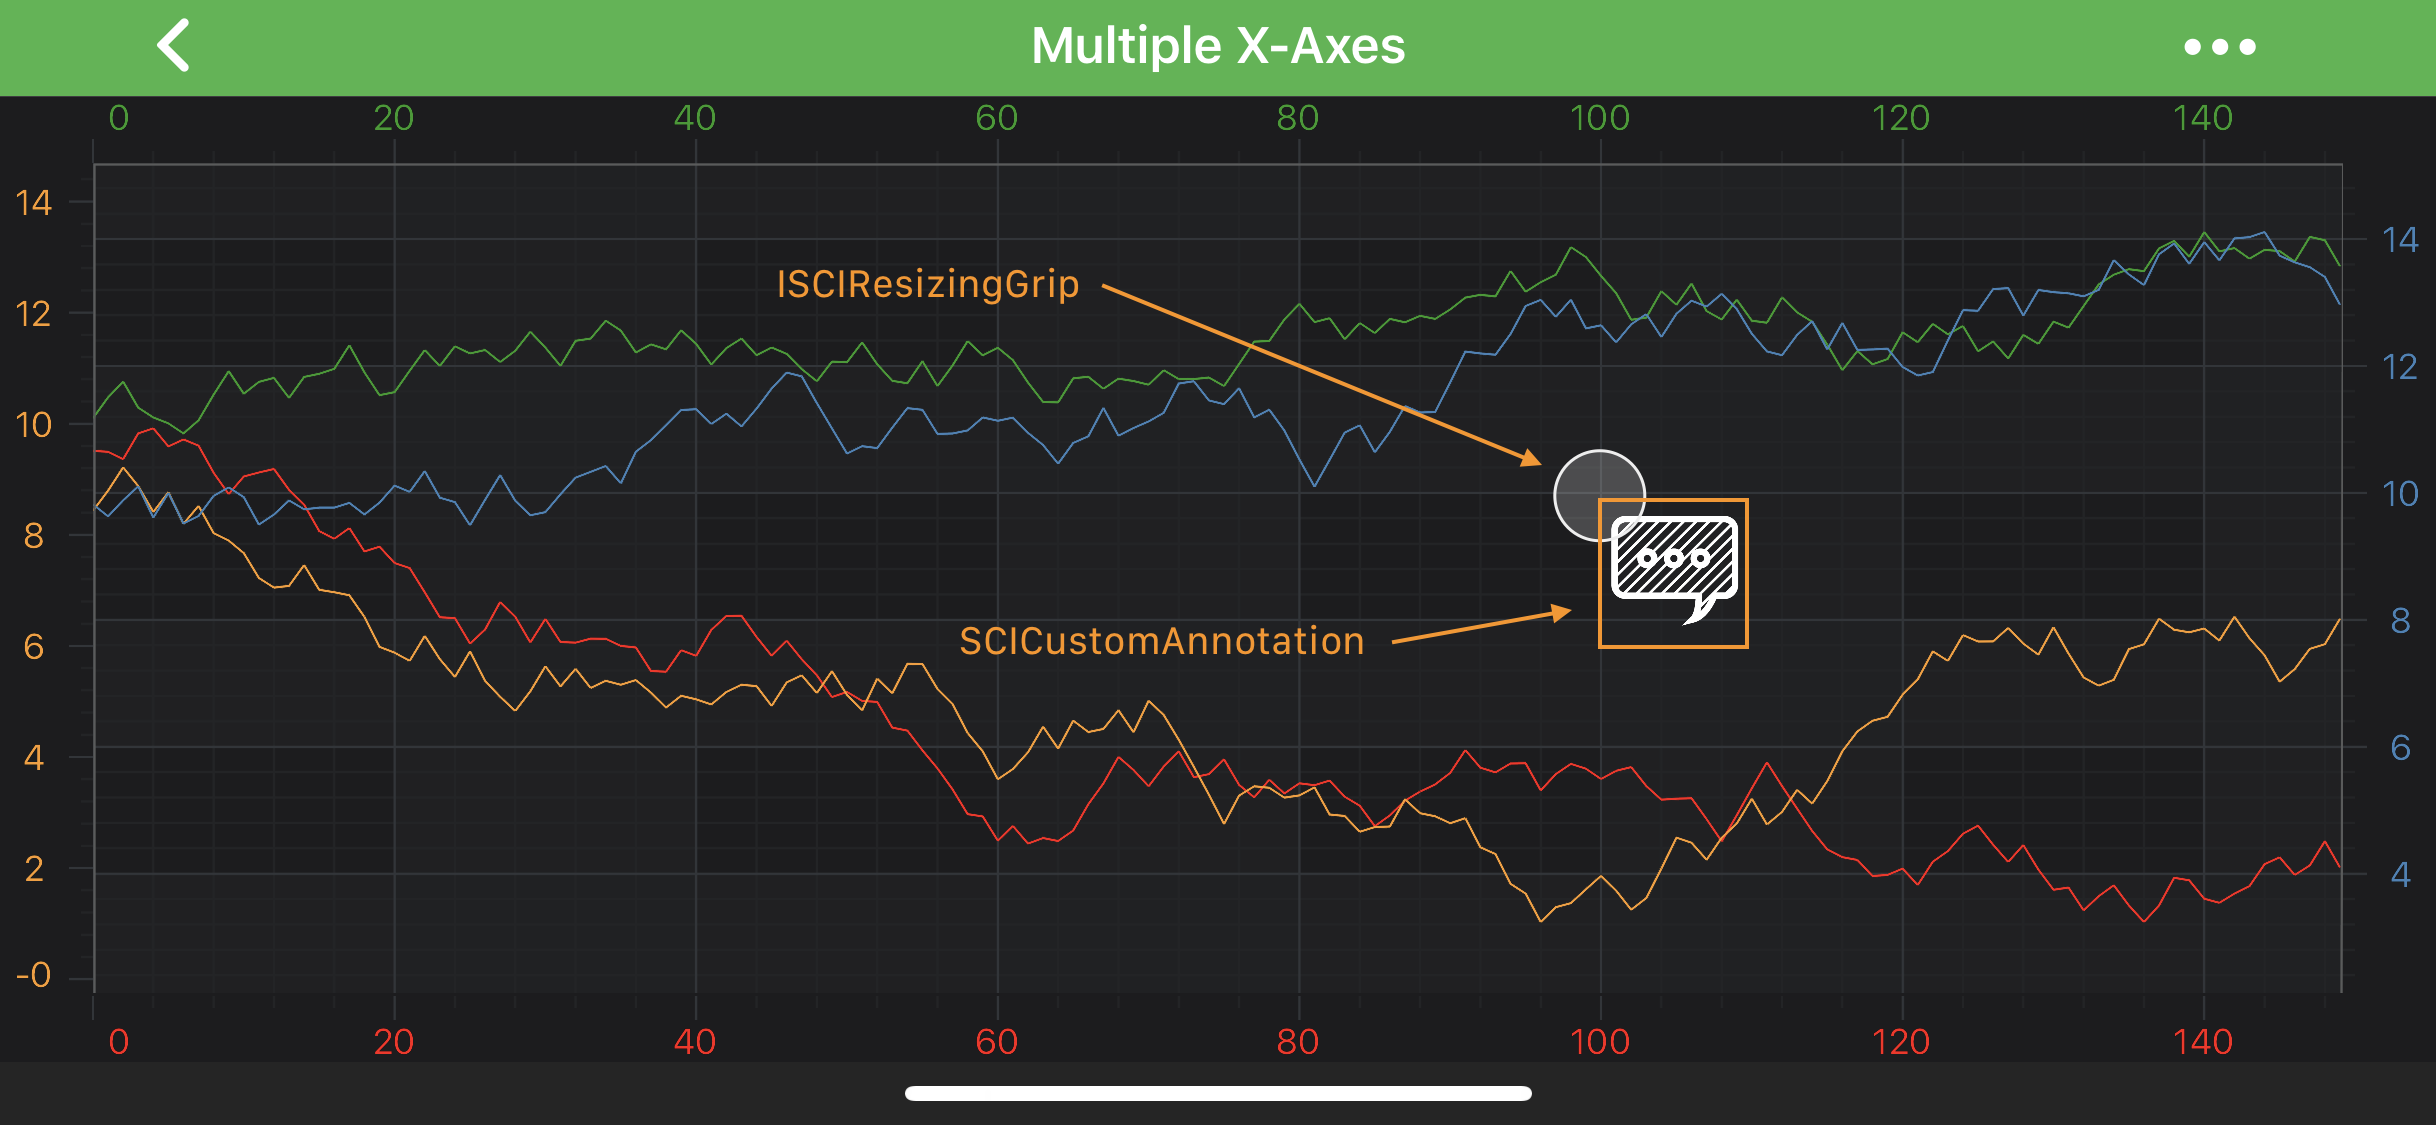
    The CustomAnnotation allows to place any Android View at a specific location on a chart:

    Custom Annotation

    Note

    Examples of the Annotations usage can be found in the SciChart Android Examples Suite as well as on GitHub:

    • Native Android Chart Annotations Example

    • Native Android Chart Interactive Annotations Example

    • Xamarin Android Chart Annotations Example

    • Xamarin Android Chart Interactive Annotations Example

    You can place any Android View by passing it into the setContentView(View view) method or an layout id into the setContentId(int layoutId) method..

    Position of the CustomAnnotation is defined by the X1 or Y1 coordinate, depending on the axis. Those values can be accessed via the x1 and y1 properties.

    Note

    The xAxisId and yAxisId must be supplied if you have axis with non-default Axis Ids, e.g. in multi-axis scenario.

    Also, because CustomAnnotation is derived from the AnchorPointAnnotation it can be aligned relative to the X1 or Y1 coordinate by setting the Anchor Points. For more information about the Anchor Points - refer to the corresponding section Annotations APIs article.

    Note

    To learn more about Annotations in general - please see the Common Annotation Features article.

    Create a CustomAnnotation

    A simple CustomAnnotation with an ImageView can be added onto a chart using the following code:

    • Java
    • Java with Builders API
    • Kotlin
    // assume the surface has been created and configured before
    // create a CustomAnnotation
    final CustomAnnotation customAnnotation = new CustomAnnotation(getActivity());
    
    // prepare an ImageView for the CustomAnnotation
    ImageView image = new ImageView(getActivity());
    image.setImageResource(R.drawable.my_custom_view);
    
    // supply it with ImageView
    customAnnotation.setContentView(image);
    
    // specify a desired position
    customAnnotation.setX1(4.2d);
    customAnnotation.setY1(2d);
    
    // Allow to interact with the annotation in run-time
    customAnnotation.setIsEditable(true);
    
    // in a multi-axis scenario, specify the XAxisId and YAxisId
    customAnnotation.setXAxisId("BottomAxisId");
    customAnnotation.setYAxisId("LeftAxisId");
    
    // add the annotation to the Annotations collection of the surface
    surface.getAnnotations().add(customAnnotation);
    
    // assume the surface has been created and configured before
    // prepare an ImageView for the CustomAnnotation
    ImageView image = new ImageView(getActivity());
    image.setImageResource(R.drawable.my_custom_view);
    
    // create a CustomAnnotation
    CustomAnnotation customAnnotation = sciChartBuilder.newCustomAnnotation()
            // supply it with ImageView
            .withContent(image)
            // specify a desired position
            .withPosition(4.2d, 2d)
            // allow to interact with the annotation in run-time
            .withIsEditable(true)
            // in a multi-axis scenario, specify the XAxisId and YAxisId
            .withXAxisId("BottomAxisId")
            .withYAxisId("LeftAxisId")
            .build();
    
    // add the annotation to the Annotations collection of the surface
    surface.getAnnotations().add(customAnnotation);
    
    // assume the surface has been created and configured before
    // create a CustomAnnotation
    val customAnnotation = CustomAnnotation(activity)
    
    // prepare an ImageView for the CustomAnnotation
    val image = ImageView(activity)
    image.setImageResource(R.drawable.my_custom_view)
    
    // supply it with ImageView
    customAnnotation.setContentView(image)
    
    // specify a desired position
    customAnnotation.x1 = 4.2
    customAnnotation.y1 = 2.0
    
    // Allow to interact with the annotation in run-time
    customAnnotation.setIsEditable(true)
    
    // in a multi-axis scenario, specify the XAxisId and YAxisId
    customAnnotation.xAxisId = "BottomAxisId"
    customAnnotation.yAxisId = "LeftAxisId"
    
    // add the annotation to the Annotations collection of the surface
    surface.annotations.add(customAnnotation)
    
    Note

    To learn more about other Annotation Types, available out of the box in SciChart, please find the comprehensive list in the Annotation APIs article.

    Back to top © 2011-2025 SciChart. All rights reserved. | sitemap.xml