The MeasureAnnotation
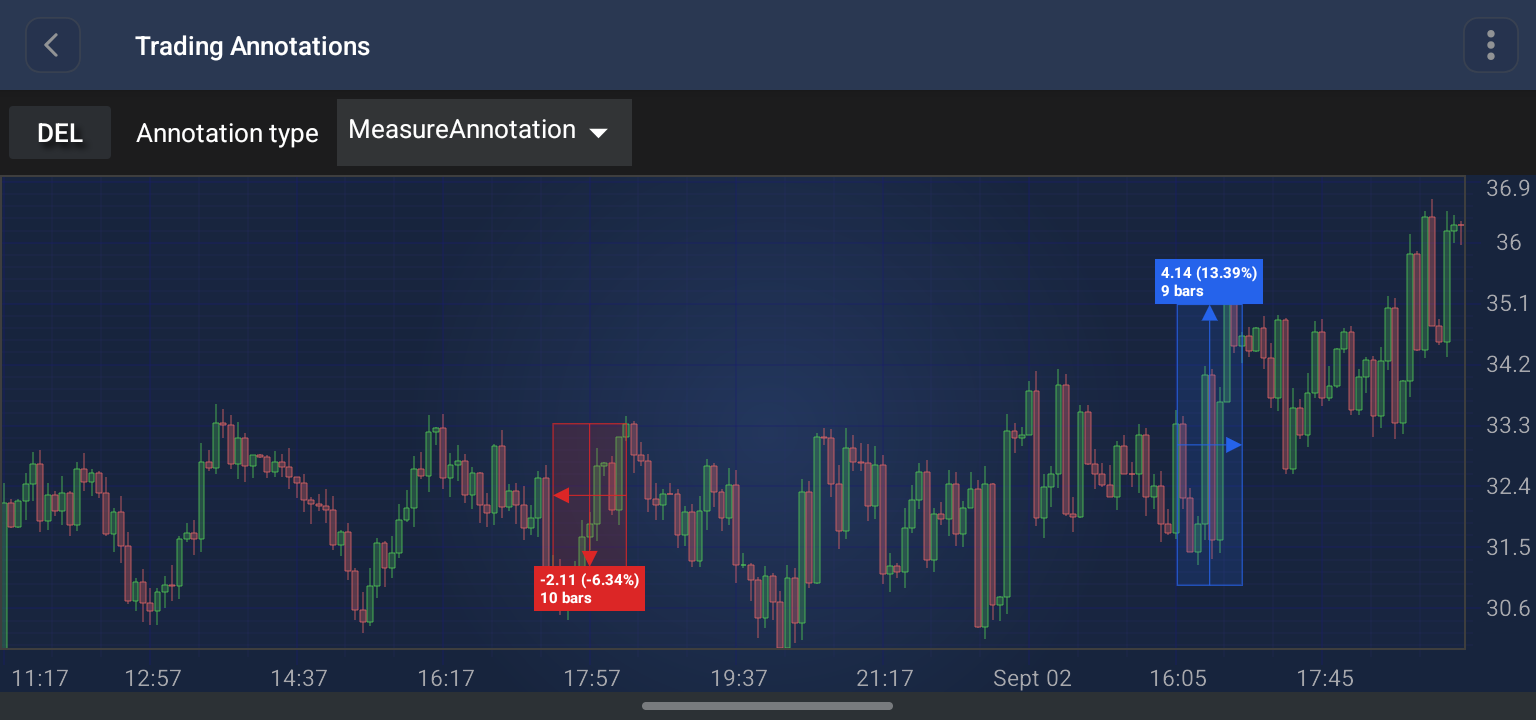
The MeasureAnnotation is a specialized trading annotation that measures the move between two points on the chart, reporting the price change, the percentage change and the number of bars between them.
Note
Examples of the Annotations usage can be found in the SciChart Android Examples Suite as well as on GitHub:
Structure and Points
The MeasureAnnotation is defined by two anchor points, which are the opposite corners of the measured region:
- Point 0: The start of the move - the reference price.
- Point 1: The end of the move - the measured price.
It renders as a filled and stroked rectangle spanning both points, with a horizontal and a vertical arrowed line crossing through its center, plus a floating stat label.
The color of the annotation is chosen automatically from the direction of the move:
- if the Y value of Point 1 is greater than or equal to the Y value of Point 0, the move is growing and the growingColor is used;
- otherwise the move is declining and the decliningColor is used.
The label is anchored above the top of the box for a growing move, and below its bottom for a declining move.
The Stat Label
The label reports, on separate lines:
- the price change and the percentage change, formatted as
delta (percent%)- the percentage is relative to the Y value of Point 0; - the change scaled by the yValueScaleFactor, suffixed with
bp- shown only when the factor is not1.0. This is useful for instruments quoted in basis points or pips; - the number of bars spanned by the measurement, when it can be determined.
The bar count is resolved in one of two ways:
- On a category axis, the base-point X values are already bar indices, so the count is the difference between them.
- On a value axis (numeric, date), the count requires a snapSeries to be set - the indices of the two X values are looked up in that series' X values. Without a snap series, the bar count line is omitted.
Snapping to Data Points
If a renderable series is supplied via snapSeries, both anchor points snap to the nearest rendered data point (the bar's X value and close price) whenever the touch position is within snapToDataPointRadius pixels of it. Snapping applies on creation, on vertex-grip drag and on whole-annotation drag.
Snapping requires the series to be backed by an OHLC data series - it is skipped for other data series types. It can be turned off without clearing the series via snapToDataPointEnabled.
Appearance Properties
The following properties can be used to customize the appearance and behavior of the MeasureAnnotation:
| Property | Description |
|---|---|
| growingColor | The color used for the box, the arrows and the label background when the move is upwards. Defaults to #2563EB (blue). |
| decliningColor | The color used for the box, the arrows and the label background when the move is downwards. Defaults to #DC2626 (red). |
| fillOpacity | The opacity of the box fill, in the [0 to 1] range. Defaults to 0.16. |
| strokeThickness | The thickness of the box outline and of the arrowed lines. |
| showArrows | Shows or hides the horizontal and vertical arrowed lines. Defaults to true. |
| yValueScaleFactor | A multiplier applied to the price change to produce the extra bp line in the label. Defaults to 1.0 - the line is not shown. |
| snapSeries | The renderable series that anchor points snap to, and from which the bar count is resolved. Pass null to disable snapping. |
| snapToDataPointEnabled | Enables or disables snapping without clearing the snapSeries. Defaults to true. |
| snapToDataPointRadius | The hit-test radius, in pixels, within which an anchor point snaps to a data point. Defaults to 10. |
| labelFontSize | The font size of the label text. Defaults to 15. |
| labelTextColor | The color of the label text. Defaults to white. |
| labelBackgroundColor | An override for the label background color. Pass null to have the background follow the growing / declining color. |
Note
The xAxisId and yAxisId must be supplied if you have axis with non-default Axis Ids, e.g. in multi-axis scenario.
Create a MeasureAnnotation
A MeasureAnnotation can be added onto a chart using the following code:
// Assume a surface has been created and configured somewhere
// Create a MeasureAnnotation
final MeasureAnnotation measureAnnotation = new MeasureAnnotation(getContext());

// Allow to interact with the annotation in run-time
measureAnnotation.setIsEditable(true);

// Specify the colors used for the upwards (growing) and the downwards (declining) move
measureAnnotation.setGrowingColor(Color.BLUE);
measureAnnotation.setDecliningColor(Color.RED);

// Specify the box appearance and show the measuring arrows
measureAnnotation.setFillOpacity(0.2f);
measureAnnotation.setStrokeThickness(1.5f);
measureAnnotation.setShowArrows(true);

// Optionally snap both anchor points to the closest data point of an OHLC series.
// The series is also used to resolve the bar count reported by the label
// measureAnnotation.setSnapSeries(candlestickSeries);
// measureAnnotation.setSnapToDataPointRadius(15f);

// Add 2 points which define the opposite corners of the measured region
measureAnnotation.setBasePoint(10, 30.6); // Point 0 - the start of the move
measureAnnotation.setBasePoint(30, 32.1); // Point 1 - the end of the move

// Add the annotation to the AnnotationsCollection of a surface
surface.getAnnotations().add(measureAnnotation);
Note
For interactive creation of the MeasureAnnotation, use the MeasureAnnotationCreationModifier.
Note
To learn more about other Annotation Types, available out of the box in SciChart, please find the comprehensive list in the Annotation APIs article.