The StopLossTakeProfitAnnotation
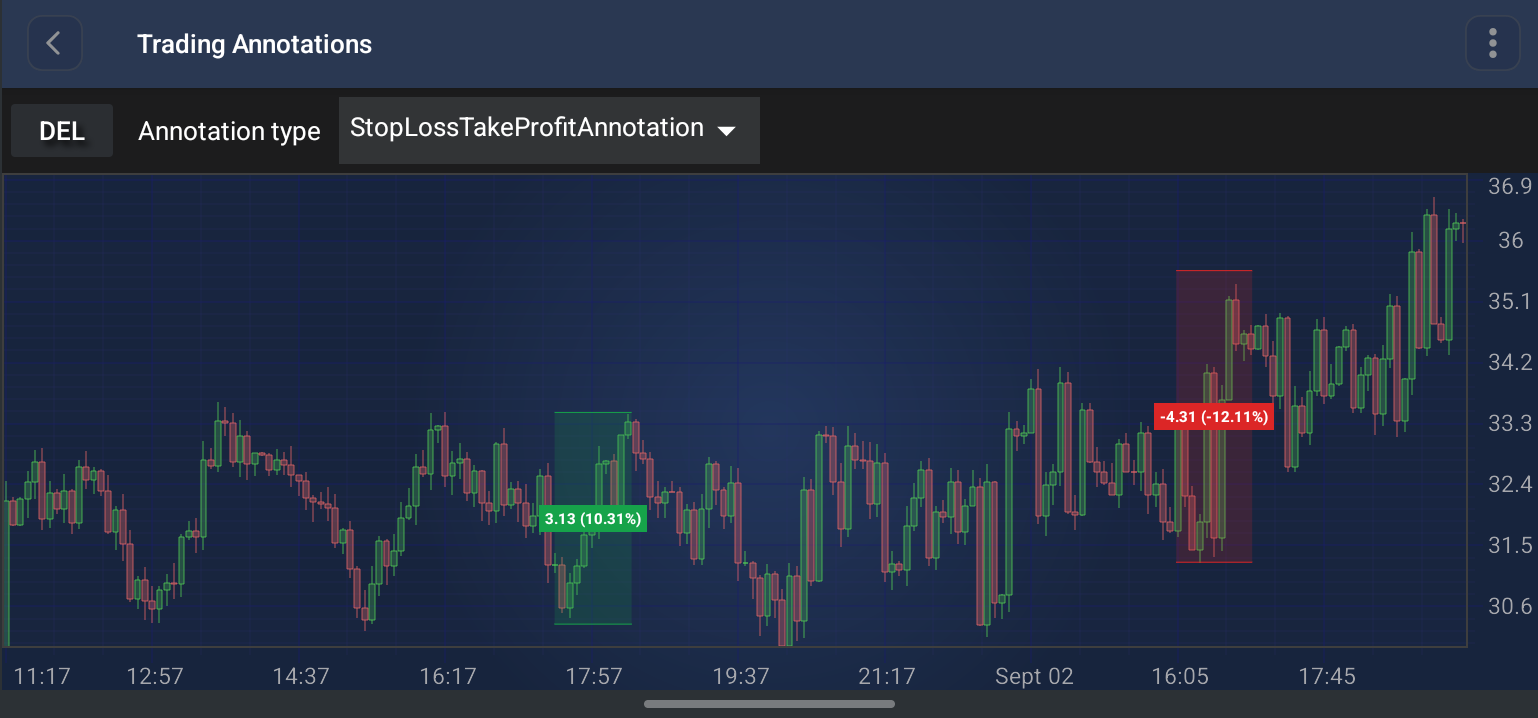
The StopLossTakeProfitAnnotation is a specialized trading annotation that draws a rectangular price zone between two points and automatically colors it as a take-profit or a stop-loss band, depending on the direction of the move.
Note
Examples of the Annotations usage can be found in the SciChart Android Examples Suite as well as on GitHub:
Structure and Points
The StopLossTakeProfitAnnotation is a simple two-point annotation - the two anchor points are just opposite corners of the zone, not an entry/stop/target composite:
- Point 0: The first corner of the zone - treated as the reference (entry) price.
- Point 1: The opposite corner of the zone - treated as the target price.
The zone renders as a filled rectangle with only its top and bottom edges stroked (the left and right edges are not stroked). When the zone has zero height, the redundant bottom stroke is hidden.
The color of the zone is chosen automatically from the vertical direction of the move:
- if the Y value of Point 1 is greater than or equal to the Y value of Point 0, the zone is a take-profit zone and is drawn with the takeProfitColor;
- otherwise the zone is a stop-loss zone and is drawn with the stopLossColor.
The Distance Label
A label is placed in the center of the zone showing the absolute and the percentage price change between the two points, formatted as delta (percent%) - for example 1.20 (3.64%). The percentage is calculated relative to the Y value of Point 0.
The label can be turned off with the showDistanceLabel property.
Appearance Properties
The following properties can be used to customize the appearance of the StopLossTakeProfitAnnotation:
| Property | Description |
|---|---|
| takeProfitColor | The color used for the fill, the edge strokes and the label background when the move is upwards. Defaults to #16A34A (green). |
| stopLossColor | The color used for the fill, the edge strokes and the label background when the move is downwards. Defaults to #DC2626 (red). |
| fillOpacity | The opacity of the zone fill, in the [0 to 1] range. Defaults to 0.18. |
| strokeThickness | The thickness of the top and the bottom edge strokes. |
| strokeDashArray | Makes the edge strokes dashed. Accepts an array of on/off lengths, e.g. new float[] { 6f, 3f }. Defaults to null - a solid stroke. |
| showDistanceLabel | Shows or hides the price change label. Defaults to true. |
| labelFontSize | The font size of the label text. Defaults to 15. |
| labelTextColor | The color of the label text. Defaults to white. |
| labelBackgroundColor | An override for the label background color. Pass null to have the background follow the take-profit / stop-loss color. |
Note
The xAxisId and yAxisId must be supplied if you have axis with non-default Axis Ids, e.g. in multi-axis scenario.
Create a StopLossTakeProfitAnnotation
A StopLossTakeProfitAnnotation can be added onto a chart using the following code:
// Assume a surface has been created and configured somewhere
// Create a StopLossTakeProfitAnnotation
final StopLossTakeProfitAnnotation stopLossTakeProfitAnnotation = new StopLossTakeProfitAnnotation(getContext());

// Allow to interact with the annotation in run-time
stopLossTakeProfitAnnotation.setIsEditable(true);

// Specify the colors used for the upwards (take-profit) and the downwards (stop-loss) zone
stopLossTakeProfitAnnotation.setTakeProfitColor(Color.GREEN);
stopLossTakeProfitAnnotation.setStopLossColor(Color.RED);

// Specify the zone appearance
stopLossTakeProfitAnnotation.setFillOpacity(0.2f);
stopLossTakeProfitAnnotation.setStrokeThickness(2f);
stopLossTakeProfitAnnotation.setStrokeDashArray(new float[]{6f, 3f});

// Show the price change label in the center of the zone
stopLossTakeProfitAnnotation.setShowDistanceLabel(true);

// Add 2 points which define the opposite corners of the zone.
// Here the second point is above the first one, so this is a take-profit zone
stopLossTakeProfitAnnotation.setBasePoint(10, 33.0); // Point 0 - the reference price
stopLossTakeProfitAnnotation.setBasePoint(30, 34.2); // Point 1 - the target price

// Add the annotation to the AnnotationsCollection of a surface
surface.getAnnotations().add(stopLossTakeProfitAnnotation);
Note
For interactive creation of the StopLossTakeProfitAnnotation, use the StopLossTakeProfitAnnotationCreationModifier.
Note
To learn more about other Annotation Types, available out of the box in SciChart, please find the comprehensive list in the Annotation APIs article.