Axis Styling - Grid Lines, Ticks, Axis Bands and Axis Borders
As mentioned in previous article on Axis Styling - Title and Labels - each and every aspect of the axis can be styled. The Axis is responsible for drawing the following parts:
- Title
- Axis Labels
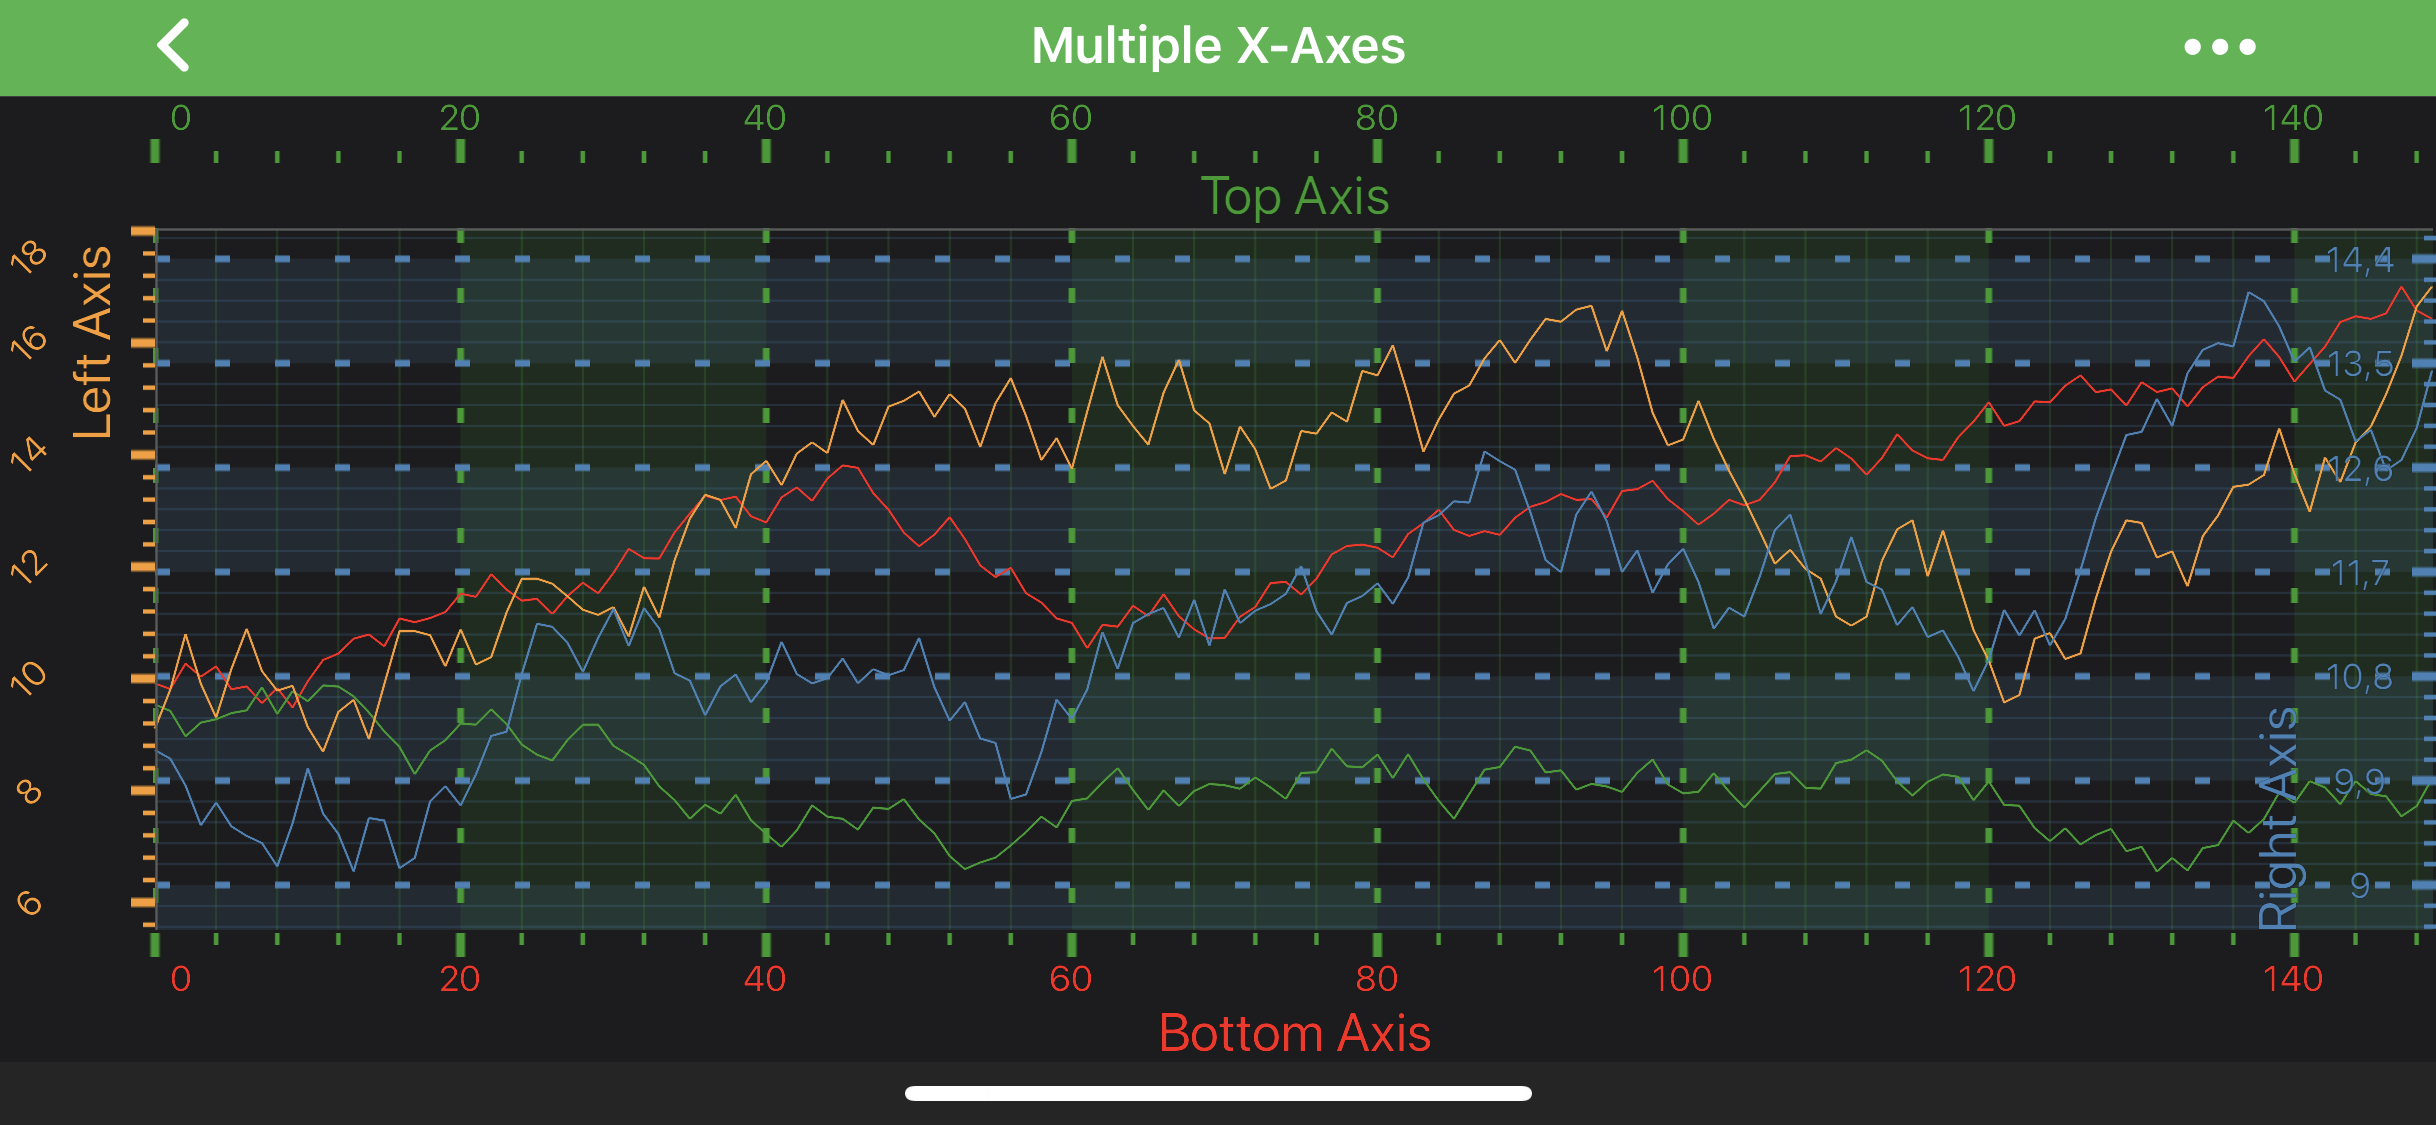
- Tick Lines - small marks on the outside of an axis next to labels
- Grid Lines - major and minor
- Axis Bands - shading between the major grid-lines
- Axis Borders - borders around the axis area
In this article we are going to focus on Tick Lines, Gridlines and Axis Bands styling. So let's pick up where we left off in previous article and proceed with some styling.
Note
It's important to mention, that X-Axis is responsible for vertical grid-lines and bands, whereas Y-Axis - for horizontal ones.
Note
In SciChart, almost all styling methods expect an instance of either PenStyle or BrushStyle to be passed in. Those that deals with text styling, expect an instance of a FontStyle. To learn more about how to utilize them, please refer to the PenStyle, BrushStyle and FontStyle article.
Axis Ticks
Axis Ticks can be styled via applying the PenStyle onto the minorTickLineStyle property to affect Minor ticks, or onto the majorTickLineStyle - for the Major ticks. Ticks Length can also be controlled via majorTickLineLength and minorTickLineLength properties.
Also, ticks can be completely hidden or shown on an axis via the drawMinorTicks and drawMajorTicks properties.
final NumericAxis axis = new NumericAxis(getContext());
axis.setMinorTickLineStyle(new SolidPenStyle(0xFF279B27, true, 2f, null));
axis.setMajorTickLineStyle(new SolidPenStyle(0xFF279B27, true, 4f, null));
Grid Lines
Grid Lines are styled the same way as Axis ticks - use the following properties to affect gridlines rendering:
final NumericAxis axis = new NumericAxis(getContext());
axis.setMinorGridLineStyle(new SolidPenStyle(0x33279B27, true, 1f, null));
axis.setMajorGridLineStyle(new SolidPenStyle(0xFF279B27, true, 3f, new float[]{5f, 15f}));
Axis Bands
The colored strips between Major grid lines are called Axis Bands. They can be made visible or hidden via the drawMajorBands property. The fill can be changed via the axisBandsStyle property, that expects a BrushStyle:
final NumericAxis axis = new NumericAxis(getContext());
axis.setAxisBandsStyle(new SolidBrushStyle(0x22279B27));
Axis Borders
You can style your axis borders with the help of the AxisBorderStyle class. This class allows you to set the border color, thickness, and which sides of the axis should have borders.
// Assume xAxis has been created and configured somewhere
xAxis.setAxisBorderStyle(new AxisBorderStyle(0xFF4FBEE6, true, 3));

// Alternatively, set individual thickness for each side, you can set 0 thickness for sides you don't want to style
xAxis.setAxisBorderStyle(new AxisBorderStyle(0xFF4FBEE6, true, 3f, 0f, 3f, 0f));