Search Results for

    Show / Hide Table of Contents

    Axis Styling - Title and Labels

    Each and Every aspect of the axis can be styled. The Axis is responsible for drawing the following parts:

    • Title
    • Axis Labels
    • Tick Lines - small marks on the outside of an axis next to labels
    • Gridlines - major and minor
    • Axis Bands - shading between the major gridlines

    In this article we are going to focus on Axis Title and Axis Labels styling.

    Note

    In SciChart, almost all styling methods expect an instance of either PenStyle or BrushStyle to be passed in. Those that deal with text styling, expect an instance of a FontStyle. To learn more about how to utilize them, please refer to the PenStyle, BrushStyle and FontStyle article.

    Axis Title

    The FontStyle object can be applied to axis labels via the titleStyle property.

    In addition to font style, there are several options available for positioning of the title, including inside the axis area:

    • axisTitlePlacement - allows placing a title inside or outside the axis area via the AxisTitlePlacement.
    • axisTitleOrientation - changes the orientation of the title, making it horizontal or vertical via the AxisTitleOrientation enum.
    • axisTitleGravity - the desired alignment of the title via the Gravity.
    • axisTitleMargins - margins could be applied to omit overlapping with labels, while using AxisTitlePlacement.Inside mode.

    Axis Labels

    The tick labels can be hidden or shown on an axis via the drawLabels property. To make the labels at the edges to always appear inside the axis area, use the autoFitMarginalLabels property.

    The FontStyle object can be applied to axis labels via the tickLabelStyle property.

    Also, there is AxisTickLabelStyle available for controlling alignment, margin and rotation angle of each Label during rendering.

    Let's try to modify our Multiple X-Axis Chart Example with the following code, and see what we can achieve:

    • Java
    • Java with Builders API
    • Kotlin
    final NumericAxis xTopAxis = new NumericAxis(getContext());
    xTopAxis.setAxisId("TopAxisId");
    xTopAxis.setAxisAlignment(AxisAlignment.Top);
    xTopAxis.setAxisTitle("Top Axis");
    xTopAxis.setAxisTitleGravity(Gravity.BOTTOM);
    xTopAxis.setTitleStyle(new FontStyle(18, 0xFF279B27));
    xTopAxis.setTickLabelStyle(new FontStyle(12, 0xFF279B27));
    
    final NumericAxis xBottomAxis = new NumericAxis(getContext());
    xBottomAxis.setAxisId("BottomAxisId");
    xBottomAxis.setAxisAlignment(AxisAlignment.Bottom);
    xBottomAxis.setAxisTitle("Bottom Axis");
    xBottomAxis.setTitleStyle(new FontStyle(18, 0xFFFF1919));
    xBottomAxis.setTickLabelStyle(new FontStyle(12, 0xFFFF1919));
    
    final NumericAxis yLeftAxis = new NumericAxis(getContext());
    yLeftAxis.setAxisId("LeftAxisId");
    yLeftAxis.setGrowBy(new DoubleRange(0.1, 0.1));
    yLeftAxis.setAxisAlignment(AxisAlignment.Left);
    yLeftAxis.setAxisTitle("Left Axis");
    yLeftAxis.setAxisTitleGravity(Gravity.TOP);
    yLeftAxis.setAxisTitlePlacement(AxisTitlePlacement.Inside);
    yLeftAxis.setAxisTitleMargins(20, 5, 0, 0);
    yLeftAxis.setTitleStyle(new FontStyle(18, 0xFFFC9C29));
    yLeftAxis.setTickLabelStyle(new FontStyle(12, 0xFFFC9C29));
    yLeftAxis.setAxisTickLabelStyle(new AxisTickLabelStyle(Gravity.CENTER, 5, 0, 5, 0));
    
    final NumericAxis yRightAxis = new NumericAxis(getContext());
    yRightAxis.setAxisId("RightAxisId");
    yRightAxis.setGrowBy(new DoubleRange(0.1, 0.1));
    yRightAxis.setAxisAlignment(AxisAlignment.Right);
    yRightAxis.setIsCenterAxis(true);
    yRightAxis.setAxisTitle("Right Axis");
    yRightAxis.setAxisTitleGravity(Gravity.BOTTOM);
    yRightAxis.setAxisTitlePlacement(AxisTitlePlacement.Left);
    yRightAxis.setTitleStyle(new FontStyle(18, 0xFF4083B7));
    yRightAxis.setTickLabelStyle(new FontStyle(12, 0xFF4083B7));
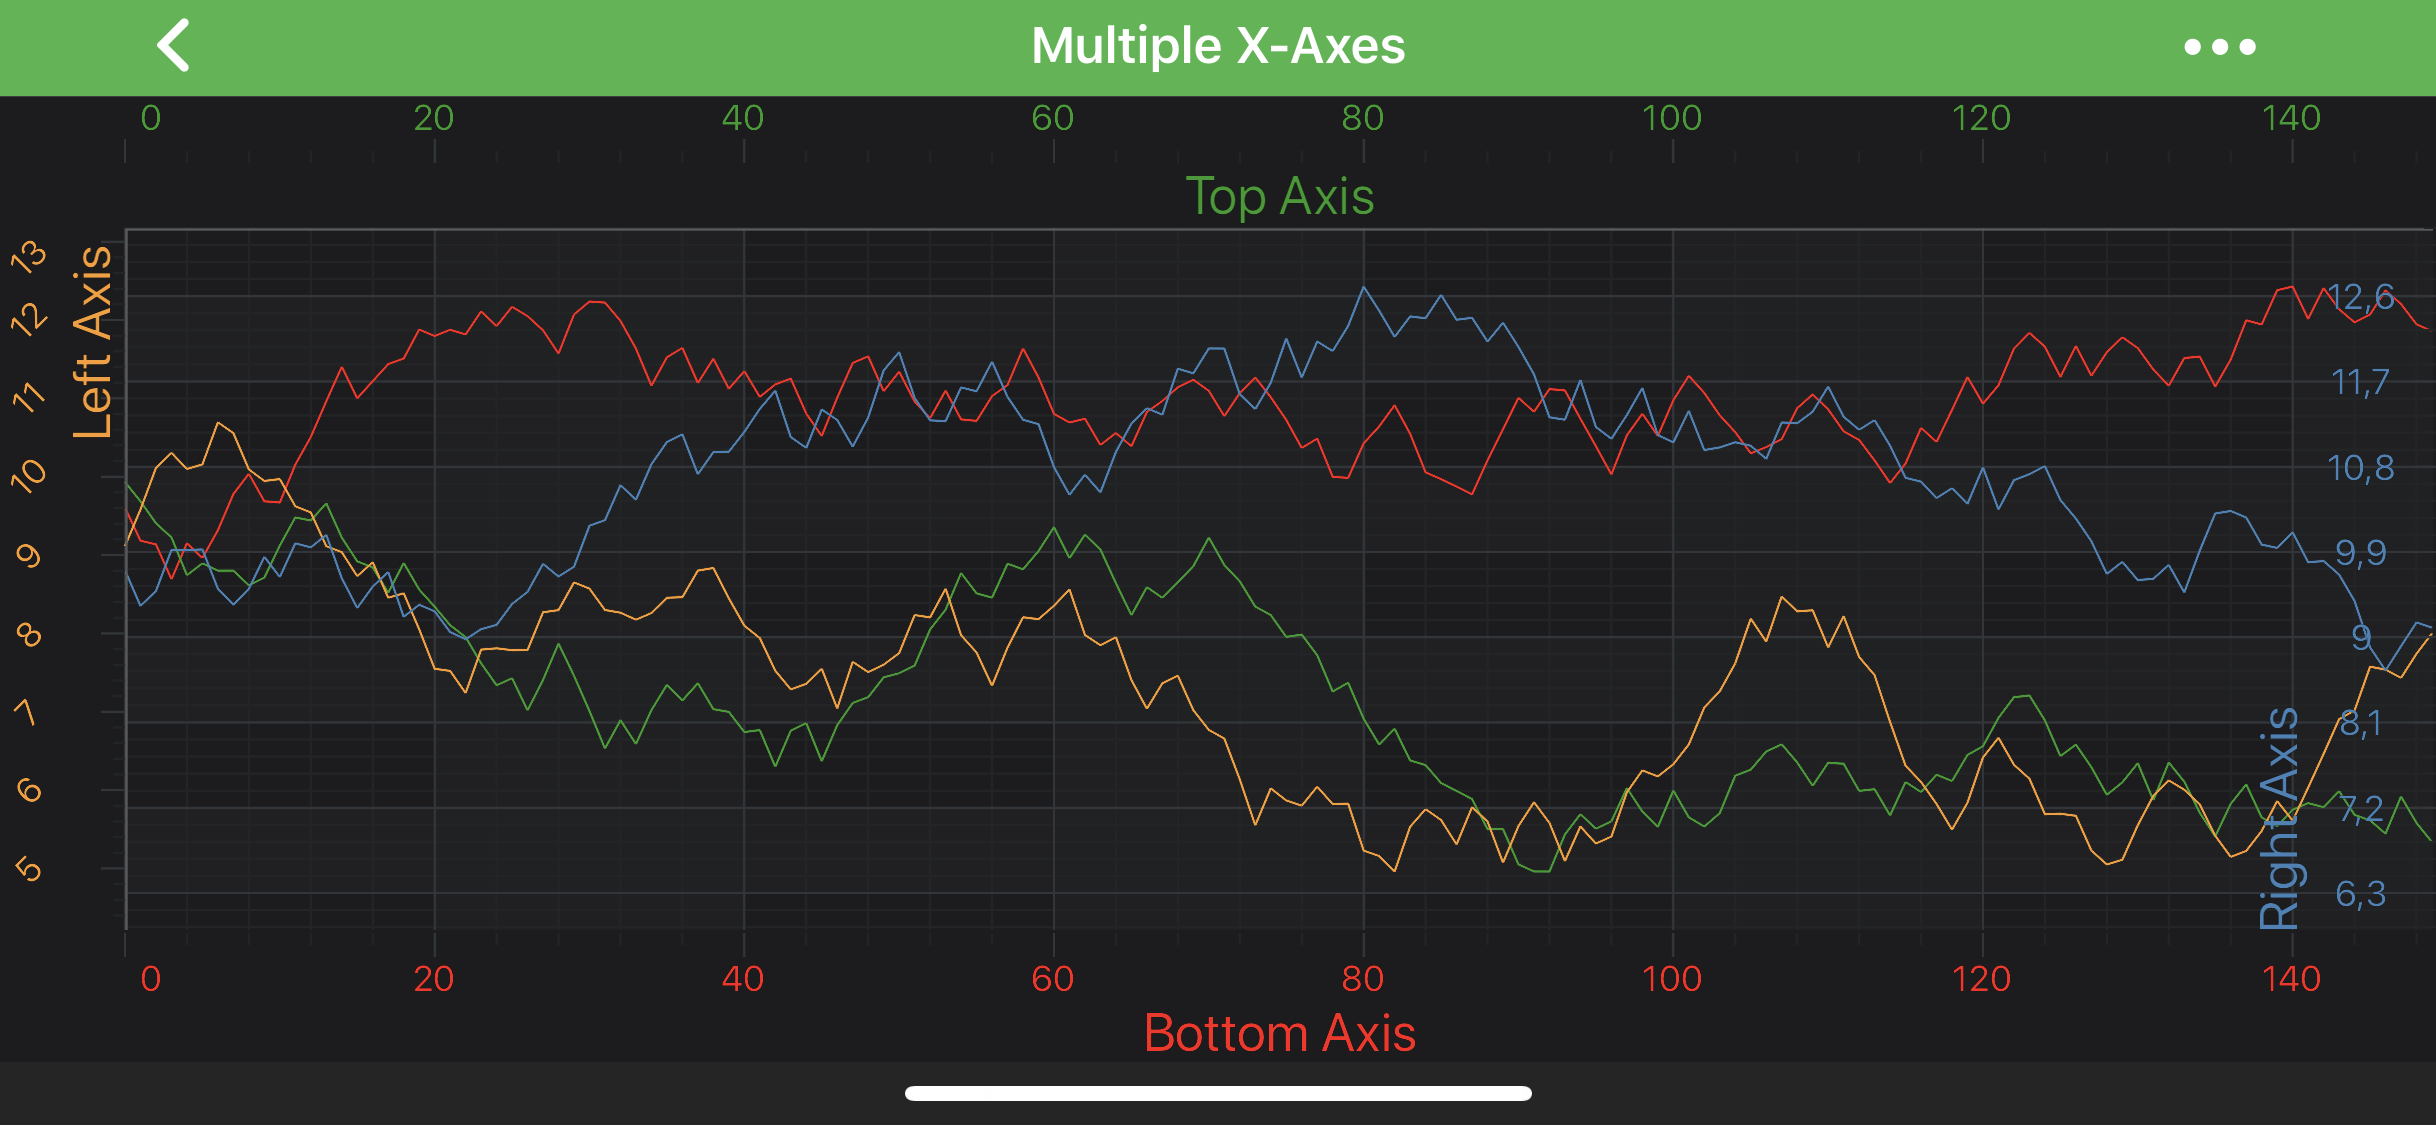
    
    final NumericAxis xTopAxis = sciChartBuilder.newNumericAxis()
            .withAxisId("TopAxisId")
            .withAxisAlignment(AxisAlignment.Top)
            .withAxisTitle("Top Axis")
            .withAxisTitleStyle(new FontStyle(18, 0xFF279B27))
            .withTickLabelStyle(new FontStyle(12, 0xFF279B27))
            .build();
    xTopAxis.setAxisTitleGravity(Gravity.BOTTOM);
    
    final NumericAxis xBottomAxis = sciChartBuilder.newNumericAxis()
            .withAxisId("BottomAxisId")
            .withAxisAlignment(AxisAlignment.Bottom)
            .withAxisTitle("Bottom Axis")
            .withAxisTitleStyle(new FontStyle(18, 0xFFFF1919))
            .withTickLabelStyle(new FontStyle(12, 0xFFFF1919))
            .build();
    
    final NumericAxis yLeftAxis = sciChartBuilder.newNumericAxis()
            .withAxisId("LeftAxisId")
            .withGrowBy(new DoubleRange(0.1, 0.1))
            .withAxisAlignment(AxisAlignment.Left)
            .withAxisTitle("Left Axis")
            .withAxisTitlePlacement(AxisTitlePlacement.Inside)
            .withAxisTitleMargin(20, 5, 0, 0)
            .withAxisTitleStyle(new FontStyle(18, 0xFFFC9C29))
            .withTickLabelStyle(new FontStyle(12, 0xFFFC9C29))
            .build();
    yLeftAxis.setAxisTitleGravity(Gravity.TOP);
    yLeftAxis.setAxisTickLabelStyle(new AxisTickLabelStyle(Gravity.CENTER, 5, 0, 5, 0));
    
    final NumericAxis yRightAxis = sciChartBuilder.newNumericAxis()
            .withAxisId("RightAxisId")
            .withGrowBy(new DoubleRange(0.1, 0.1))
            .withAxisAlignment(AxisAlignment.Right)
            .withIsCenterAxis(true)
            .withAxisTitle("Right Axis")
            .withAxisTitlePlacement(AxisTitlePlacement.Left)
            .withAxisTitleStyle(new FontStyle(18, 0xFF4083B7))
            .withTickLabelStyle(new FontStyle(12, 0xFF4083B7))
            .build();
    yRightAxis.setAxisTitleGravity(Gravity.BOTTOM);
    
    val xTopAxis = NumericAxis(context)
    xTopAxis.axisId = "TopAxisId"
    xTopAxis.axisAlignment = AxisAlignment.Top
    xTopAxis.axisTitle = "Top Axis"
    xTopAxis.axisTitleGravity = Gravity.BOTTOM
    xTopAxis.titleStyle = FontStyle(18f, -0xd864d9)
    xTopAxis.tickLabelStyle = FontStyle(12f, -0xd864d9)
    
    val xBottomAxis = NumericAxis(context)
    xBottomAxis.axisId = "BottomAxisId"
    xBottomAxis.axisAlignment = AxisAlignment.Bottom
    xBottomAxis.axisTitle = "Bottom Axis"
    xBottomAxis.titleStyle = FontStyle(18f, -0xe6e7)
    xBottomAxis.tickLabelStyle = FontStyle(12f, -0xe6e7)
    
    val yLeftAxis = NumericAxis(context)
    yLeftAxis.axisId = "LeftAxisId"
    yLeftAxis.growBy = DoubleRange(0.1, 0.1)
    yLeftAxis.axisAlignment = AxisAlignment.Left
    yLeftAxis.axisTitle = "Left Axis"
    yLeftAxis.axisTitleGravity = Gravity.TOP
    yLeftAxis.axisTitlePlacement = AxisTitlePlacement.Inside
    yLeftAxis.setAxisTitleMargins(20, 5, 0, 0)
    yLeftAxis.titleStyle = FontStyle(18f, -0x363d7)
    yLeftAxis.tickLabelStyle = FontStyle(12f, -0x363d7)
    yLeftAxis.axisTickLabelStyle = AxisTickLabelStyle(Gravity.CENTER, 5, 0, 5, 0)
    
    val yRightAxis = NumericAxis(context)
    yRightAxis.axisId = "RightAxisId"
    yRightAxis.growBy = DoubleRange(0.1, 0.1)
    yRightAxis.axisAlignment = AxisAlignment.Right
    yRightAxis.setIsCenterAxis(true)
    yRightAxis.axisTitle = "Right Axis"
    yRightAxis.axisTitleGravity = Gravity.BOTTOM
    yRightAxis.axisTitlePlacement = AxisTitlePlacement.Left
    yRightAxis.titleStyle = FontStyle(18f, -0xbf7c49)
    yRightAxis.tickLabelStyle = FontStyle(12f, -0xbf7c49)
    

    Title Positioning

    Note

    You might notice, that Right Axis title, labels and ticks are placed inside the chart area. This behaviour is controlled by isCenterAxis. To learn more, please refer to Axis Placement article.

    Back to top © 2011-2025 SciChart. All rights reserved. | sitemap.xml