The Column 3D Chart Type
The 3D Column Charts are provided by the ColumnRenderableSeries3D class.
Note
Examples for the Column Series 3D can be found in the SciChart Android Examples Suite as well as on GitHub:
Create a Column Series 3D
In SciChart you can achieve either Uniform or Non-Uniform Column Series 3D. Both are provided by the ColumnRenderableSeries3D but underlying IDataSeries3D<TX,TY,TZ> is different.
The Column Series 3D can be configured via the following properties:
| Property | Description |
|---|---|
| fill | allows to specify the fill color for the column shapes. |
| dataPointWidth | defines the fraction of available space each column should occupy in X and Z dimensions. Should be in [0.0...1.0] range. |
| dataPointWidthX | defines the fraction of available space each column should occupy in X dimension. Should be in [0.0...1.0] range. |
| dataPointWidthZ | defines the fraction of available space each column should occupy in Z dimension. Should be in [0.0...1.0] range. |
| columnSpacingMode | allows to specify whether the column size should be fixed or max available while not overlapping with each other. Expects ColumnSpacingMode enumeration. |
| columnFixedSize | allows to specify the size for column while using the ColumnSpacingMode.FixedSize mode. |
| columnShape | allows to change the columns shape. See the 3D Column Shapes section. |
Note
The dataPointWidth's of columns are set as a ratio of the available space between the neighboring points.
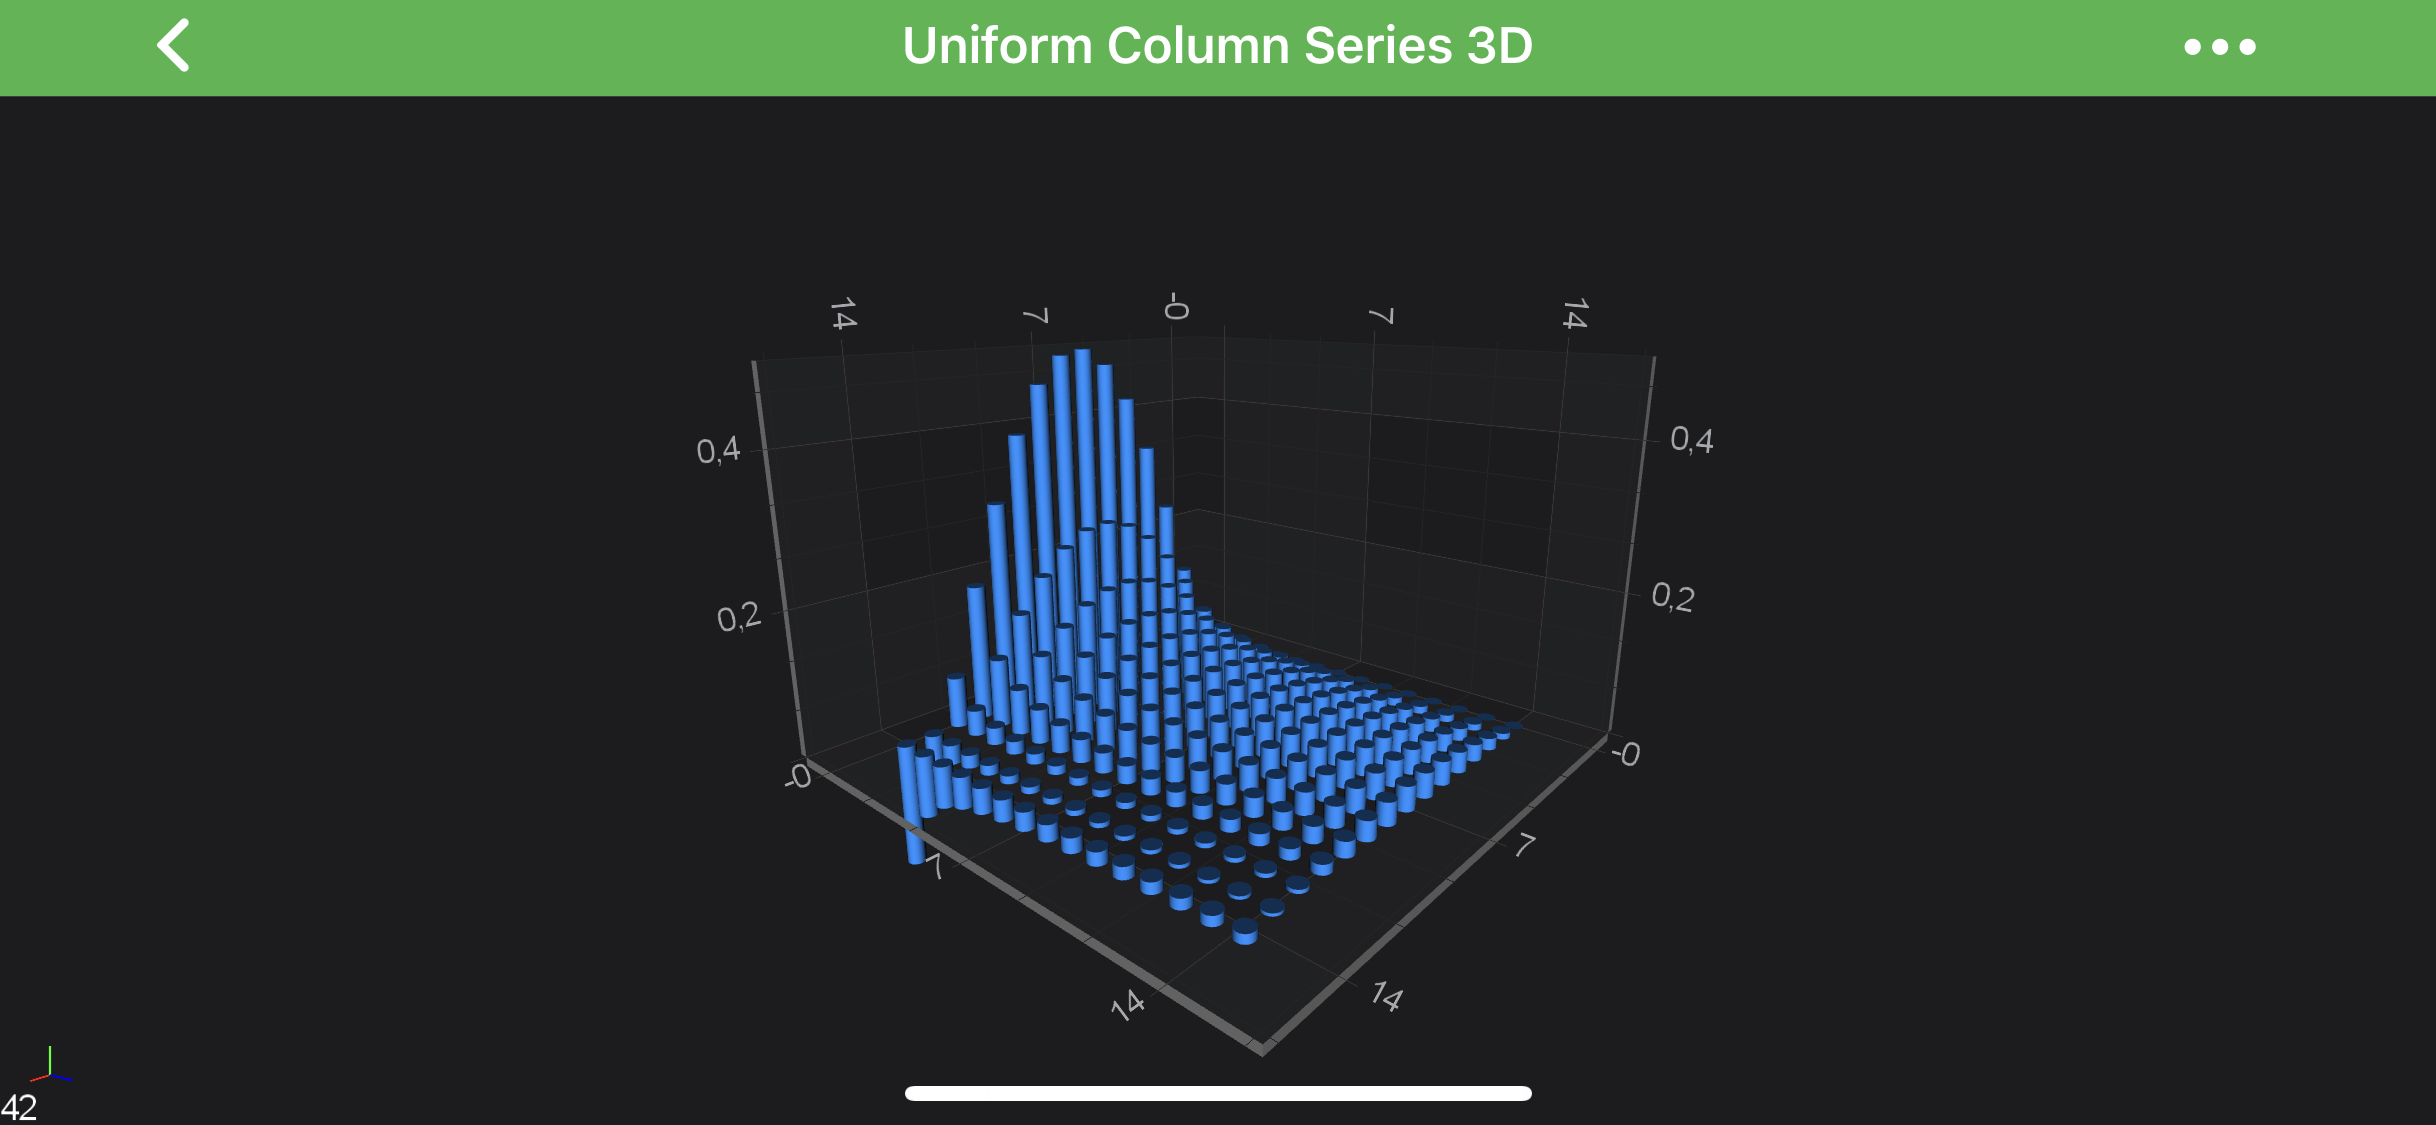
Uniform Column Series 3D
In order to create Uniform Column Series 3D - you will need to provide the UniformGridDataSeries3D<TX,TY,TZ> with N x M array of points.
The above graph is rendered with the following code:
final UniformGridDataSeries3D<Double, Double, Double> ds = new UniformGridDataSeries3D<>(Double.class, Double.class, Double.class, COUNT, COUNT);
for (int x = 0; x < COUNT; x++) {
    for (int z = 0; z < COUNT; z++) {
        final double y = Math.sin(x * .25) / ((z + 1) * 2);
        ds.updateYAt(x, z, y);
    }
}
final Camera3D camera = new Camera3D();
final NumericAxis3D xAxis = new NumericAxis3D();
xAxis.setGrowBy(new DoubleRange(.1, .1));

final NumericAxis3D yAxis = new NumericAxis3D();
yAxis.setGrowBy(new DoubleRange(.1, .1));

final NumericAxis3D zAxis = new NumericAxis3D();
zAxis.setGrowBy(new DoubleRange(.1, .1));

final ColumnRenderableSeries3D rs = new ColumnRenderableSeries3D();
rs.setFill(ColorUtil.DodgerBlue);
rs.setDataSeries(ds);

OrbitModifier3D orbitModifier3D = new OrbitModifier3D();
orbitModifier3D.setReceiveHandledEvents(true);
orbitModifier3D.setExecuteOnPointerCount(1);

UpdateSuspender.using(surface, new Runnable() {
    @Override
    public void run() {
        surface.setCamera(camera);
        surface.setXAxis(xAxis);
        surface.setYAxis(yAxis);
        surface.setZAxis(zAxis);
        surface.getRenderableSeries().add(rs);
        Collections.addAll(surface.getChartModifiers(), new PinchZoomModifier3D(), orbitModifier3D, new ZoomExtentsModifier3D());
    }
});
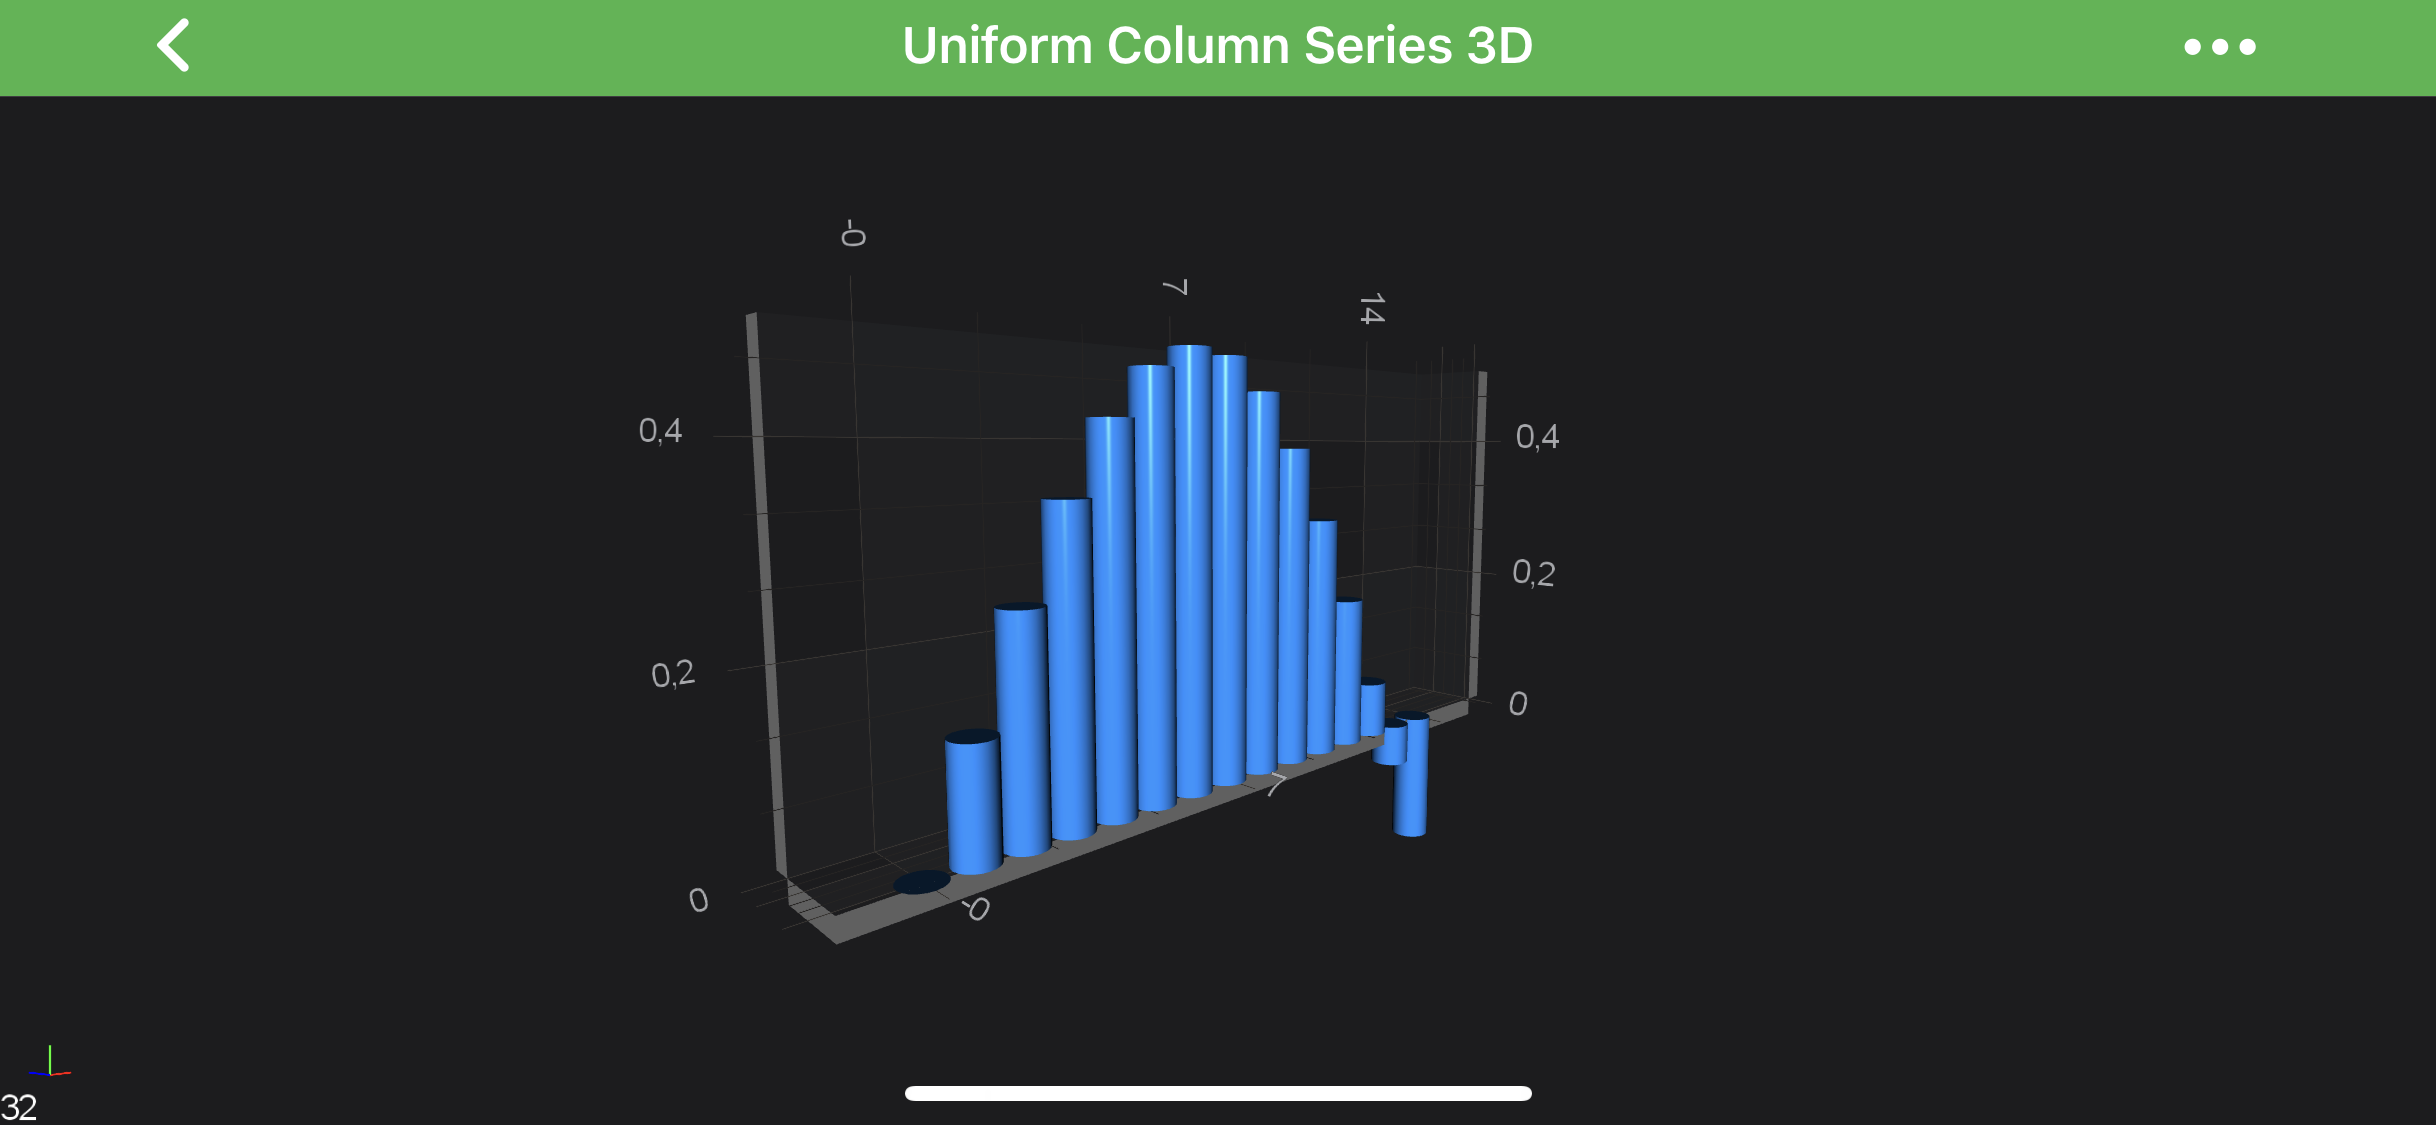
Single Row Column 3D Charts
You might also want to create a Single-Row of 3D Columns.
It's easily achievable via providing UniformGridDataSeries3D<TX,TY,TZ> with size of 1 in Z-Direction and update the worldDimensions like below:
final UniformGridDataSeries3D<Double, Double, Double> ds = new UniformGridDataSeries3D<>(Double.class, Double.class, Double.class, COUNT, COUNT);
for (int x = 0; x < COUNT; x++) {
    for (int z = 0; z < 1; z++) {
        final double y = Math.sin(x * .25) / ((z + 1) * 2);
        ds.updateYAt(x, z, y);
    }
}
surface.getWorldDimensions().assign(200, 100, 20);
and results in the following chart:
Non-Uniform Column Series 3D
In order to create Non-Uniform Column Series 3D - you will need to provide the XyzDataSeries3D<TX,TY,TZ> with points.
final XyzDataSeries3D<Double, Double, Double> dataSeries = new XyzDataSeries3D<>(Double.class, Double.class, Double.class);
final PointMetadataProvider3D pointMetaDataProvider = new PointMetadataProvider3D();

for (double i = 1; i < COUNT; i++) {
    for (double j = 1; j <= COUNT; j++) {
        if (i != j && i % 2 == 0 && j % 2 == 0) {
            final double y = dataManager.getGaussianRandomNumber(5, 1.5);
            dataSeries.append(i, y, j);

            final PointMetadataProvider3D.PointMetadata3D metadata = new PointMetadataProvider3D.PointMetadata3D(dataManager.getRandomColor(), dataManager.getRandomScale());
            pointMetaDataProvider.metadata.add(metadata);
        }
    }
}

final ColumnRenderableSeries3D rs = new ColumnRenderableSeries3D();
rs.setDataSeries(dataSeries);
rs.setMetadataProvider(pointMetaDataProvider);
which will result in the following chart:
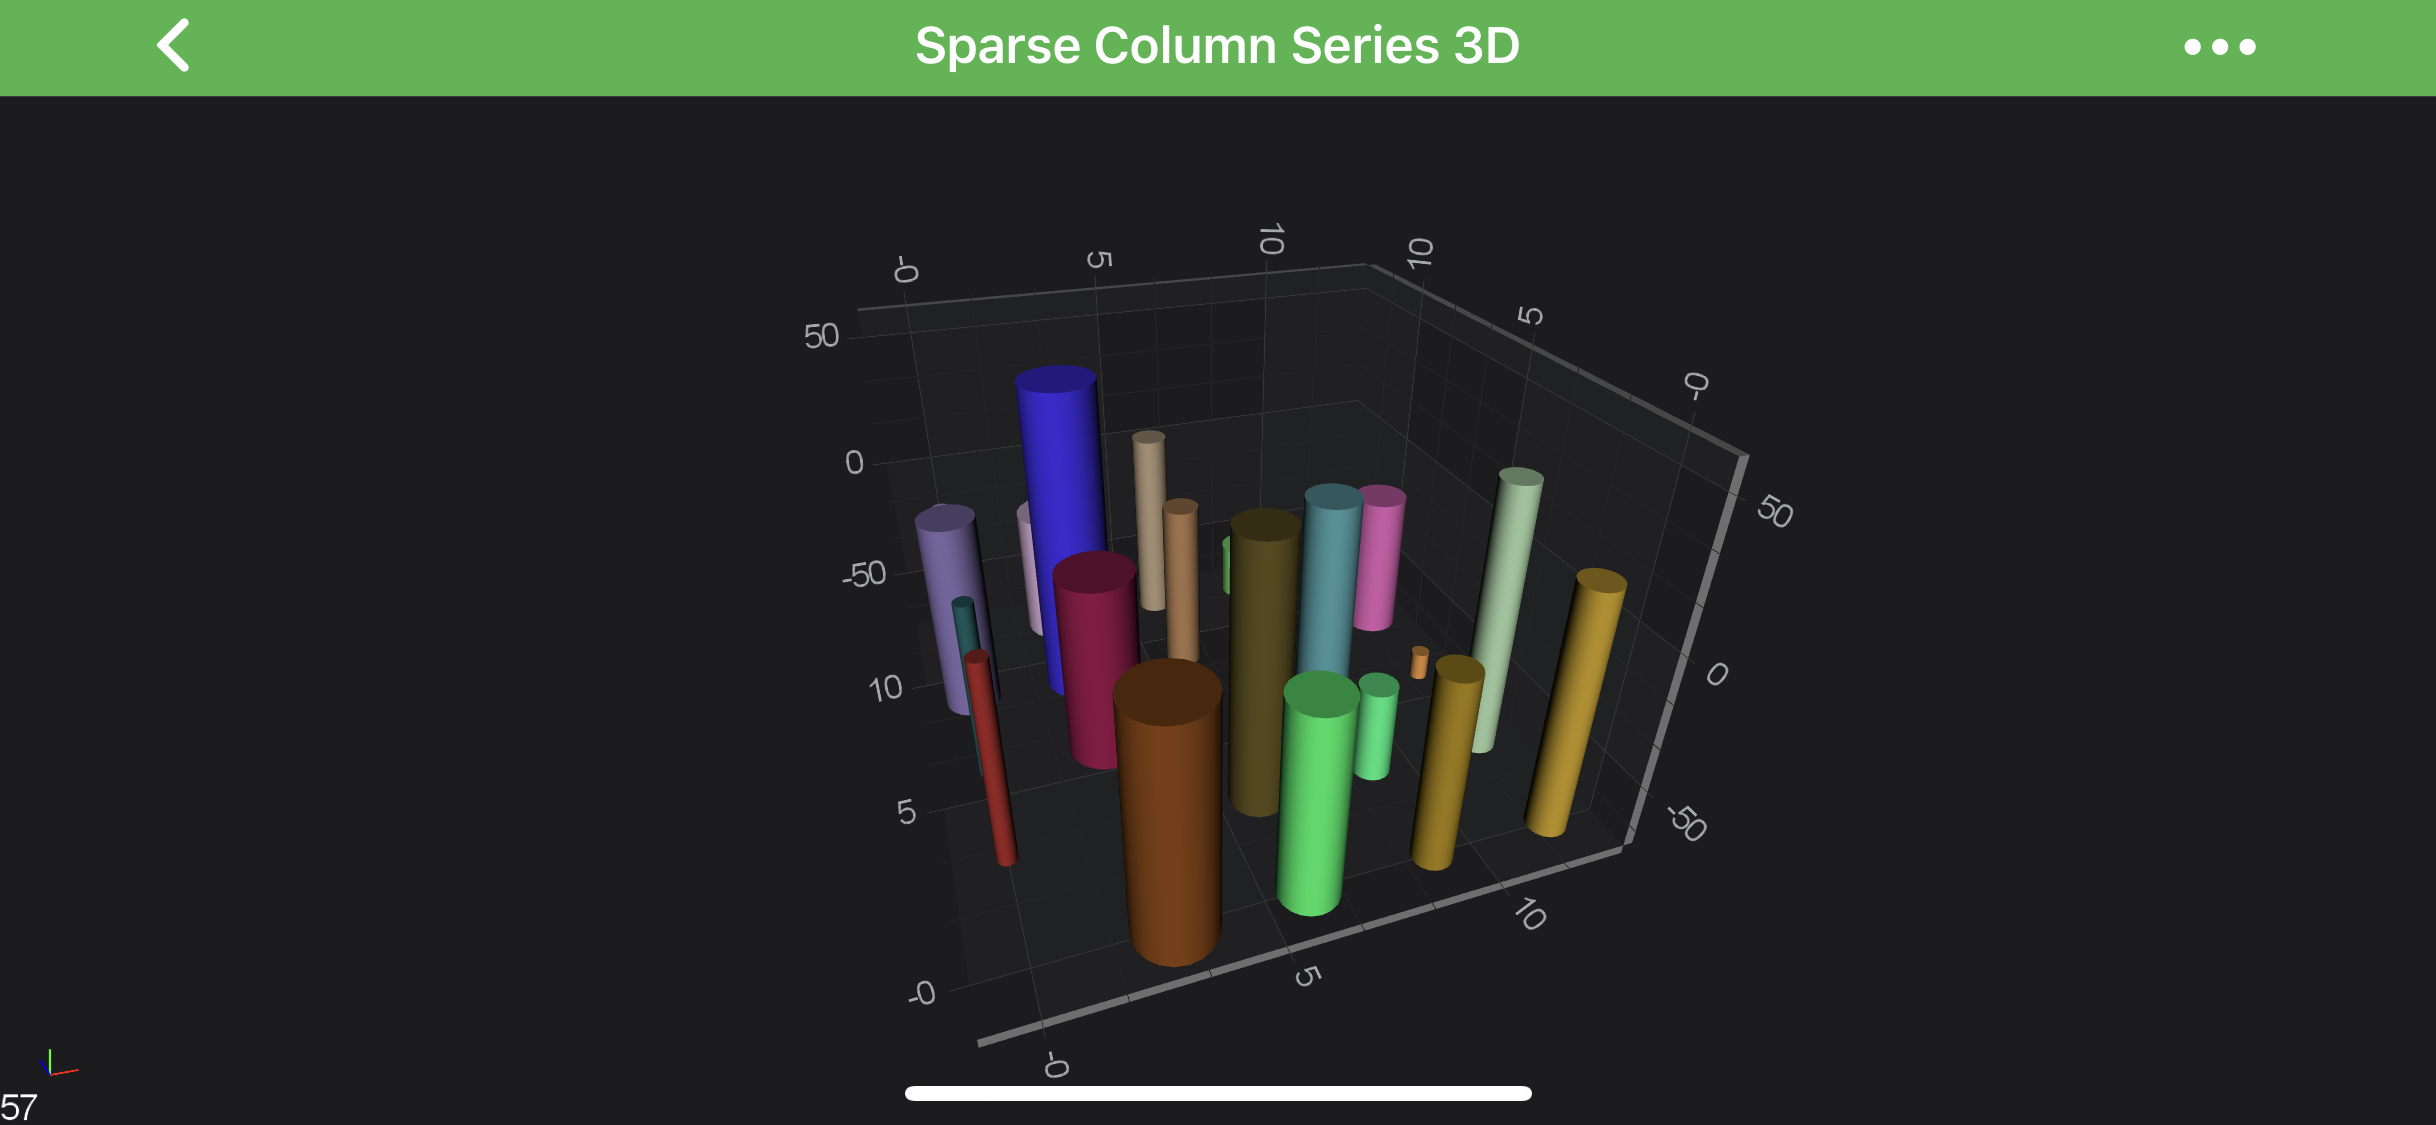
Note
Full example code for the Sparse Column Series 3D can be found in the SciChart Android Examples Suite as well as on GitHub:
3D Column Shapes
There are several shapes provided out of the box for 3D Column Series via the columnShape, and expects type from the SciChartMeshTemplate enumeration.
The possible Shapes are showed in the table below:
| Shape | Output |
|---|---|
| SciChartMeshTemplate.Cube | 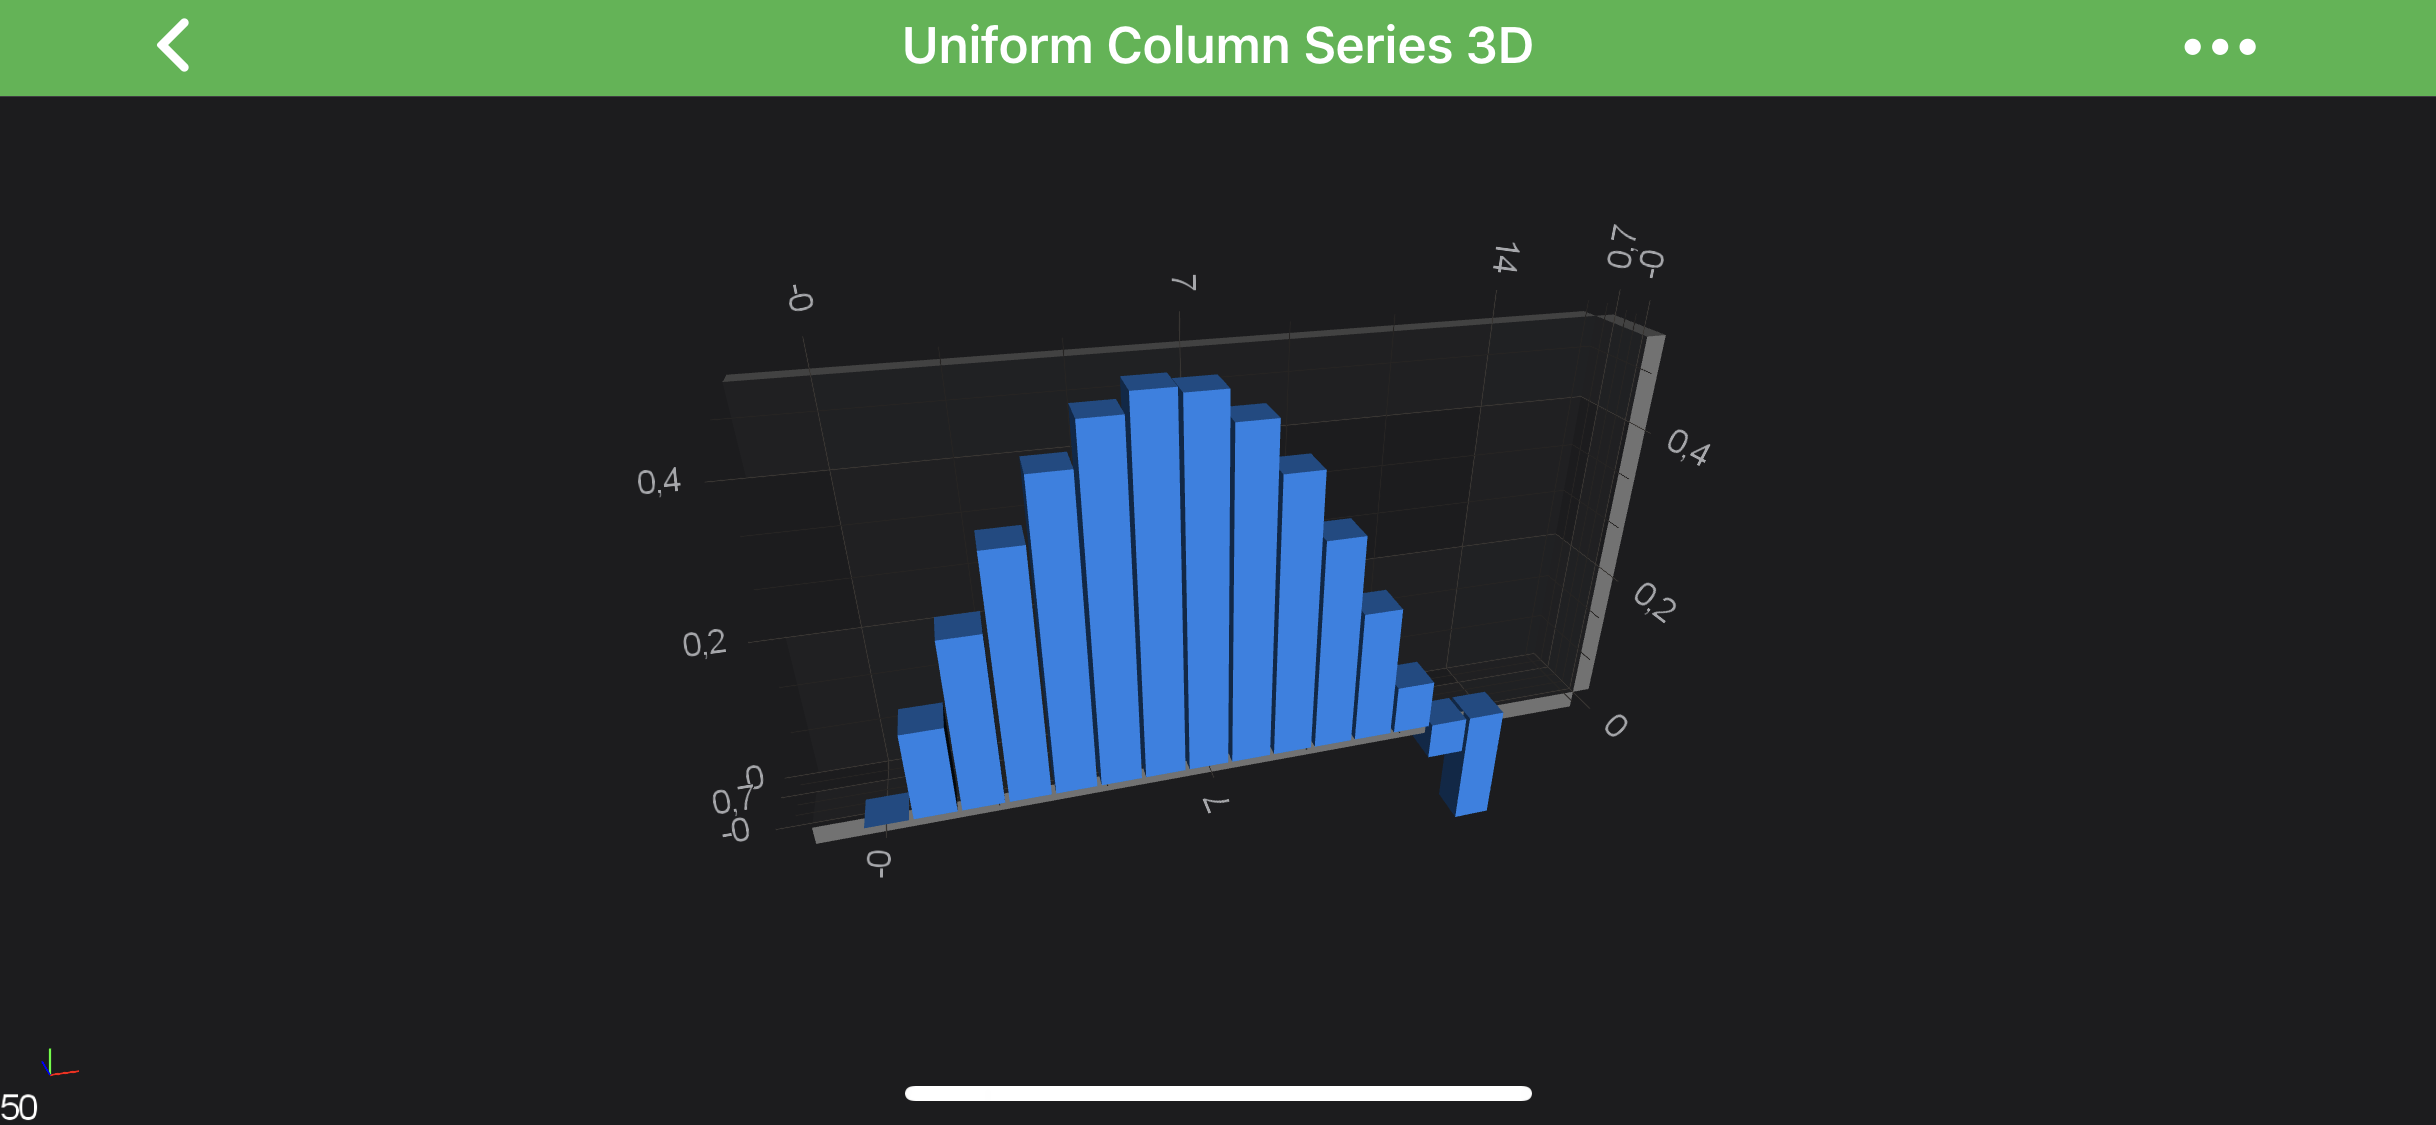 |
| SciChartMeshTemplate.Sphere | 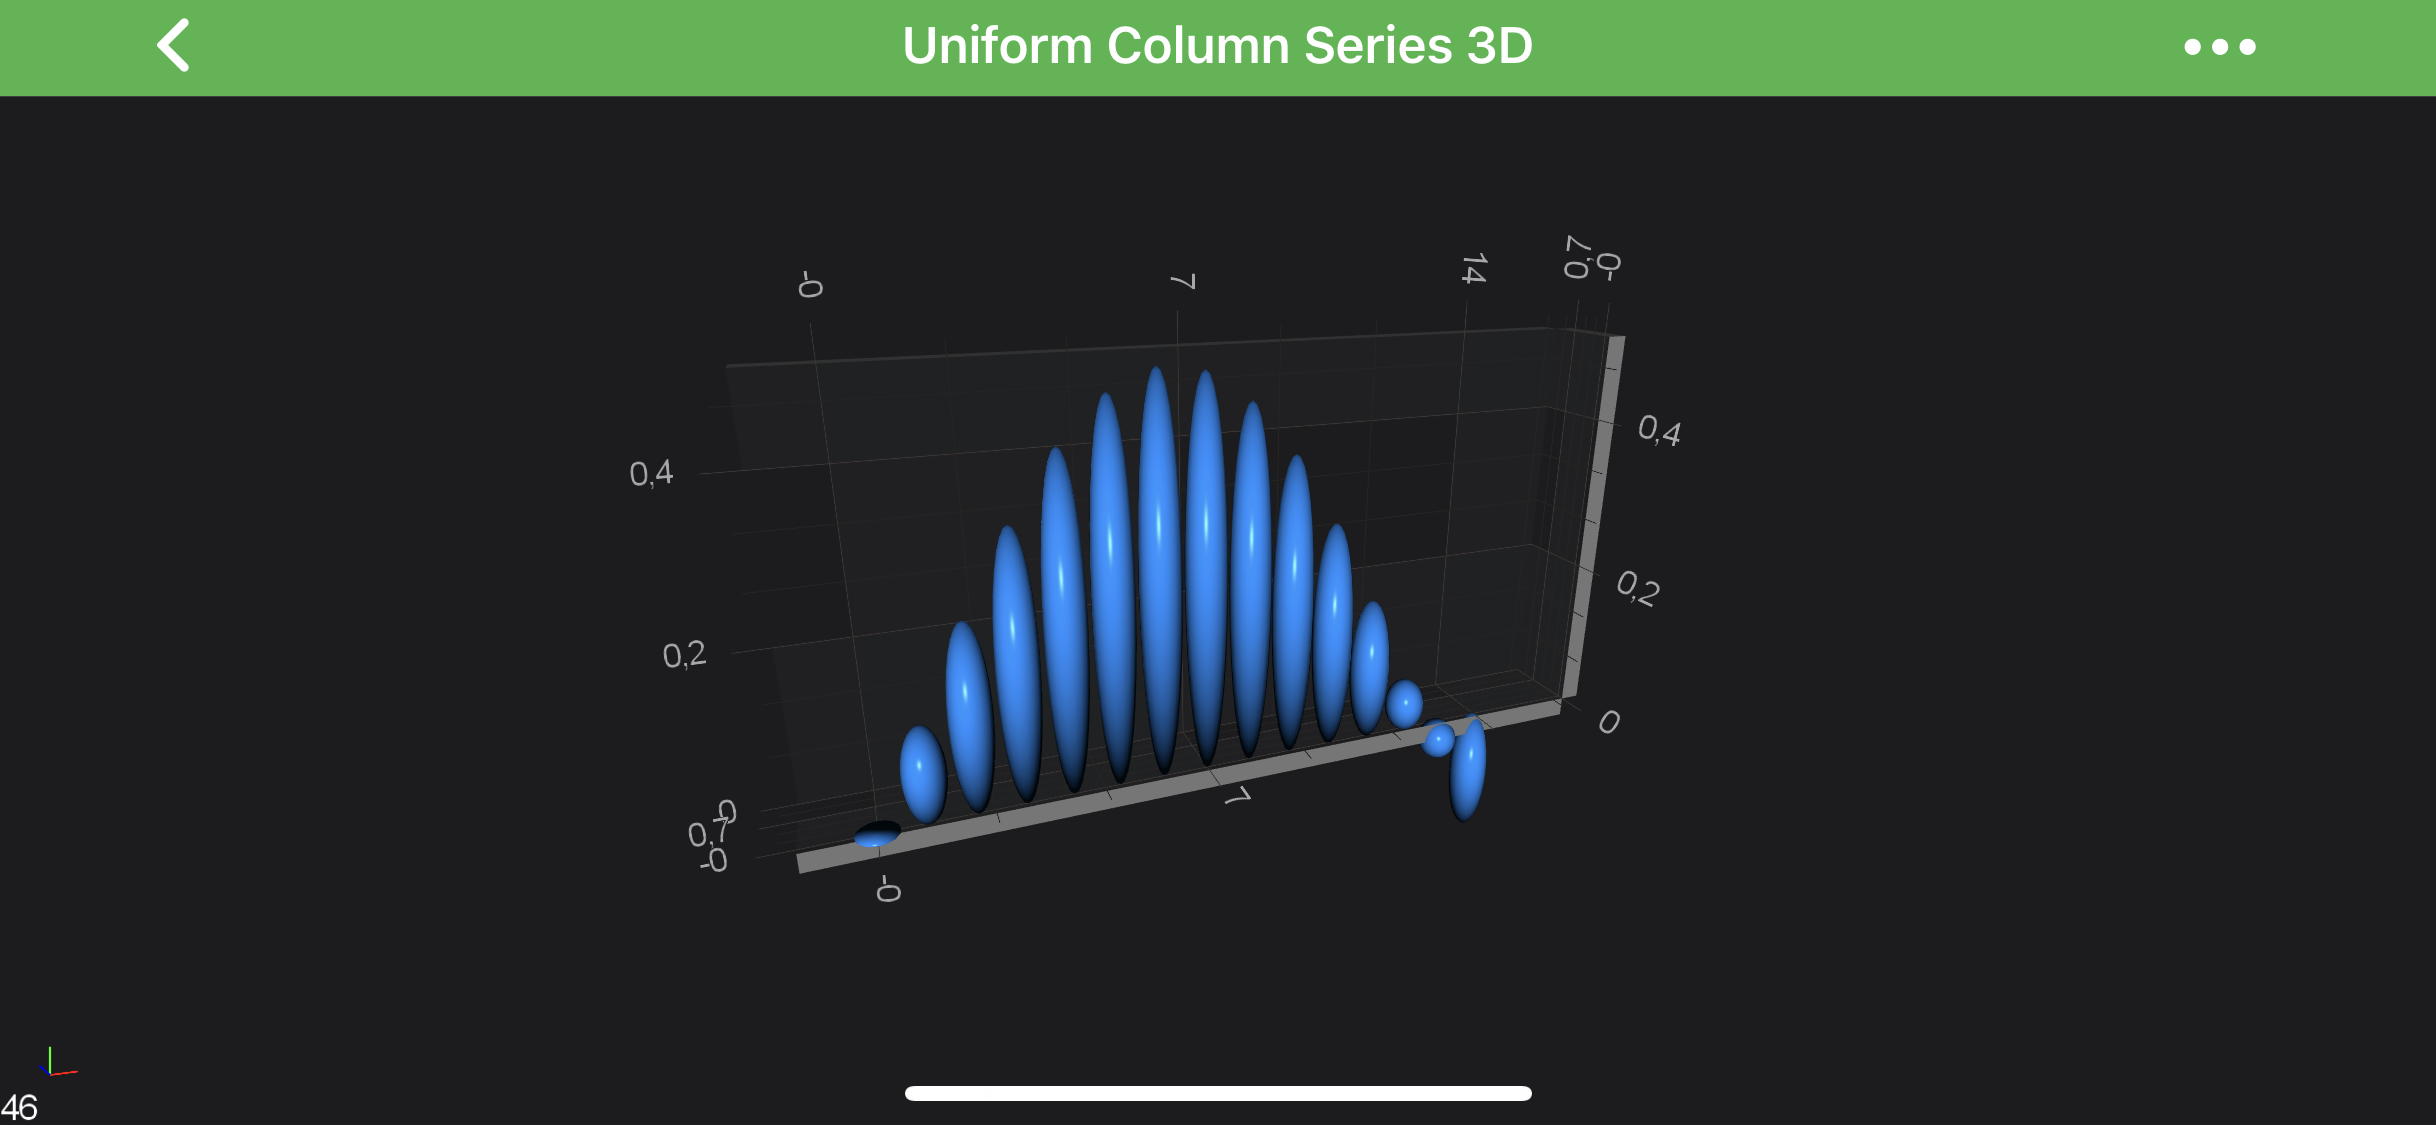 |
| SciChartMeshTemplate.Pyramid | 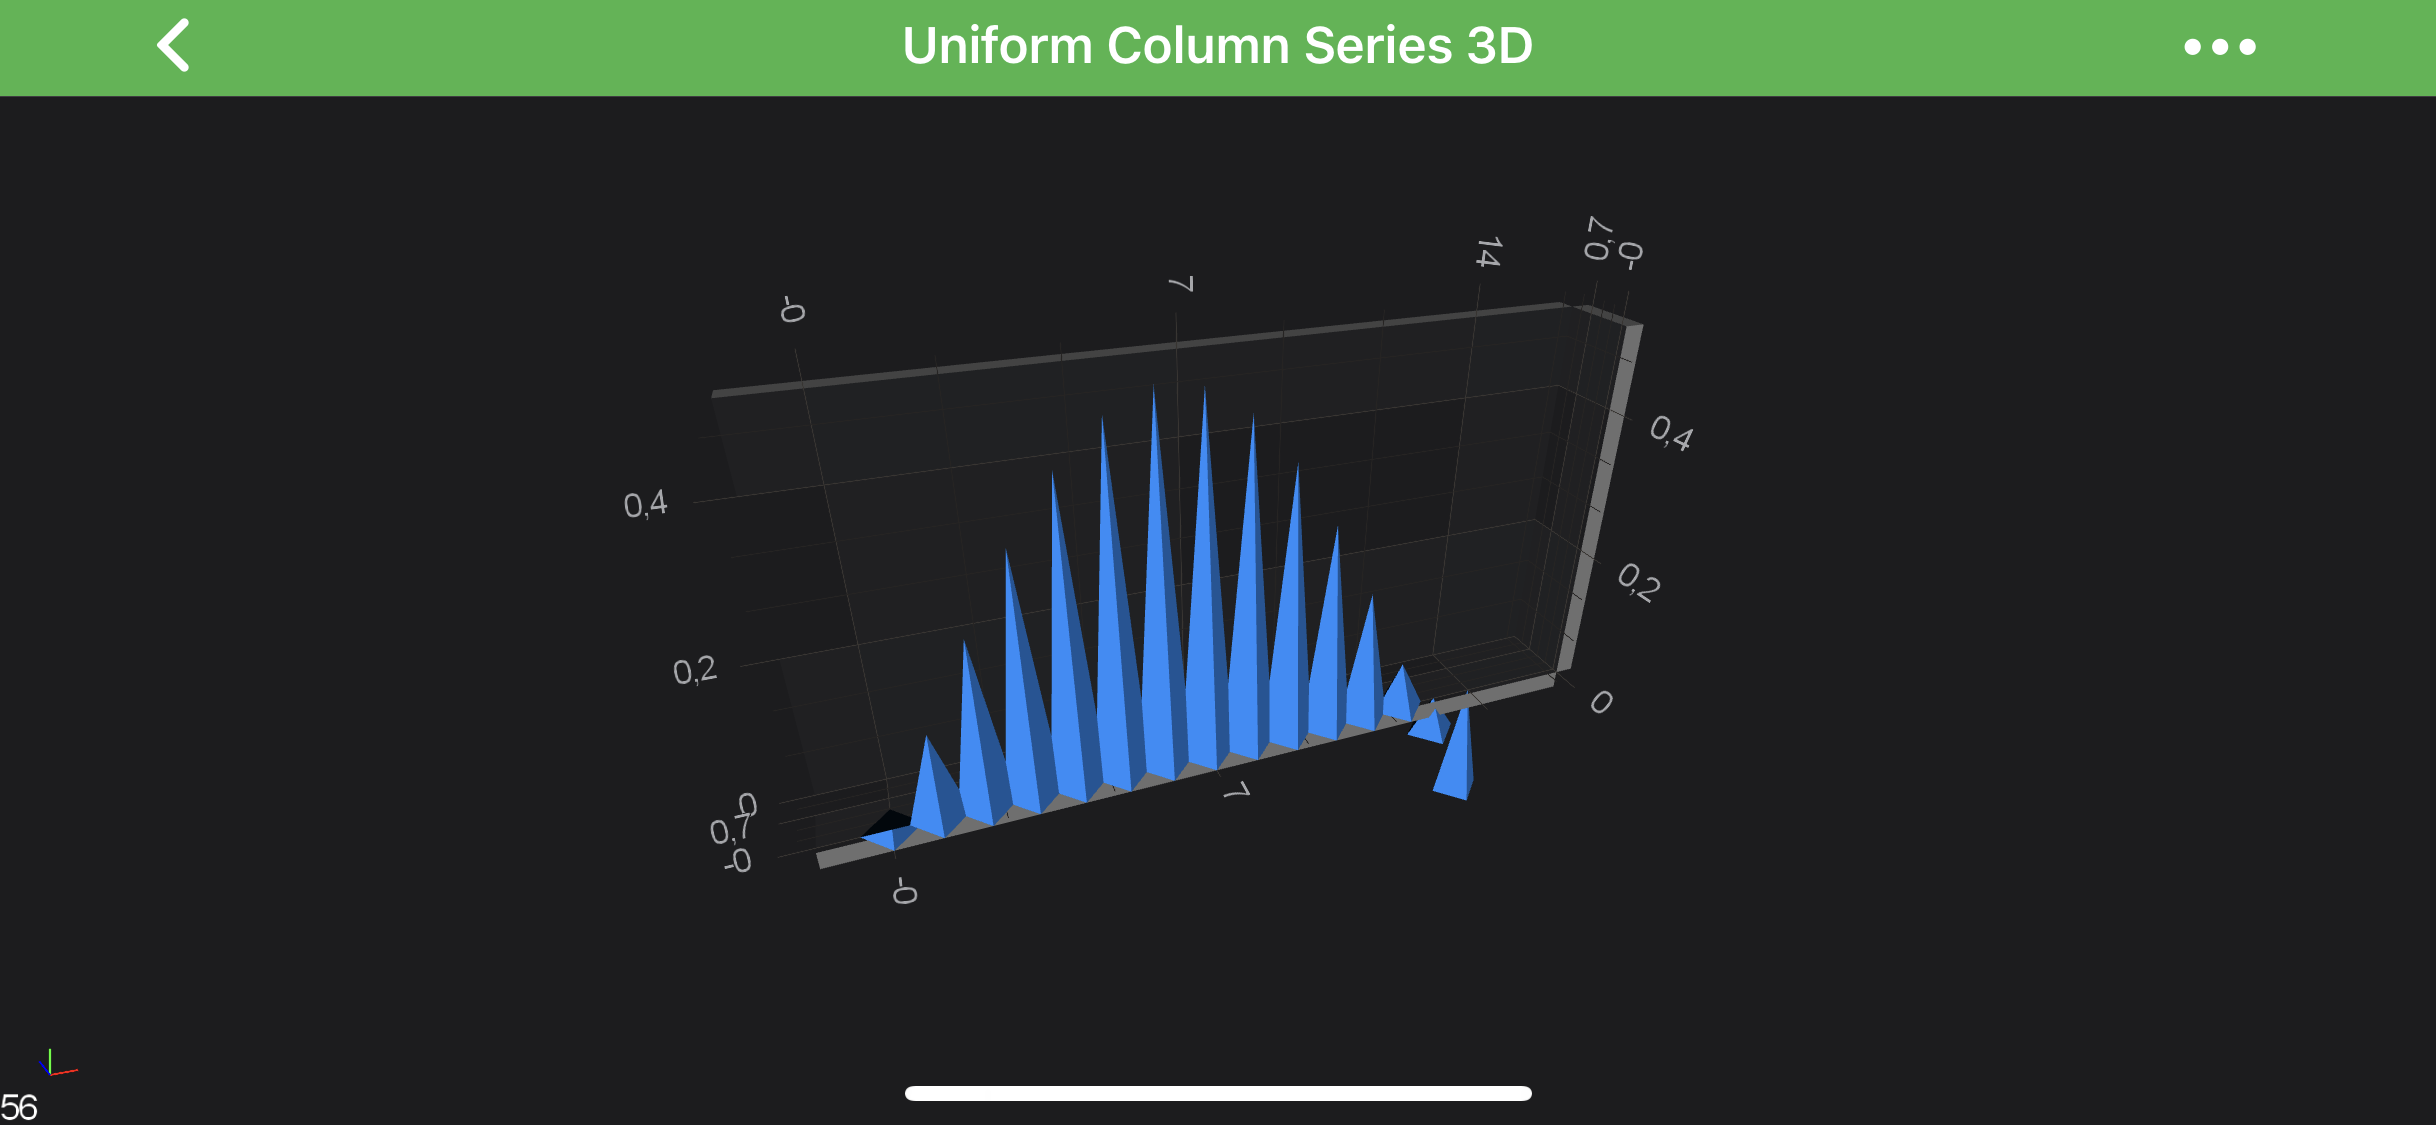 |
| SciChartMeshTemplate.Cylinder | |