SciChart® the market leader in Fast WPF Charts, WPF 3D Charts, iOS Chart, Android Chart and JavaScript Chart Components
SciChart Android ships with ~90 Android Chart Examples which you can browse, play with, view the source-code and even export each SciChart Android Chart Example to a stand-alone Android Studio project. All of this is possible with the new and improved SciChart Android Examples Suite, which ships as part of our Android Charts SDK.
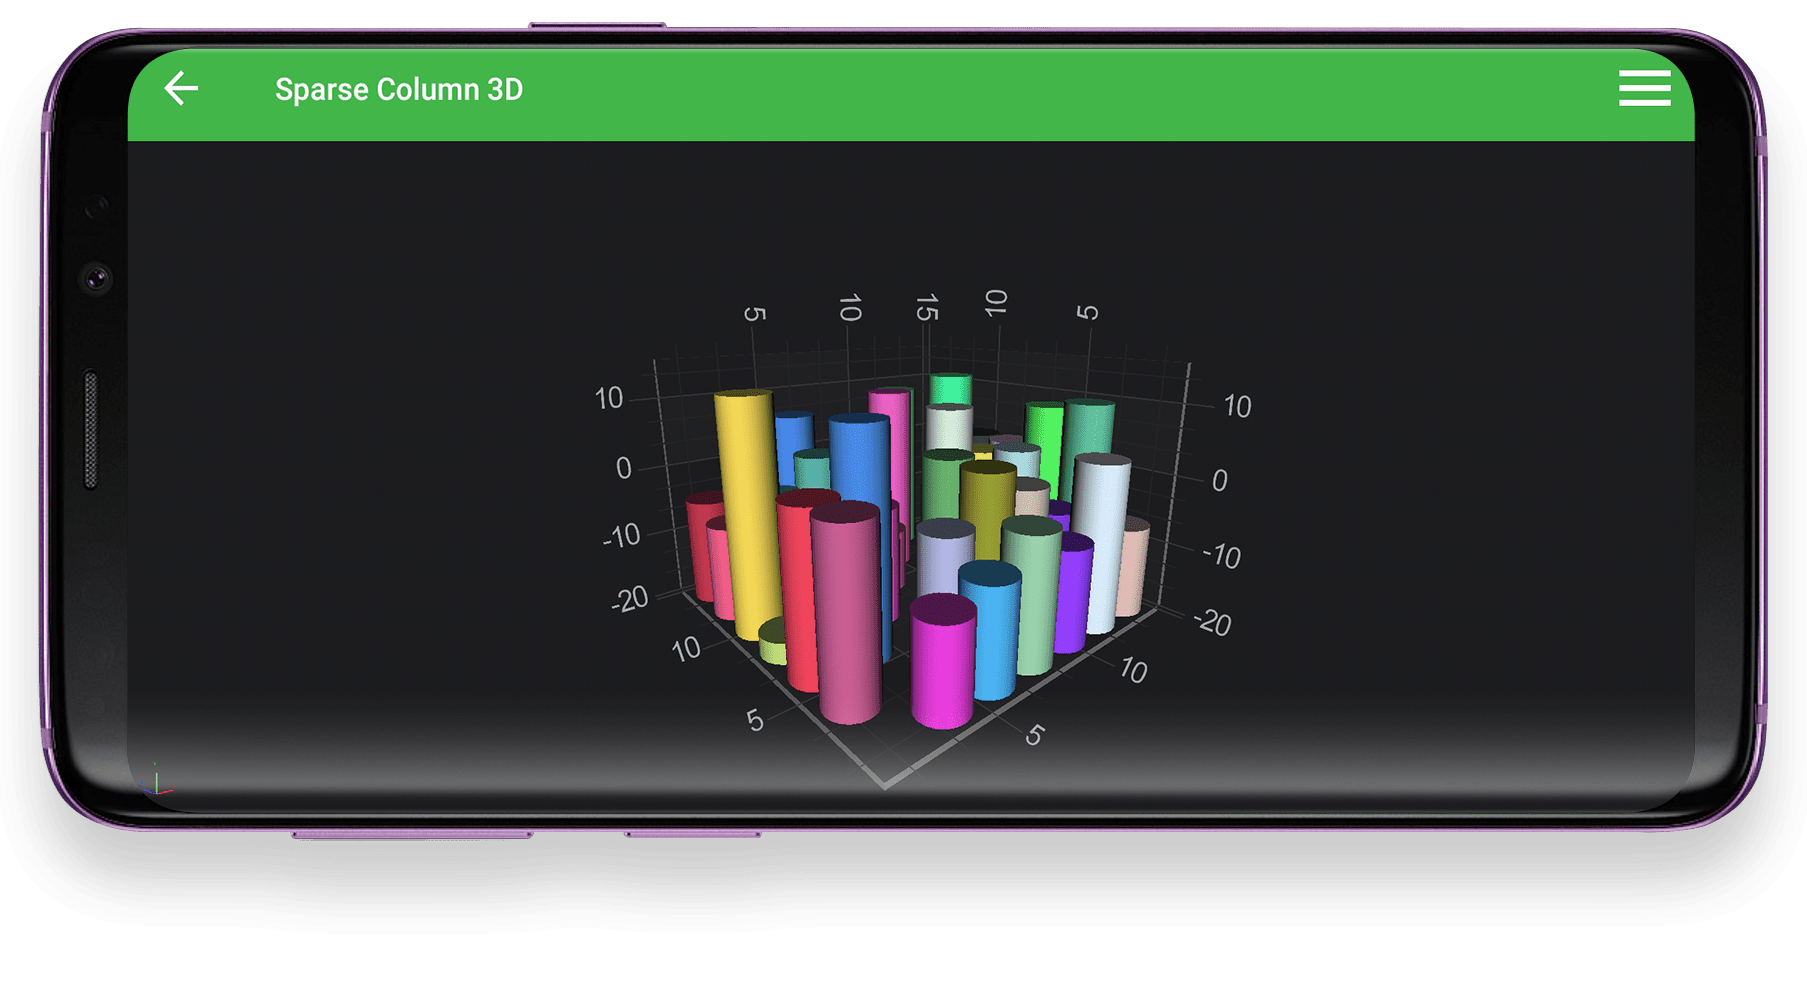
Demonstrates how to use ColumnRenderableSeries3D type and create a 3D Sparse Column Chart in SciChart Android. The ColumnRenderableSeries3D accepts either XyzDataSeries3D for sparse points, or UniformGridDataSeries3D for an NxM array of points.
Column charts are typically used when you need to compare a single category of data between sub-items.
The SciChart Android API for column series allows to have a different number of column rows. It lets manipulating the column size, as well as supports different columns’ shapes out of the box: SpherePointMarker3D, CubePointMarker3D, PyramidPointMarker3D, CylinderPointMarker3D
SciChart Android Documentation:
The full source code for the Android 3D Sparse Column Chart example is included below (Scroll down!).
Did you know you can also view the source code from one of the following sources as well?
<?xml version="1.0" encoding="utf-8"?><!--*************************************************************************-->
<!-- SCICHART® Copyright SciChart Ltd. 2011-2018. All rights reserved. -->
<!-- -->
<!-- Web: http://www.scichart.com -->
<!-- Support: support@scichart.com -->
<!-- Sales: sales@scichart.com -->
<!-- -->
<!-- example_single_chart3d_fragment.xml is part of the SCICHART® Examples. Permission is hereby granted -->
<!-- to modify, create derivative works, distribute and publish any part of this source -->
<!-- code whether for commercial, private or personal use. -->
<!-- -->
<!-- The SCICHART® examples are distributed in the hope that they will be useful, but -->
<!-- without any warranty. It is provided "AS IS" without warranty of any kind, either -->
<!-- expressed or implied. -->
<!--*************************************************************************-->
<LinearLayout xmlns:android="http://schemas.android.com/apk/res/android"
android:layout_width="match_parent"
android:layout_height="match_parent"
android:orientation="vertical">
<com.scichart.charting3d.visuals.SciChartSurface3D
android:id="@+id/chart3d"
android:layout_width="fill_parent"
android:layout_height="fill_parent" />
</LinearLayout>
//******************************************************************************
// SCICHART® Copyright SciChart Ltd. 2011-2018. All rights reserved.
//
// Web: http://www.scichart.com
// Support: support@scichart.com
// Sales: sales@scichart.com
//
// CreateSparseColumn3DFragment.java is part of the SCICHART® Examples. Permission is hereby granted
// to modify, create derivative works, distribute and publish any part of this source
// code whether for commercial, private or personal use.
//
// The SCICHART® examples are distributed in the hope that they will be useful, but
// without any warranty. It is provided "AS IS" without warranty of any kind, either
// expressed or implied.
//******************************************************************************
package com.scichart.examples.fragments.charts3d;
import com.scichart.charting3d.model.dataSeries.xyz.XyzDataSeries3D;
import com.scichart.charting3d.visuals.SciChartSurface3D;
import com.scichart.charting3d.visuals.axes.NumericAxis3D;
import com.scichart.charting3d.visuals.camera.Camera3D;
import com.scichart.charting3d.visuals.renderableSeries.columns.ColumnRenderableSeries3D;
import com.scichart.charting3d.visuals.renderableSeries.metadataProviders.PointMetadataProvider3D;
import com.scichart.core.framework.UpdateSuspender;
import com.scichart.examples.R;
import com.scichart.examples.data.DataManager;
import com.scichart.examples.fragments.base.ExampleBaseFragment;
import java.util.List;
import butterknife.BindView;
public class CreateSparseColumn3DFragment extends ExampleBaseFragment {
private static final int COUNT = 15;
@BindView(R.id.chart3d)
SciChartSurface3D surface3d;
@Override
protected int getLayoutId() {
return R.layout.example_single_chart3d_fragment;
}
@Override
protected void initExample() {
final DataManager dataManager = DataManager.getInstance();
final XyzDataSeries3D<Double, Double, Double> ds = new XyzDataSeries3D<>(Double.class, Double.class, Double.class);
final PointMetadataProvider3D metadataProvider = new PointMetadataProvider3D();
final List<PointMetadataProvider3D.PointMetadata3D> metadata = metadataProvider.metadata;
for (double i = 1; i < COUNT; i++) {
for (double j = 1; j <= COUNT; j++) {
if(i != j && i%2 == 0 && j%2 == 0) {
final double y = dataManager.getGaussianRandomNumber(5, 1.5);
final int color = dataManager.getRandomColor();
ds.append(i, y, j);
metadata.add(new PointMetadataProvider3D.PointMetadata3D(color));
}
}
}
final Camera3D camera = sciChart3DBuilder.newCamera3D().build();
final NumericAxis3D xAxis = sciChart3DBuilder.newNumericAxis3D().withGrowBy(.1, .1).build();
final NumericAxis3D yAxis = sciChart3DBuilder.newNumericAxis3D().withGrowBy(.1, .1).build();
final NumericAxis3D zAxis = sciChart3DBuilder.newNumericAxis3D().withGrowBy(.1, .1).build();
final ColumnRenderableSeries3D rs = sciChart3DBuilder.newColumnSeries3D()
.withDataSeries(ds)
.withMetadataProvider(metadataProvider)
.build();
UpdateSuspender.using(surface3d, new Runnable() {
@Override
public void run() {
surface3d.setCamera(camera);
surface3d.setXAxis(xAxis);
surface3d.setYAxis(yAxis);
surface3d.setZAxis(zAxis);
surface3d.getRenderableSeries().add(rs);
surface3d.getChartModifiers().add(sciChart3DBuilder.newModifierGroupWithDefaultModifiers().build());
}
});
}
}