Android Chart - Examples
SciChart Android ships with ~90 Android Chart Examples which you can browse, play with, view the source-code and even export each SciChart Android Chart Example to a stand-alone Android Studio project. All of this is possible with the new and improved SciChart Android Examples Suite, which ships as part of our Android Charts SDK.
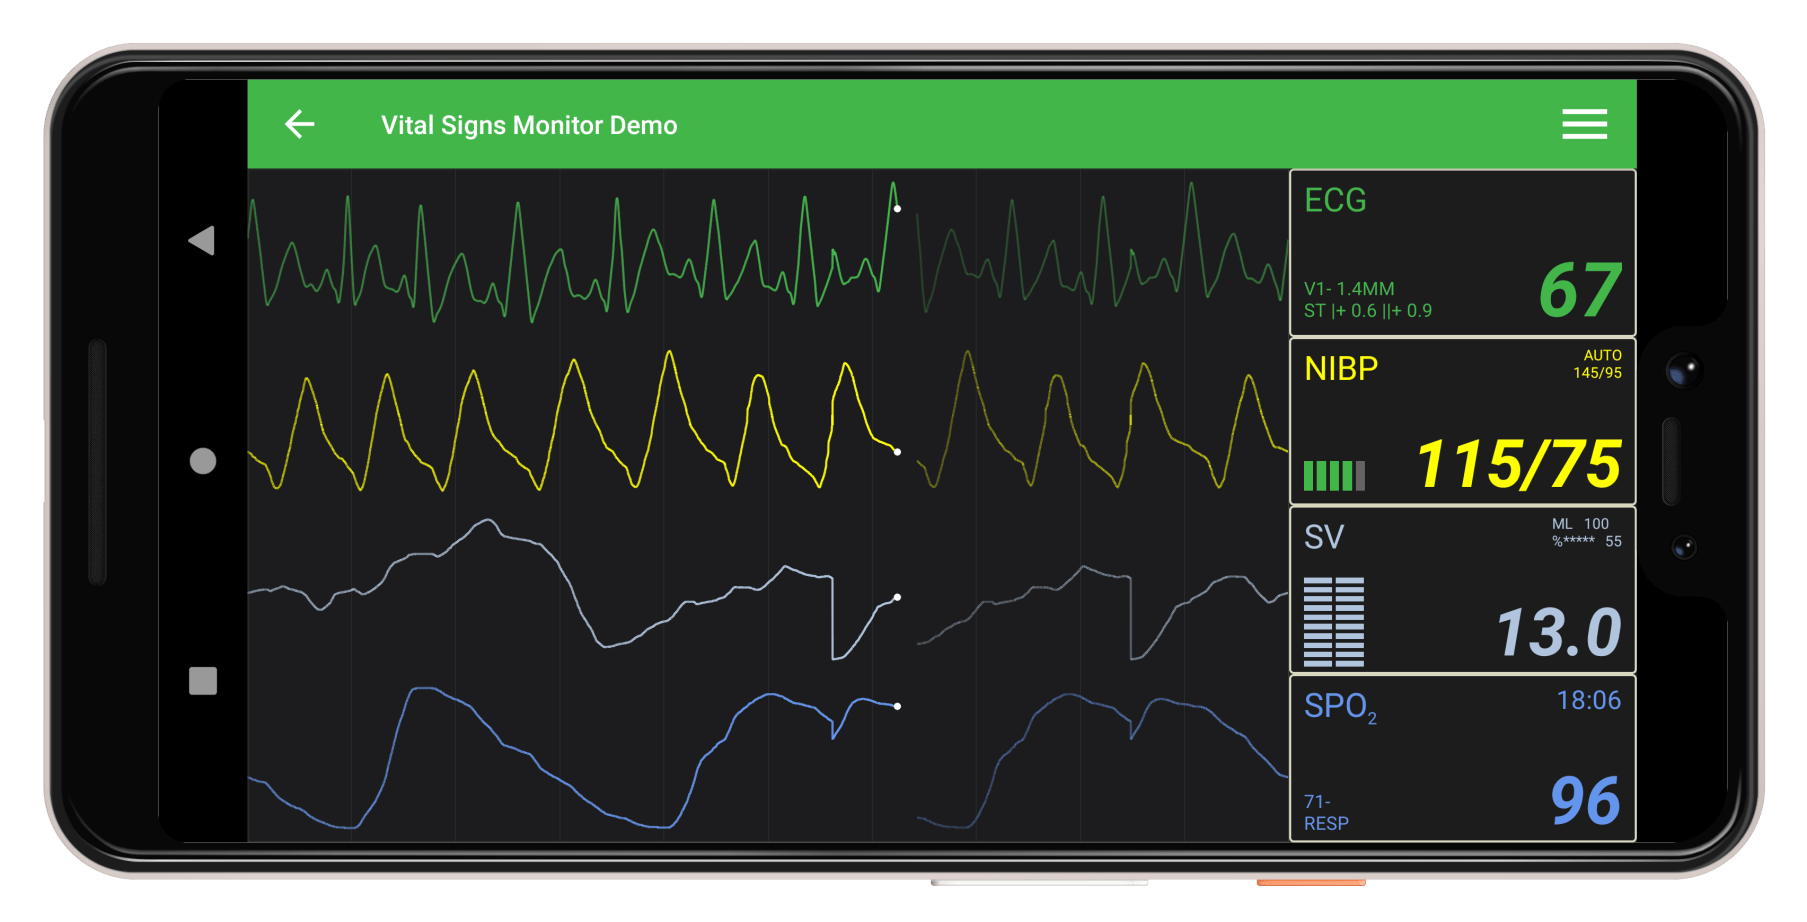
The Vital Signs demo showcases how to use SciChart Android Charts in a medical context.
There are four channels of data simulated, showing how real-time, high performance ECG/EKG charts & graphs can be drawn with SciChart Android to monitor blood pressure, SPO2 blood oxygen, and volumetric flow enabling you to create medical apps using an Android phone or Embedded systems.
SciChart helps you shortcut development of medical applications by providing rich, real time, high performance & reliable Android charts for use in Vital-Signs monitors, blood pressure monitors, Electro Cardiogram, medical Ventilators, patient monitors, digital stethoscopes and more.
If you are creating an app that needs to visualize body temperature, pulse rate, respiration rate, blood pressure, or similar, choose SciChart to shortcut your development time & get to market faster with our well-tested, reliable Android Chart library.
The full source code for the Android Vital Signs ECG/EKG Medical Demo example is included below (Scroll down!).
Did you know you can also view the source code from one of the following sources as well?
- Clone the SciChart.Android.Examples from Github.
- Or, view source and export each example to an Android Studio project from the Java version of the SciChart Android Examples app.
- Also the SciChart Android Trial contains the full source for the examples (link below).


