SciChart® the market leader in Fast WPF Charts, WPF 3D Charts, iOS Chart, Android Chart and JavaScript Chart Components
SciChart Android ships with ~90Â Android Chart Examples which you can browse, play with, view the source-code and even export each SciChart Android Chart Example to a stand-alone Android Studio project. All of this is possible with the new and improved SciChart Android Examples Suite, which ships as part of our Android Charts SDK.
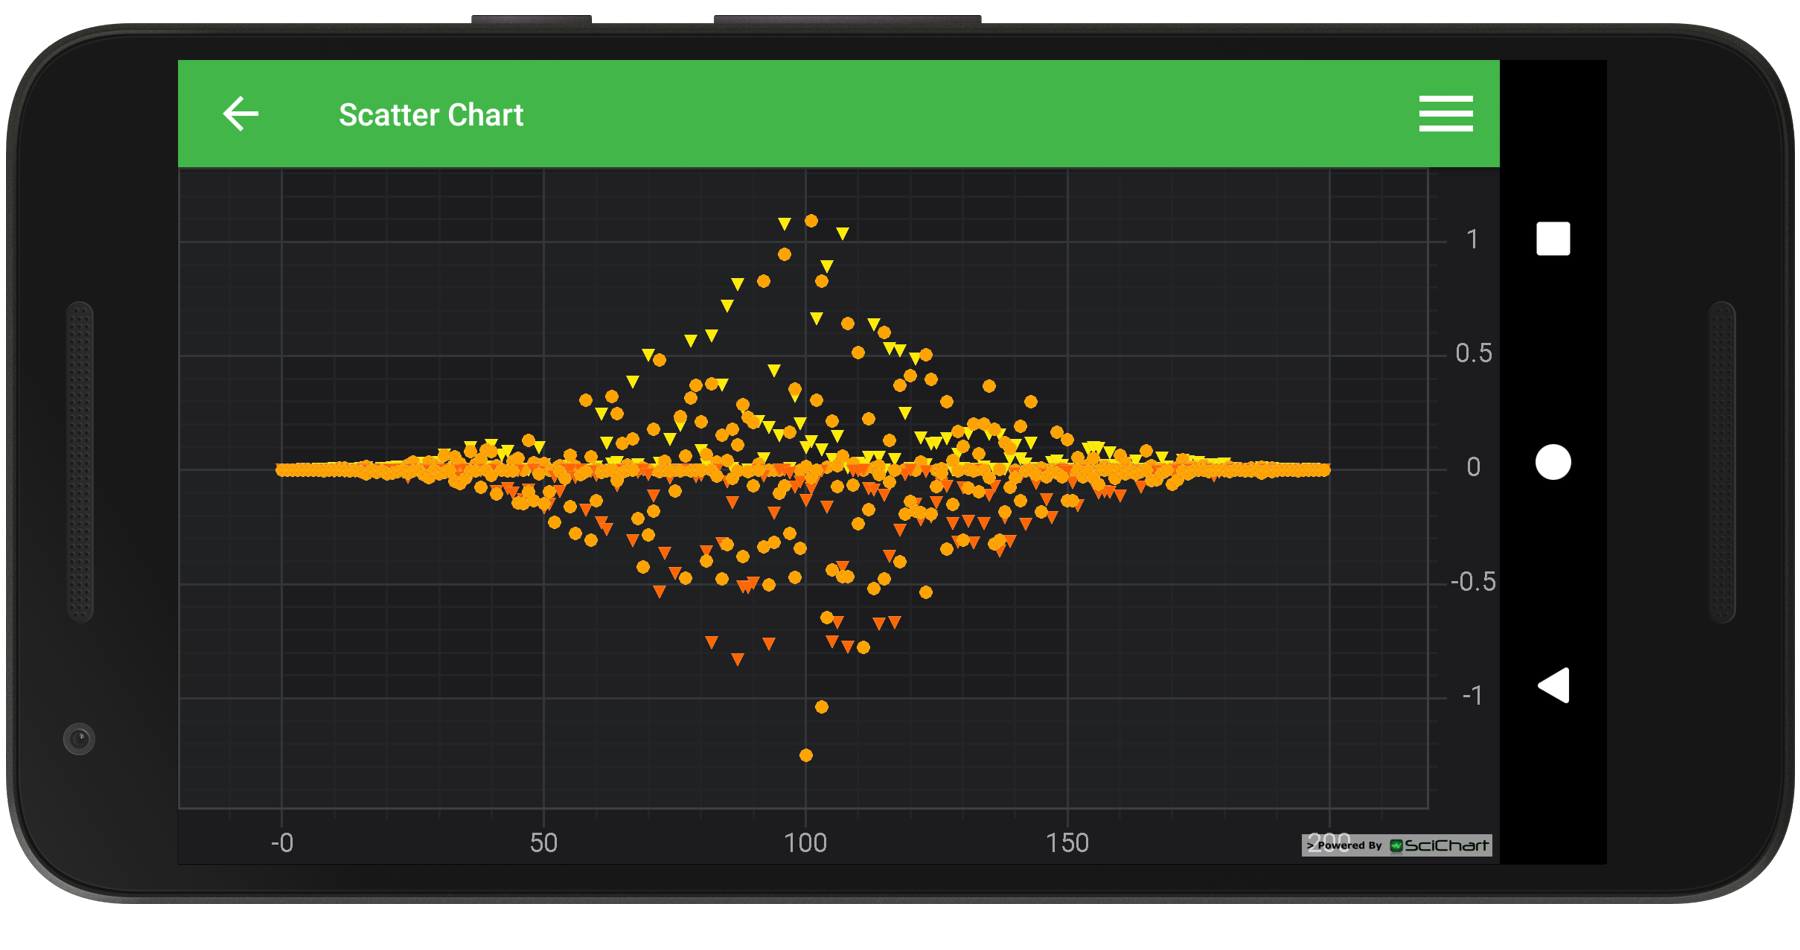
SciChart charts are very popular with scientists and engineers, but also find their application in sales dashboards. Drawing a scatter diagram is the first step in looking for correlation between variables. This example generates a Scatter Chart in code.
The XyScatterRenderableSeries can be used to render an XyDataSeries (which contains one X-point and one Y-point), XyyDataSeries (renders Y values), XyzDataSeries, HlDataSeries and OhlcDataSeries(renders Close values).
The Scatter Chart uses the PointMarker API to define the marker shape and size. This can be customized in code or you can create your own Point-Markers using our SpritePointMarker or DrawablePointMarker type.
Tip!
Perhaps you wanted a scatter point with a line? If so you can do this using the FastLineRenderableSeries and calling the setPointMarker() method.
The full source code for the Android Scatter Chart example is included below (Scroll down!).
Did you know you can also view the source code from one of the following sources as well?
//******************************************************************************
// SCICHART® Copyright SciChart Ltd. 2011-2021. All rights reserved.
//
// Web: http://www.scichart.com
// Support: support@scichart.com
// Sales: sales@scichart.com
//
// ScatterChartFragment.kt is part of SCICHART®, High Performance Scientific Charts
// For full terms and conditions of the license, see http://www.scichart.com/scichart-eula/
//
// This source code is protected by international copyright law. Unauthorized
// reproduction, reverse-engineering, or distribution of all or any portion of
// this source code is strictly prohibited.
//
// This source code contains confidential and proprietary trade secrets of
// SciChart Ltd., and should at no time be copied, transferred, sold,
// distributed or made available without express written permission.
//******************************************************************************
package com.scichart.examples.fragments.examples2d.basicChartTypes.kt
import android.view.animation.DecelerateInterpolator
import com.scichart.charting.modifiers.AxisDragModifierBase.AxisDragMode
import com.scichart.charting.visuals.SciChartSurface
import com.scichart.charting.visuals.pointmarkers.EllipsePointMarker
import com.scichart.charting.visuals.pointmarkers.IPointMarker
import com.scichart.charting.visuals.pointmarkers.TrianglePointMarker
import com.scichart.charting.visuals.renderableSeries.XyScatterRenderableSeries
import com.scichart.data.model.DoubleRange
import com.scichart.examples.fragments.base.ExampleSingleChartBaseFragment
import com.scichart.examples.utils.scichartExtensions.*
import java.util.*
class ScatterChartFragment : ExampleSingleChartBaseFragment() {
private val random = Random()
override fun initExample(surface: SciChartSurface) {
val rSeries1 = getScatterRenderableSeries(TrianglePointMarker(), 0xFFFFEB01, false)
val rSeries2 = getScatterRenderableSeries(EllipsePointMarker(), 0xFFffA300, false)
val rSeries3 = getScatterRenderableSeries(TrianglePointMarker(), 0xFFff6501, true)
val rSeries4 = getScatterRenderableSeries(EllipsePointMarker(), 0xFFffa300, true)
surface.suspendUpdates {
xAxes { numericAxis { growBy = DoubleRange(0.1, 0.1) }}
yAxes { numericAxis { growBy = DoubleRange(0.1, 0.1) }}
renderableSeries {
rSeries(rSeries1)
rSeries(rSeries2)
rSeries(rSeries3)
rSeries(rSeries4)
}
chartModifiers {
zoomExtentsModifier()
pinchZoomModifier()
cursorModifier { receiveHandledEvents = true }
xAxisDragModifier { receiveHandledEvents = true }
yAxisDragModifier { dragMode = AxisDragMode.Pan }
}
rSeries1.waveAnimation { interpolator = DecelerateInterpolator(); duration = 3000; startDelay = 350 }
rSeries2.waveAnimation { interpolator = DecelerateInterpolator(); duration = 3000; startDelay = 350 }
rSeries3.waveAnimation { interpolator = DecelerateInterpolator(); duration = 3000; startDelay = 350 }
rSeries4.waveAnimation { interpolator = DecelerateInterpolator(); duration = 3000; startDelay = 350 }
}
}
private fun getScatterRenderableSeries(marker: IPointMarker, color: Long, negative: Boolean): XyScatterRenderableSeries {
val dataSeriesName = if (marker is EllipsePointMarker)
if (negative) "Negative Ellipse" else "Positive Ellipse"
else if (negative) "Negative" else "Positive"
return XyScatterRenderableSeries().apply {
xyDataSeries<Int, Double> {
seriesName = dataSeriesName
for (i in 0 until 200) {
val time = if (i < 100) getRandom(0.0, i + 10.0) / 100 else getRandom(0.0, 200 - i + 10.0) / 100
val y = if (negative) -time * time * time else time * time * time
append(i, y)
}
}
strokeStyle = SolidPenStyle(color)
pointMarker = marker.apply {
setSize(6)
strokeStyle = SolidPenStyle(0xFFFFFFFF, 0.1f)
fillStyle = SolidBrushStyle(color)
}
}
}
private fun getRandom(min: Double, max: Double): Double {
return min + (max - min) * random.nextDouble()
}
}
//******************************************************************************
// SCICHART® Copyright SciChart Ltd. 2011-2021. All rights reserved.
//
// Web: http://www.scichart.com
// Support: support@scichart.com
// Sales: sales@scichart.com
//
// ScatterChartFragment.java is part of SCICHART®, High Performance Scientific Charts
// For full terms and conditions of the license, see http://www.scichart.com/scichart-eula/
//
// This source code is protected by international copyright law. Unauthorized
// reproduction, reverse-engineering, or distribution of all or any portion of
// this source code is strictly prohibited.
//
// This source code contains confidential and proprietary trade secrets of
// SciChart Ltd., and should at no time be copied, transferred, sold,
// distributed or made available without express written permission.
//******************************************************************************
package com.scichart.examples.fragments.examples2d.basicChartTypes;
import android.view.animation.DecelerateInterpolator;
import androidx.annotation.ColorInt;
import androidx.annotation.NonNull;
import com.scichart.charting.model.dataSeries.IXyDataSeries;
import com.scichart.charting.modifiers.AxisDragModifierBase.AxisDragMode;
import com.scichart.charting.visuals.SciChartSurface;
import com.scichart.charting.visuals.axes.IAxis;
import com.scichart.charting.visuals.pointmarkers.EllipsePointMarker;
import com.scichart.charting.visuals.pointmarkers.IPointMarker;
import com.scichart.charting.visuals.pointmarkers.TrianglePointMarker;
import com.scichart.charting.visuals.renderableSeries.XyScatterRenderableSeries;
import com.scichart.core.framework.UpdateSuspender;
import com.scichart.examples.fragments.base.ExampleSingleChartBaseFragment;
import java.util.Collections;
import java.util.Random;
public class ScatterChartFragment extends ExampleSingleChartBaseFragment {
private final Random random = new Random();
@Override
protected void initExample(@NonNull SciChartSurface surface) {
final IAxis xAxis = sciChartBuilder.newNumericAxis().withGrowBy(0.1d, 0.1d).build();
final IAxis yAxis = sciChartBuilder.newNumericAxis().withGrowBy(0.1d, 0.1d).build();
final XyScatterRenderableSeries rSeries1 = getScatterRenderableSeries(new TrianglePointMarker(), 0xFFFFEB01, false);
final XyScatterRenderableSeries rSeries2 = getScatterRenderableSeries(new EllipsePointMarker(), 0xFFffA300, false);
final XyScatterRenderableSeries rSeries3 = getScatterRenderableSeries(new TrianglePointMarker(), 0xFFff6501, true);
final XyScatterRenderableSeries rSeries4 = getScatterRenderableSeries(new EllipsePointMarker(), 0xFFffa300, true);
UpdateSuspender.using(surface, () -> {
Collections.addAll(surface.getXAxes(), xAxis);
Collections.addAll(surface.getYAxes(), yAxis);
Collections.addAll(surface.getRenderableSeries(), rSeries1, rSeries2, rSeries3, rSeries4);
Collections.addAll(surface.getChartModifiers(), sciChartBuilder.newModifierGroup()
.withZoomExtentsModifier().build()
.withPinchZoomModifier().build()
.withCursorModifier().withReceiveHandledEvents(true).build()
.withXAxisDragModifier().withReceiveHandledEvents(true).build()
.withYAxisDragModifier().withDragMode(AxisDragMode.Pan).build()
.build());
sciChartBuilder.newAnimator(rSeries1).withWaveTransformation().withInterpolator(new DecelerateInterpolator()).withDuration(3000).withStartDelay(350).start();
sciChartBuilder.newAnimator(rSeries2).withWaveTransformation().withInterpolator(new DecelerateInterpolator()).withDuration(3000).withStartDelay(350).start();
sciChartBuilder.newAnimator(rSeries3).withWaveTransformation().withInterpolator(new DecelerateInterpolator()).withDuration(3000).withStartDelay(350).start();
sciChartBuilder.newAnimator(rSeries4).withWaveTransformation().withInterpolator(new DecelerateInterpolator()).withDuration(3000).withStartDelay(350).start();
});
}
private XyScatterRenderableSeries getScatterRenderableSeries(IPointMarker pointMarker, @ColorInt int color, boolean negative) {
final String seriesName = pointMarker instanceof EllipsePointMarker ?
negative ? "Negative Ellipse" : "Positive Ellipse" :
negative ? "Negative" : "Positive";
final IXyDataSeries<Integer, Double> dataSeries = sciChartBuilder.newXyDataSeries(Integer.class, Double.class).withSeriesName(seriesName).build();
for (int i = 0; i < 200; i++) {
final double time = (i < 100) ? getRandom(0, i + 10) / 100 : getRandom(0, 200 - i + 10) / 100;
final double y = negative ? -time * time * time : time * time * time;
dataSeries.append(i, y);
}
return sciChartBuilder.newScatterSeries()
.withDataSeries(dataSeries)
.withStrokeStyle(color)
.withPointMarker(sciChartBuilder.newPointMarker(pointMarker)
.withSize(6, 6)
.withStroke(0xFFFFFFFF, 0.1f)
.withFill(color)
.build())
.build();
}
private double getRandom(double min, double max) {
return min + (max - min) * random.nextDouble();
}
}