SciChart® the market leader in Fast WPF Charts, WPF 3D Charts, iOS Chart, Android Chart and JavaScript Chart Components
SciChart Android ships with ~90Â Android Chart Examples which you can browse, play with, view the source-code and even export each SciChart Android Chart Example to a stand-alone Android Studio project. All of this is possible with the new and improved SciChart Android Examples Suite, which ships as part of our Android Charts SDK.
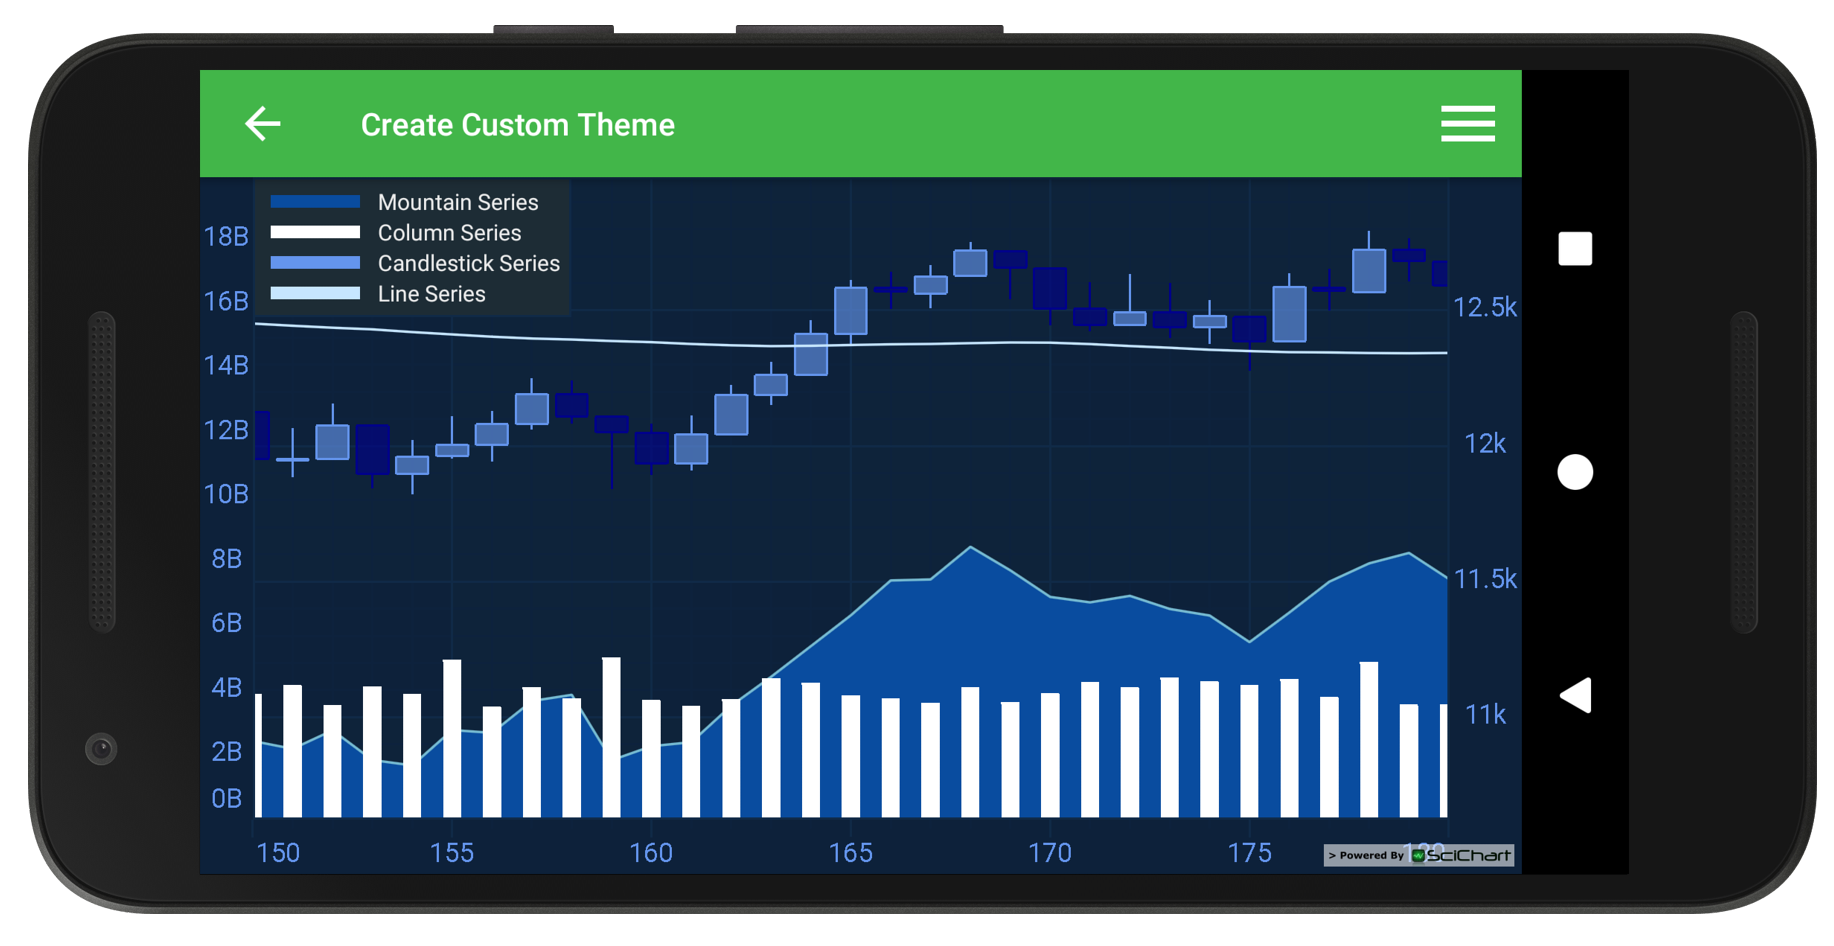
SciChart ships with 8 stunning themes, which you can apply to your charts with a single line of code. This example shows how to style SciChart with your own custom theme, and how it affects default cursor, zoom, axis, grid and series colors.
To include a custom theme in your application, add styles to a resource file in styles.xml, ensuring all the keys are entered for the SciChart theme (see styles.xml). After that, the theme can be applied to SciChart in a single line of code.
Tips!
To define your custom theme you need to override a bunch of drawables and colors and provide a file with style attributes or you can implement IThemeProvider interface on your own.
The full source code for the Android Custom Chart Theme example is included below (Scroll down!).
Did you know you can also view the source code from one of the following sources as well?
//******************************************************************************
// SCICHART® Copyright SciChart Ltd. 2011-2021. All rights reserved.
//
// Web: http://www.scichart.com
// Support: support@scichart.com
// Sales: sales@scichart.com
//
// CustomThemeFragment.kt is part of SCICHART®, High Performance Scientific Charts
// For full terms and conditions of the license, see http://www.scichart.com/scichart-eula/
//
// This source code is protected by international copyright law. Unauthorized
// reproduction, reverse-engineering, or distribution of all or any portion of
// this source code is strictly prohibited.
//
// This source code contains confidential and proprietary trade secrets of
// SciChart Ltd., and should at no time be copied, transferred, sold,
// distributed or made available without express written permission.
//******************************************************************************
package com.scichart.examples.fragments.examples2d.stylingAndTheming.kt
import com.scichart.charting.visuals.SciChartSurface
import com.scichart.charting.visuals.axes.AutoRange.Always
import com.scichart.charting.visuals.axes.AxisAlignment.Left
import com.scichart.charting.visuals.axes.AxisAlignment.Right
import com.scichart.data.model.DoubleRange
import com.scichart.examples.R
import com.scichart.examples.data.DataManager
import com.scichart.examples.fragments.base.ExampleSingleChartBaseFragment
import com.scichart.examples.utils.BillionsLabelProvider
import com.scichart.examples.utils.ThousandsLabelProvider
import com.scichart.examples.utils.interpolator.ElasticOutInterpolator
import com.scichart.examples.utils.scichartExtensions.*
class CustomThemeFragment: ExampleSingleChartBaseFragment() {
override fun initExample(surface: SciChartSurface) {
val dataManager = DataManager.getInstance()
val priceBars = dataManager.getPriceDataIndu(context)
surface.suspendUpdates {
// set theme id from styles
theme = R.style.SciChart_BerryBlue
xAxes {
numericAxis {
growBy = DoubleRange(0.1, 0.1)
visibleRange = DoubleRange(150.0, 180.0)
}
}
yAxes {
numericAxis {
axisId = "PrimaryAxisId"
axisAlignment = Right
autoRange = Always
growBy = DoubleRange(0.1, 0.1)
drawMajorTicks = false
drawMinorTicks = false
labelProvider = ThousandsLabelProvider()
}
numericAxis {
axisId = "SecondaryAxisId"
axisAlignment = Left
autoRange = Always
growBy = DoubleRange(0.0, 3.0)
drawMajorTicks = false
drawMinorTicks = false
labelProvider = BillionsLabelProvider()
}
}
renderableSeries {
fastMountainRenderableSeries {
yAxisId = "PrimaryAxisId"
xyDataSeries<Double, Double>("Mountain Series") {
append(priceBars.indexesAsDouble, dataManager.offset(priceBars.lowData, -1000.0))
}
scaleAnimation { zeroLine = 10500.0; interpolator = ElasticOutInterpolator() }
}
fastCandlestickRenderableSeries {
yAxisId = "PrimaryAxisId"
ohlcDataSeries<Double, Double>("Candlestick Series") {
append(priceBars.indexesAsDouble, priceBars.openData, priceBars.highData, priceBars.lowData, priceBars.closeData)
}
scaleAnimation { zeroLine = 11700.0; interpolator = ElasticOutInterpolator() }
}
fastLineRenderableSeries {
yAxisId = "PrimaryAxisId"
xyDataSeries<Double, Double>("Line Series") {
append(priceBars.indexesAsDouble, dataManager.computeMovingAverage(priceBars.closeData, 50))
}
scaleAnimation { zeroLine = 12250.0; interpolator = ElasticOutInterpolator() }
}
fastColumnRenderableSeries {
yAxisId = "SecondaryAxisId"
xyDataSeries<Double, Long>("Column Series") {
append(priceBars.indexesAsDouble, priceBars.volumeData)
}
scaleAnimation { zeroLine = 10500.0; interpolator = ElasticOutInterpolator() }
}
}
chartModifiers {
defaultModifiers()
legendModifier { setShowCheckboxes(false) }
}
}
}
}
//******************************************************************************
// SCICHART® Copyright SciChart Ltd. 2011-2021. All rights reserved.
//
// Web: http://www.scichart.com
// Support: support@scichart.com
// Sales: sales@scichart.com
//
// CustomThemeFragment.java is part of SCICHART®, High Performance Scientific Charts
// For full terms and conditions of the license, see http://www.scichart.com/scichart-eula/
//
// This source code is protected by international copyright law. Unauthorized
// reproduction, reverse-engineering, or distribution of all or any portion of
// this source code is strictly prohibited.
//
// This source code contains confidential and proprietary trade secrets of
// SciChart Ltd., and should at no time be copied, transferred, sold,
// distributed or made available without express written permission.
//******************************************************************************
package com.scichart.examples.fragments.examples2d.stylingAndTheming;
import androidx.annotation.NonNull;
import com.scichart.charting.model.dataSeries.IOhlcDataSeries;
import com.scichart.charting.model.dataSeries.IXyDataSeries;
import com.scichart.charting.visuals.SciChartSurface;
import com.scichart.charting.visuals.axes.AutoRange;
import com.scichart.charting.visuals.axes.AxisAlignment;
import com.scichart.charting.visuals.axes.IAxis;
import com.scichart.charting.visuals.renderableSeries.FastCandlestickRenderableSeries;
import com.scichart.charting.visuals.renderableSeries.FastColumnRenderableSeries;
import com.scichart.charting.visuals.renderableSeries.FastLineRenderableSeries;
import com.scichart.charting.visuals.renderableSeries.FastMountainRenderableSeries;
import com.scichart.core.framework.UpdateSuspender;
import com.scichart.examples.R;
import com.scichart.examples.data.DataManager;
import com.scichart.examples.data.PriceSeries;
import com.scichart.examples.fragments.base.ExampleSingleChartBaseFragment;
import com.scichart.examples.utils.BillionsLabelProvider;
import com.scichart.examples.utils.ThousandsLabelProvider;
import com.scichart.examples.utils.interpolator.ElasticOutInterpolator;
import java.util.Collections;
public class CustomThemeFragment extends ExampleSingleChartBaseFragment {
@Override
public boolean showDefaultModifiersInToolbar() {
return false;
}
@Override
protected void initExample(@NonNull SciChartSurface surface) {
final IAxis xBottomAxis = sciChartBuilder.newNumericAxis().withGrowBy(0.1d, 0.1d).withVisibleRange(150, 180).build();
final IAxis yRightAxis = sciChartBuilder.newNumericAxis()
.withGrowBy(0.1d, 0.1d)
.withAxisAlignment(AxisAlignment.Right)
.withAutoRangeMode(AutoRange.Always)
.withAxisId("PrimaryAxisId")
.withDrawMajorTicks(false)
.withDrawMinorTicks(false)
.withLabelProvider(new ThousandsLabelProvider())
.build();
final IAxis yLeftAxis = sciChartBuilder.newNumericAxis()
.withGrowBy(0, 3d)
.withAxisAlignment(AxisAlignment.Left)
.withAutoRangeMode(AutoRange.Always)
.withAxisId("SecondaryAxisId")
.withDrawMajorTicks(false)
.withDrawMinorTicks(false)
.withLabelProvider(new BillionsLabelProvider())
.build();
final DataManager dataManager = DataManager.getInstance();
final PriceSeries priceBars = dataManager.getPriceDataIndu(getActivity());
final IXyDataSeries<Double, Double> mountainDataSeries = sciChartBuilder.newXyDataSeries(Double.class, Double.class).withSeriesName("Mountain Series").build();
final IXyDataSeries<Double, Double> lineDataSeries = sciChartBuilder.newXyDataSeries(Double.class, Double.class).withSeriesName("Line Series").build();
final IXyDataSeries<Double, Long> columnDataSeries = sciChartBuilder.newXyDataSeries(Double.class, Long.class).withSeriesName("Column Series").build();
final IOhlcDataSeries<Double, Double> candlestickDataSeries = sciChartBuilder.newOhlcDataSeries(Double.class, Double.class).withSeriesName("Candlestick Series").build();
mountainDataSeries.append(priceBars.getIndexesAsDouble(), dataManager.offset(priceBars.getLowData(), -1000));
candlestickDataSeries.append(priceBars.getIndexesAsDouble(), priceBars.getOpenData(), priceBars.getHighData(), priceBars.getLowData(), priceBars.getCloseData());
lineDataSeries.append(priceBars.getIndexesAsDouble(), dataManager.computeMovingAverage(priceBars.getCloseData(), 50));
columnDataSeries.append(priceBars.getIndexesAsDouble(), priceBars.getVolumeData());
final FastMountainRenderableSeries mountainSeries = sciChartBuilder.newMountainSeries().withDataSeries(mountainDataSeries).withYAxisId("PrimaryAxisId").build();
final FastLineRenderableSeries lineSeries = sciChartBuilder.newLineSeries().withDataSeries(lineDataSeries).withYAxisId("PrimaryAxisId").build();
final FastColumnRenderableSeries columnSeries = sciChartBuilder.newColumnSeries().withDataSeries(columnDataSeries).withYAxisId("SecondaryAxisId").build();
final FastCandlestickRenderableSeries candlestickSeries = sciChartBuilder.newCandlestickSeries().withDataSeries(candlestickDataSeries).withYAxisId("PrimaryAxisId").build();
UpdateSuspender.using(surface, () -> {
// set theme id from styles
surface.setTheme(R.style.SciChart_BerryBlue);
Collections.addAll(surface.getXAxes(), xBottomAxis);
Collections.addAll(surface.getYAxes(), yRightAxis, yLeftAxis);
Collections.addAll(surface.getRenderableSeries(), mountainSeries, columnSeries, candlestickSeries, lineSeries);
Collections.addAll(surface.getChartModifiers(), sciChartBuilder.newModifierGroupWithDefaultModifiers().withLegendModifier().withShowCheckBoxes(false).build().build());
sciChartBuilder.newAnimator(mountainSeries).withScaleTransformation(10500d).withInterpolator(new ElasticOutInterpolator()).withDuration(3000).withStartDelay(350).start();
sciChartBuilder.newAnimator(candlestickSeries).withScaleTransformation(11700d).withInterpolator(new ElasticOutInterpolator()).withDuration(3000).withStartDelay(350).start();
sciChartBuilder.newAnimator(lineSeries).withScaleTransformation(12250d).withInterpolator(new ElasticOutInterpolator()).withDuration(3000).withStartDelay(350).start();
sciChartBuilder.newAnimator(columnSeries).withScaleTransformation(10500d).withInterpolator(new ElasticOutInterpolator()).withDuration(3000).withStartDelay(350).start();
});
}
}