Android Chart - Examples
SciChart Android ships with ~90 Android Chart Examples which you can browse, play with, view the source-code and even export each SciChart Android Chart Example to a stand-alone Android Studio project. All of this is possible with the new and improved SciChart Android Examples Suite, which ships as part of our Android Charts SDK.
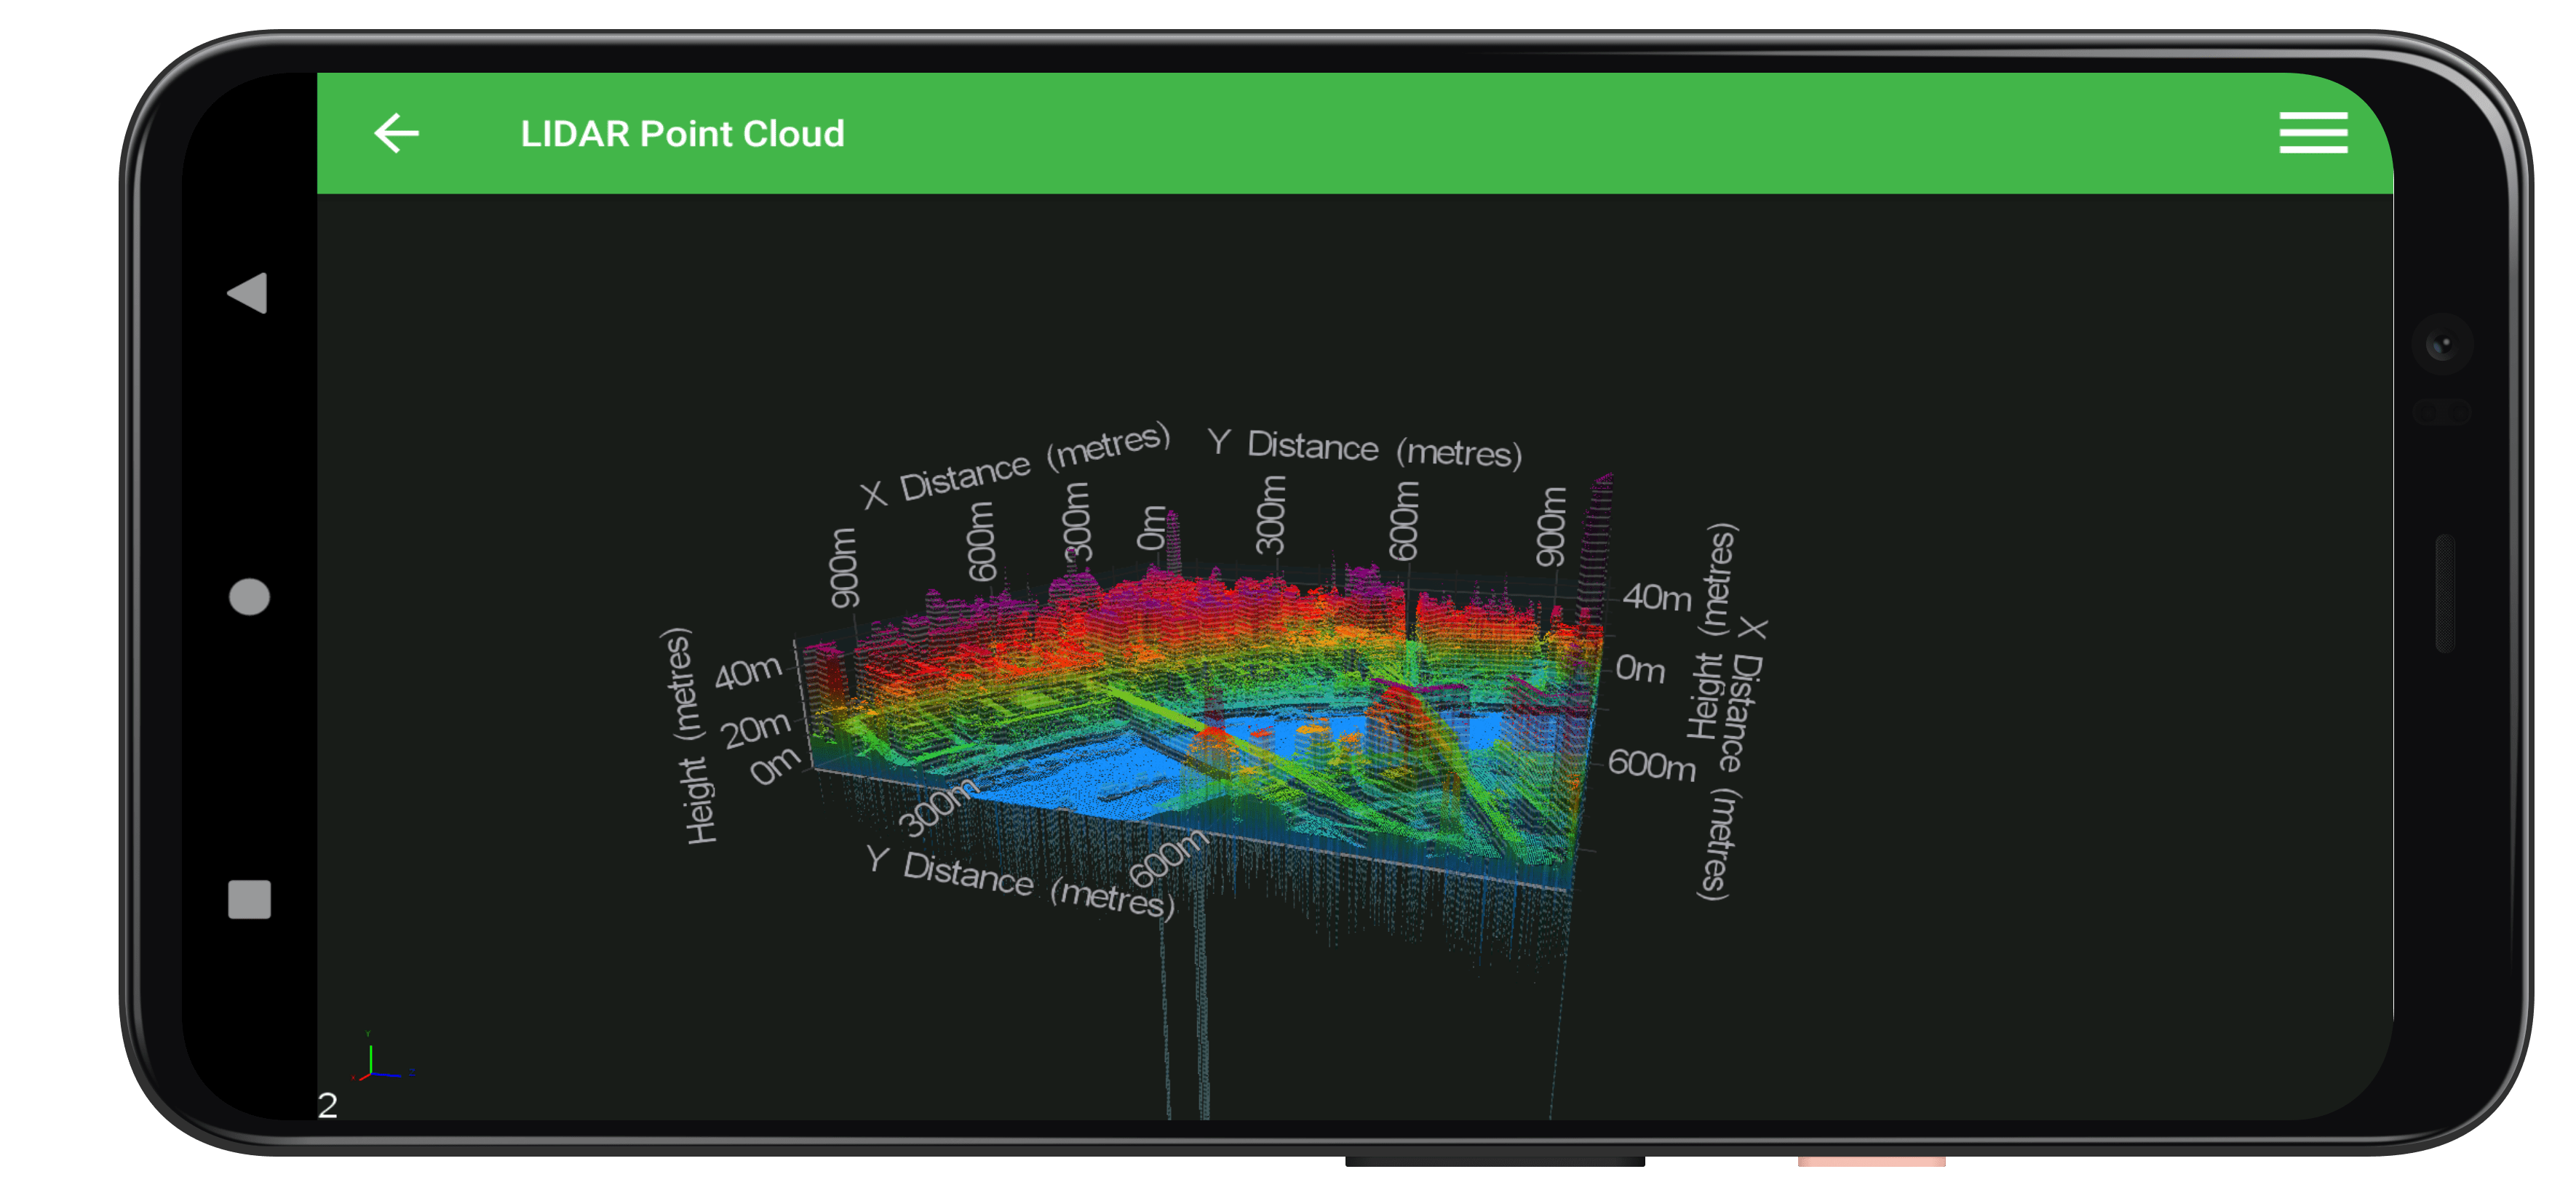
This example demonstrates that SciChart Android is much more than just charts and it can be used for advanced visualizations, in this example to visualize the LiDAR data.
LiDAR data can be collected from a variety of sources, we have used the publicly available data set of UAV data of one of the UK regions. The LiDAR data, which is in .asc format is visualized with SciChart Android ScatterRenderableSeries3D with SpherePointMarker3D and SurfaceMeshRenderableSeries3D.
You can see this graphics on your Android phone or tablet. It is used across domains anything from defence to energy, civil engineering and more.
The full source code for the Android 3D Realtime Waterfall Chart example is included below (Scroll down!).
Did you know you can also view the source code from one of the following sources as well?
- Clone the SciChart.Android.Examples from Github.
- Or, view source and export each example to an Android Studio project from the Java version of the SciChart Android Examples app.
- Also the SciChart Android Trial contains the full source for the examples (link below).


