Android Chart - Examples
SciChart Android ships with ~90 Android Chart Examples which you can browse, play with, view the source-code and even export each SciChart Android Chart Example to a stand-alone Android Studio project. All of this is possible with the new and improved SciChart Android Examples Suite, which ships as part of our Android Charts SDK.
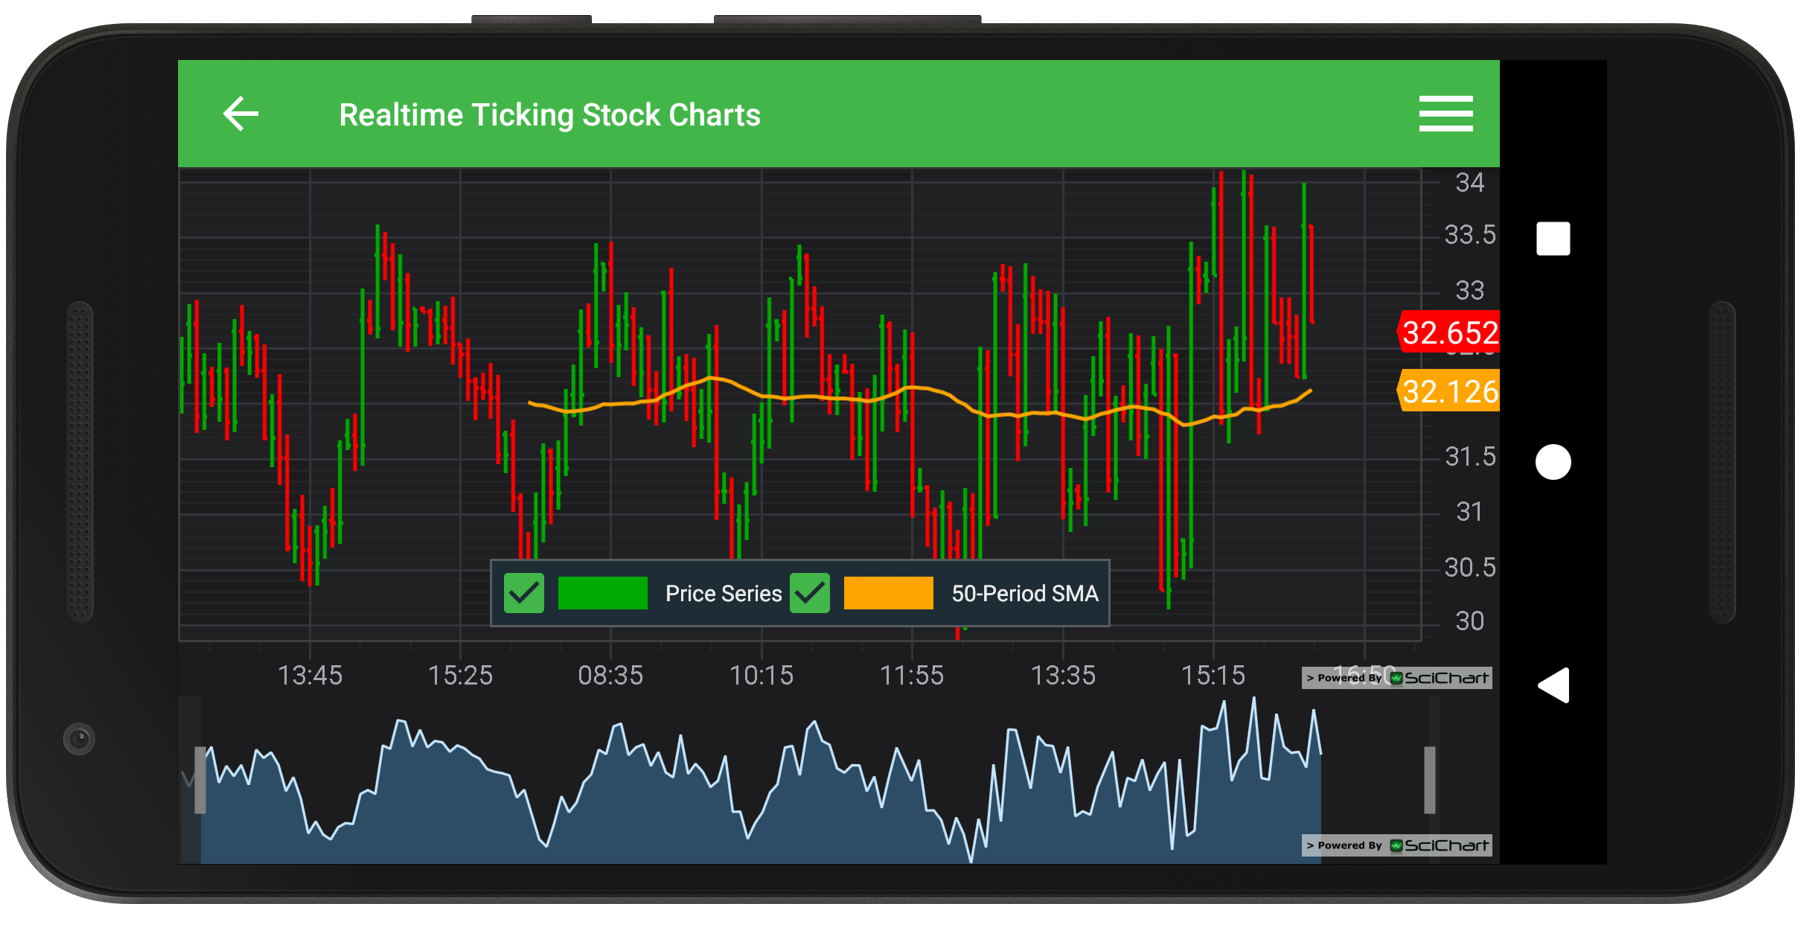
The Realtime Ticking Stock Charts example showcases real-time ticking stock charts. In the source-code you will see that we use the OhlcDataSeries.append() and OhlcDataSeries.update() methods to add new data to the chart when a timer ticks. Also, the VisibleRange on the X Axis is updated manually via the IRange.setMinMaxDouble() method. The VisibleRange on the Y Axis is adjusted automatically as new data comes due to Autoranging.
Example Usage
– Press the START button to start the real-time update or the PAUSE button to stop it.
– You can freely Pan the chart in horizontal direction even when it’s being updated.
– The X Axis can be dragged to scale the chart in horizontal direction.
– Double-tapping restores zoom level to the extents of the data.
– The Legend can be used to hide or show chart series.
The full source code for the Android Realtime Ticking Stock Charts example is included below (Scroll down!).
Did you know you can also view the source code from one of the following sources as well?
- Clone the SciChart.Android.Examples from Github.
- Or, view source and export each example to an Android Studio project from the Java version of the SciChart Android Examples app.
- Also the SciChart Android Trial contains the full source for the examples (link below).


