Android Chart - Examples
SciChart Android ships with ~90 Android Chart Examples which you can browse, play with, view the source-code and even export each SciChart Android Chart Example to a stand-alone Android Studio project. All of this is possible with the new and improved SciChart Android Examples Suite, which ships as part of our Android Charts SDK.
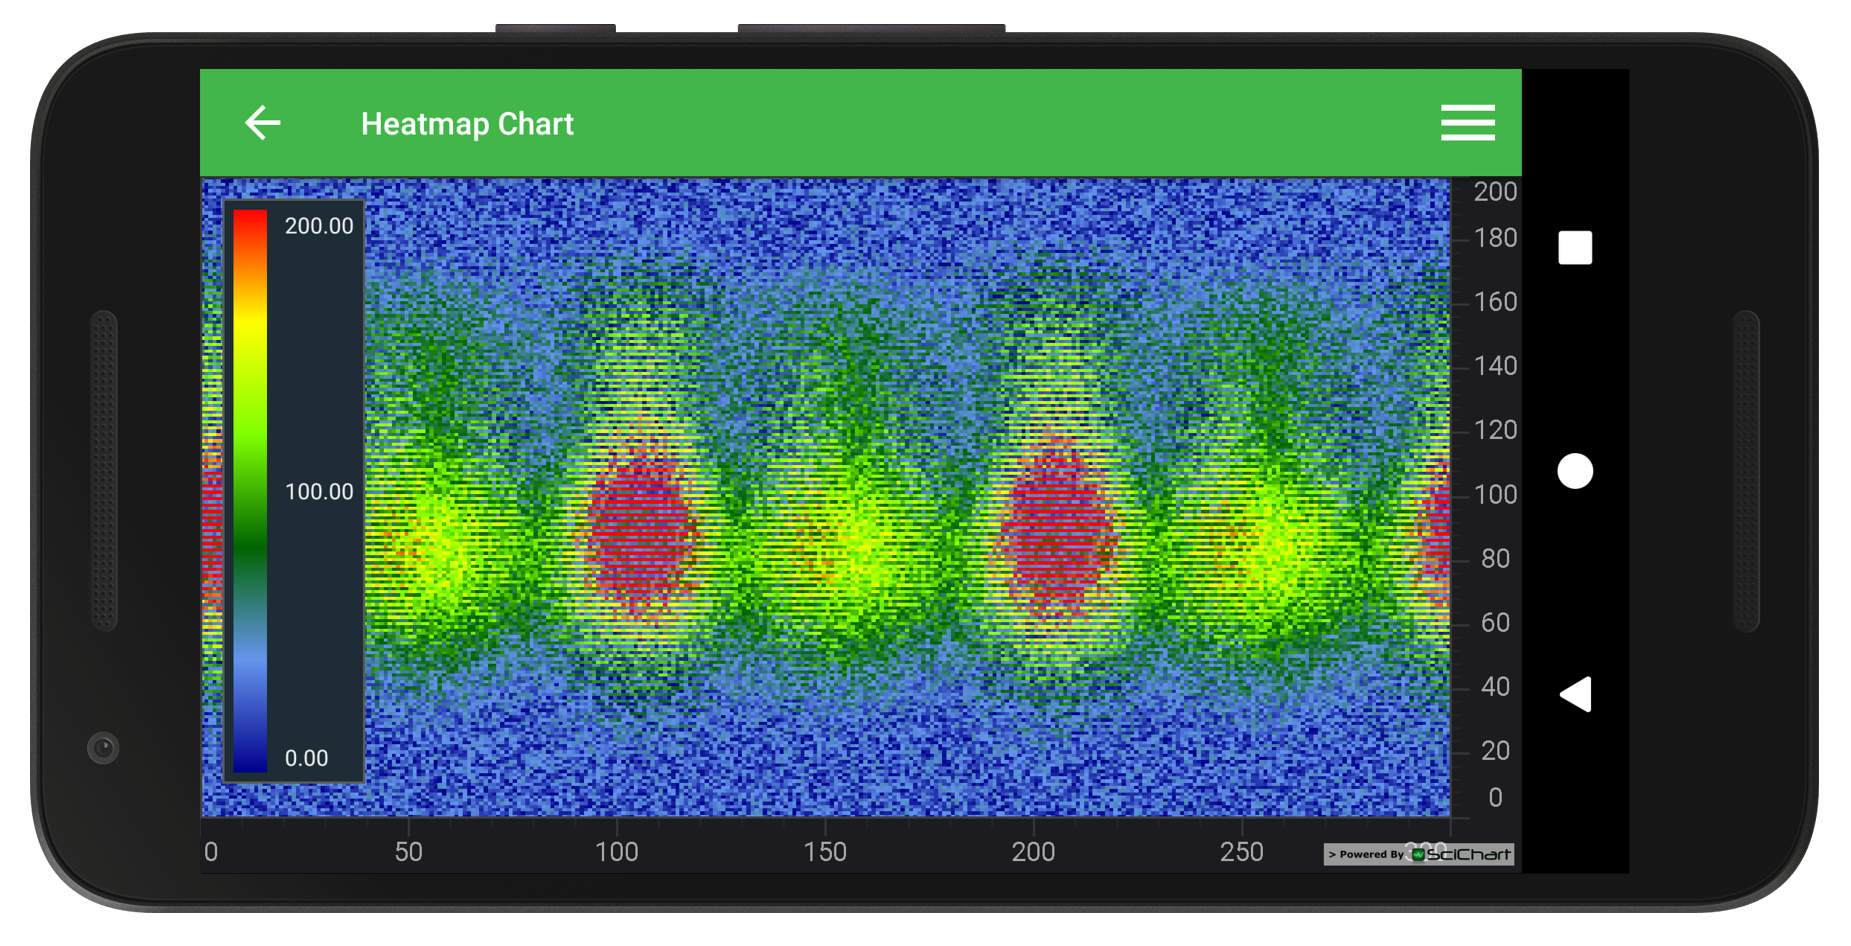
Demonstrates how to use FastUniformHeatmapRenderableSeries and create a real-time Heatmap in SciChart for Android.
Android Heatmap Charts can be used to visualize a variety of scientific and statistical data. Display a real-time spectrogram (Fourier Transform plus Time) of audio data. To overlay areas of heat on a background image such as a map or image, or to quickly bring to life 2-dimensional data and show the relative intensities via the heat color.
The FastUniformHeatmapRenderableSeries requires an UniformHeatmapDataSeries, which contains 1D array with heatmap values and ColorMap instance which allows to map values to colors.
In this example you also can tap and drag on the chart to see the animated-zoom performance while the heatmap is updating.
Tip!
You can enable drawing of heatmap value inside each cell by calling setDrawTextInCell(True)
The full source code for the Android Heatmap Chart example is included below (Scroll down!).
Did you know you can also view the source code from one of the following sources as well?
- Clone the SciChart.Android.Examples from Github.
- Or, view source and export each example to an Android Studio project from the Java version of the SciChart Android Examples app.
- Also the SciChart Android Trial contains the full source for the examples (link below).


