The Free Surface 3D Chart Type
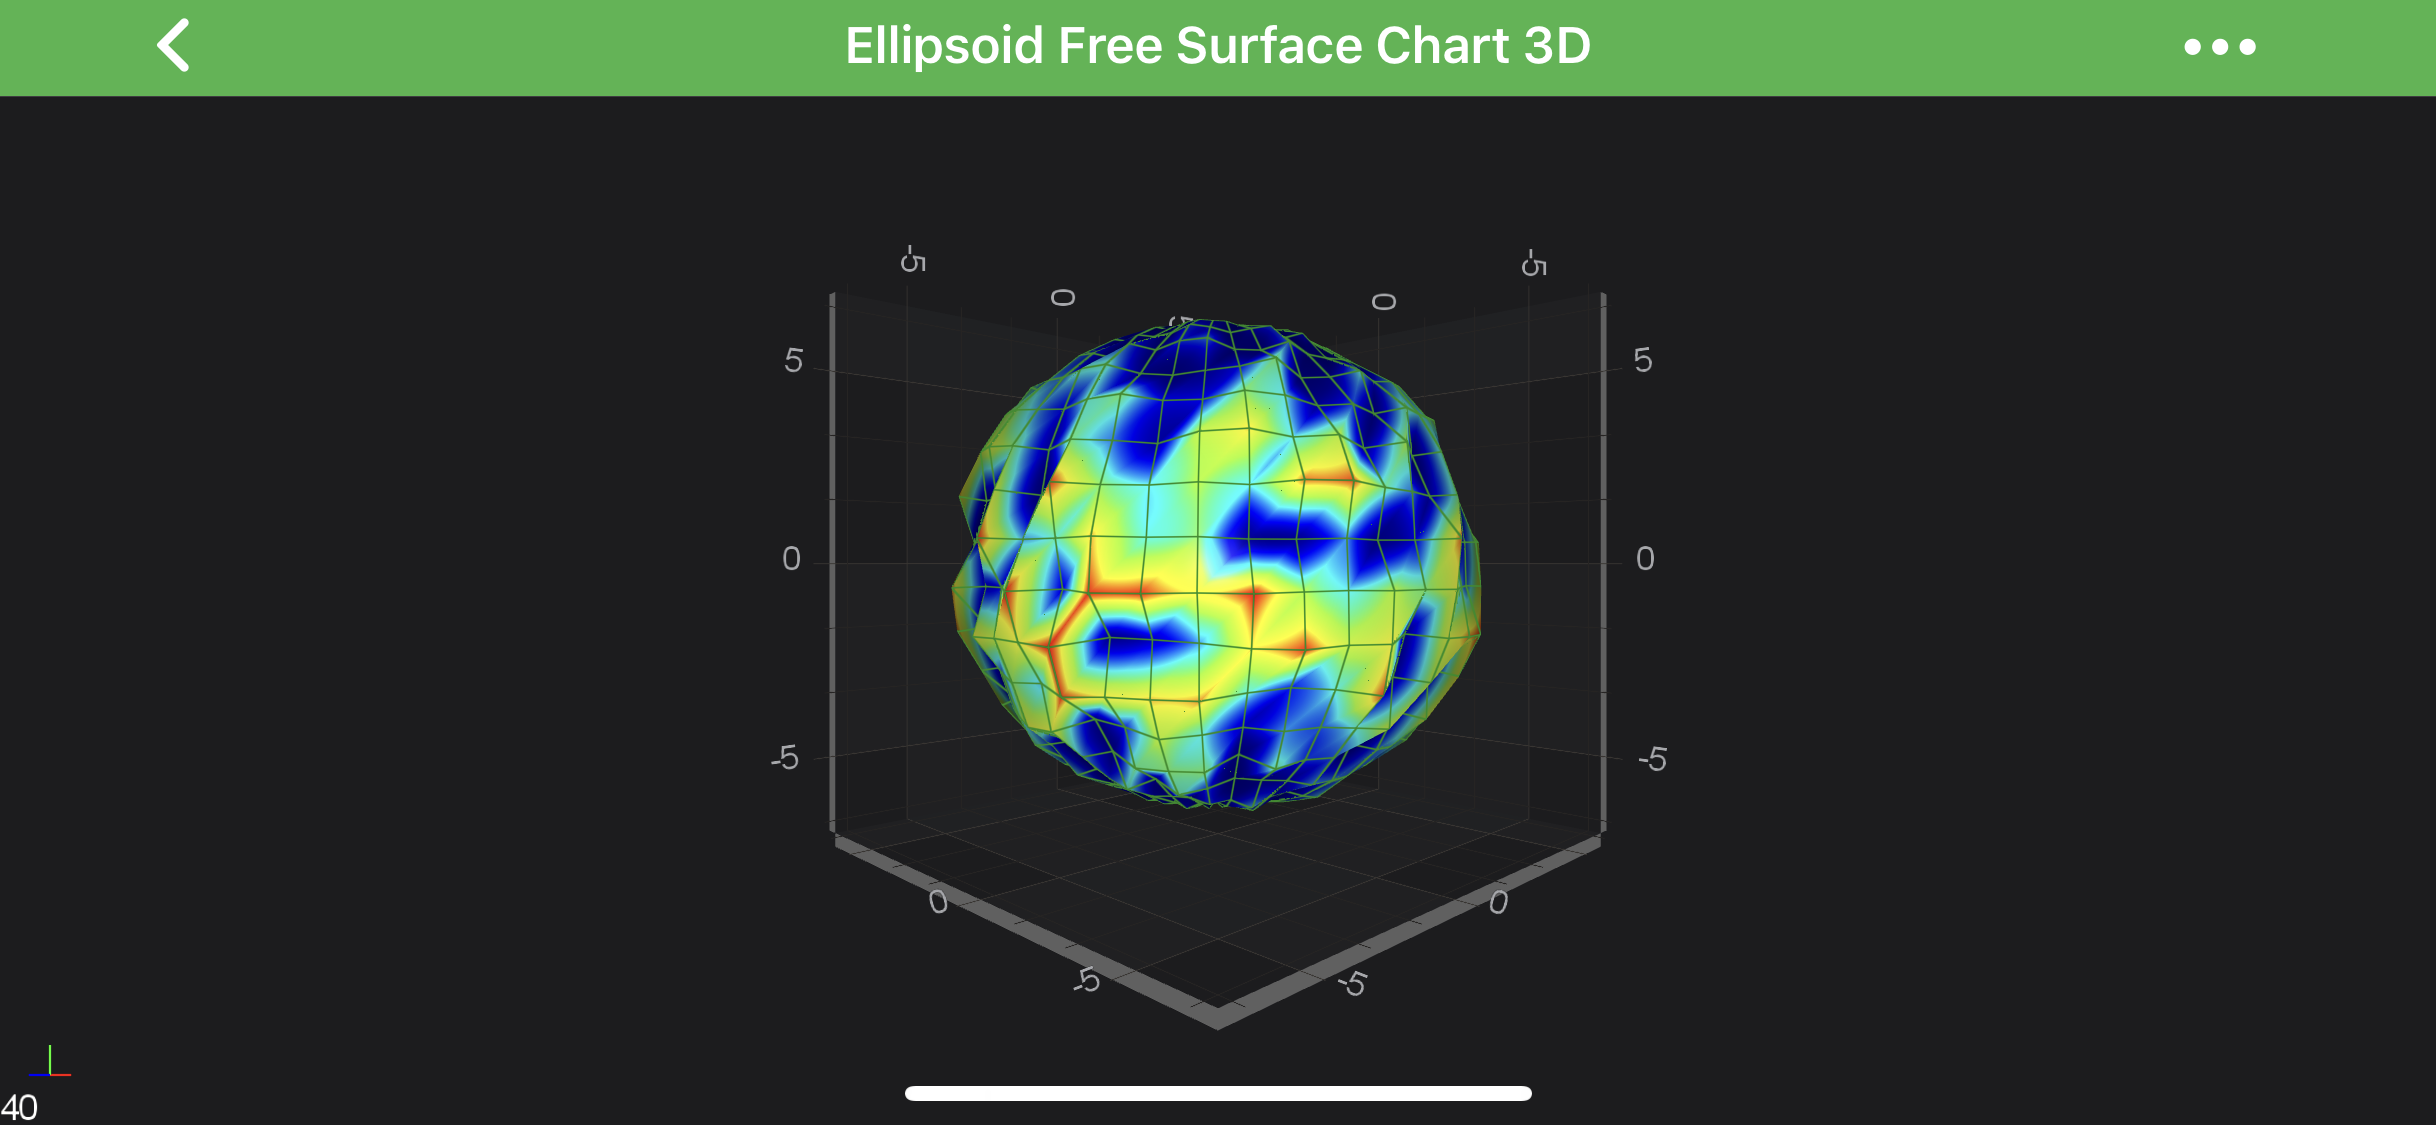
The Free Surface 3D Chart types are a set of 3D Charts that represent the data by plotting the surface in a custom shape in 3D space.
It's represented by the FreeSurfaceRenderableSeries3D in SciChart, and can be configured with different FreeSurfaceDataSeries3D<TX,TY,TZ>.
The Free Surface 3D Chart Types can be divided into a two groups:
- constrained to its basic 3D primitive
- unconstrained - free surface.
You can find more information about individual Free Surface types in the corresponding sections of this article.

Constrained Free Surface 3D Types
Each of constrained chart type represents its basic primitive. There is a 3 constrained free-surface types available out of the box in SciChart: a sphere, a cylinder, or a disk.
The Surface of such charts can be modified by the 2D offset array.
Each particular type of the constrained 3D chart specifies how the surface can be offset:
- The Ellipsoid Chart - offsets its points on the surface in each of
XYZ axesproportionality, based on the location of its origin. - The Cylindroid Chart - offsets the surface in
XZ axes, based on its Y-axis aligned origin line. - The Polar 3D Chart - offsets its surface in
Y-axis, based on XZ axes origin plane.
Unconstrained Free Surface 3D Type
In contrast to the constrained chart types, The Custom Free Surface 3D Chart isn’t based on any geometric primitive. The shape of its surface is defined by a set of user-defined functions, injected in the constructor during the instantiation. This approach allows the surface to obtain any possible shape.
Configuring Free Surface 3D Series
Most of the configuration options follow the same approach as it is in The SurfaceMesh 3D Chart Type so all of the following are also applicable to Free Surface Meshes:
- Applying Palettes to the Surface Meshes
- Configuring Wireframe and Contours
- Overriding Specific Cell Colors
Despite the similarity of configuration to other 3D charts, Free Surface 3D Charts have some unique options. One of them is the Palette Mode, determining which color is picked from the Palette based on its four components:
- The Axial Palette Component
- The Radial Palette Component
- The Azimuthal Palette Component
- The Polar Palette Component
Each of components can be used separately or blended together, based on values of corresponding Factor properties. Below is the formula that determines the color of the Palette:
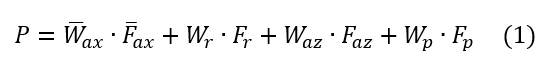
- P - is the coordinate that determines color being picked from the Palette by its value in the ange
[0..1]; - Wax - the axial weight
3D vector; - Fax - the axial factor specified by the paletteAxialFactor 3D vector.
- Wr - the radial weight;
- Fr - the radial factor specified by the paletteRadialFactor property.
- Waz - the azimuthal weight;
- Faz - the azimuthal factor specified by the paletteAzimuthalFactor property.
- Wp - the polar weight;
- Fp - the polar factor specified by the palettePolarFactor property.
All of the components are 0 by default, except Radial which is equal to 1.
To learn more about each of the component - read on the following section of this article.
The Axial Palette Component
In this mode, palette color is determined by the position of a particular point on the surface that linearly interpolates between the user-specified minimum and maximum values. The axial component is controlled by the paletteAxialFactor vector.
The weight of the Axial Palette Component is calculated by following formula:
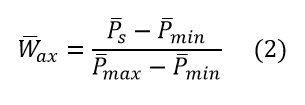
- Ps - is the position of a particular point on the surface;
- Pmin - is specified by the paletteMinimum property;
- Pmax - is specified by the paletteMaximum property;
See how it works in the code below:
final int[] colors = new int[]{0xFF00008B, 0xFF0000FF, 0xFF00FFFF, 0xFFADFF2F, 0xFFFFFF00, 0xFFFF0000, 0xFF8B0000};
final float[] stops = new float[]{0, .1f, .3f, .5f, .7f, .9f, 1};
final GradientColorPalette palette = new GradientColorPalette(colors, stops);

final FreeSurfaceRenderableSeries3D rs = new FreeSurfaceRenderableSeries3D();
rs.setMeshColorPalette(palette);
rs.setPaletteMinMaxMode(FreeSurfacePaletteMinMaxMode.Absolute);
rs.setPaletteMinimum(new Vector3(0f, -4f, 0f));
rs.setPaletteMaximum(new Vector3(0f, 4f, 0f));
rs.setPaletteAxialFactor(new Vector3(0f, 1f, 0f));

The Radial Palette Component
The Radial component is controlled by the paletteRadialFactor property. It is quite simple, similar to the 2d heatmaps, see the example below:
final int[] colors = new int[]{0xFF00008B, 0xFF0000FF, 0xFF00FFFF, 0xFFADFF2F, 0xFFFFFF00, 0xFFFF0000, 0xFF8B0000};
final float[] stops = new float[]{0, .1f, .3f, .5f, .7f, .9f, 1};
final GradientColorPalette palette = new GradientColorPalette(colors, stops);

final FreeSurfaceRenderableSeries3D rs = new FreeSurfaceRenderableSeries3D();
rs.setMeshColorPalette(palette);
rs.setPaletteMinMaxMode(FreeSurfacePaletteMinMaxMode.Relative);
rs.setPaletteMinimum(new Vector3(0f, 6f, 0f));
rs.setPaletteMaximum(new Vector3(0f, 7f, 0f));
rs.setPaletteRadialFactor(1);
The Azimuthal Palette Component
In this mode palette color is determined by cos angle between the unit vector of the X-Axis and vector from the origin point to the particular point on the surface, projected onto the XZ plane. The azimuthal component is controlled by the paletteAzimuthalFactor property.
The weight of the Azimuthal Palette Component is calculated by the following formula:
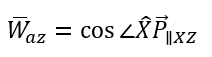
- X - is the unit vector of the
X-Axis; - Pxz - is a particular point on the surface, projected onto the XZ plane;
See how it works in the code below:
final int[] colors = new int[]{0xFF00008B, 0xFF0000FF, 0xFF00FFFF, 0xFFADFF2F, 0xFFFFFF00, 0xFFFF0000, 0xFF8B0000};
final float[] stops = new float[]{0, .1f, .3f, .5f, .7f, .9f, 1};
final GradientColorPalette palette = new GradientColorPalette(colors, stops);

final FreeSurfaceRenderableSeries3D rs = new FreeSurfaceRenderableSeries3D();
rs.setMeshColorPalette(palette);
rs.setPaletteMinMaxMode(FreeSurfacePaletteMinMaxMode.Relative);
rs.setPaletteMinimum(new Vector3(0f, 6f, 0f));
rs.setPaletteMaximum(new Vector3(0f, 7f, 0f));
rs.setPaletteAzimuthalFactor(1);

- Y - is the unit vector of the
Y-Axis; - P - is a particular point on the surface.
See how it works in the code below:
final int[] colors = new int[]{0xFF00008B, 0xFF0000FF, 0xFF00FFFF, 0xFFADFF2F, 0xFFFFFF00, 0xFFFF0000, 0xFF8B0000};
final float[] stops = new float[]{0, .1f, .3f, .5f, .7f, .9f, 1};
final GradientColorPalette palette = new GradientColorPalette(colors, stops);

final FreeSurfaceRenderableSeries3D rs = new FreeSurfaceRenderableSeries3D();
rs.setMeshColorPalette(palette);
rs.setPaletteMinMaxMode(FreeSurfacePaletteMinMaxMode.Relative);
rs.setPaletteMinimum(new Vector3(0f, 6f, 0f));
rs.setPaletteMaximum(new Vector3(0f, 7f, 0f));
rs.setPalettePolarFactor(1);
