Search Results for

    Show / Hide Table of Contents

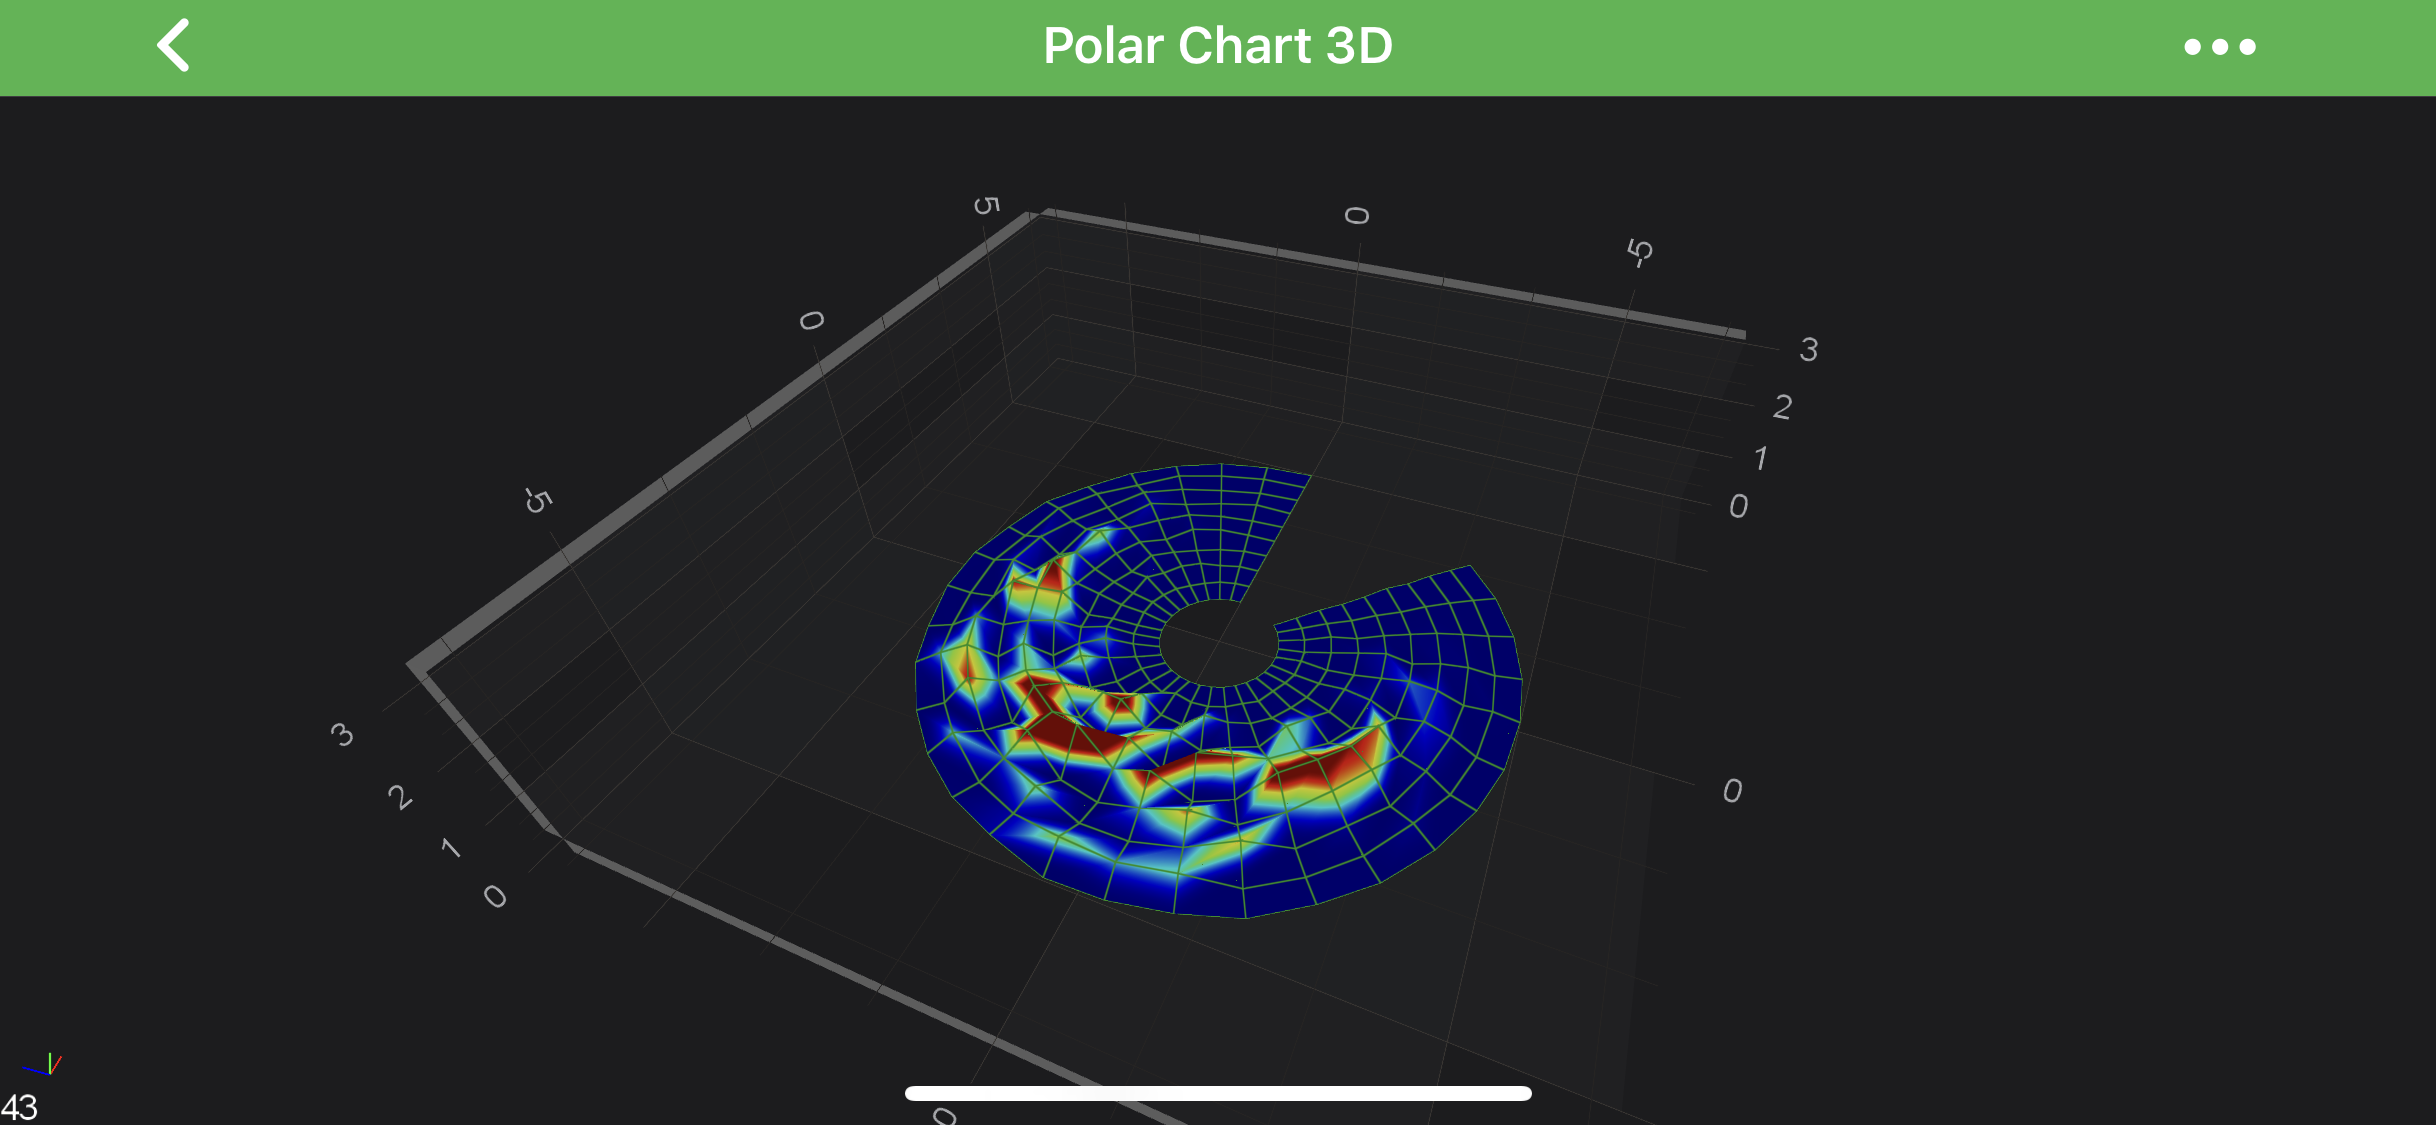
    The Polar 3D Chart Type

    In SciChart, Polar 3D Charts are provided by the combination of the Free Surface 3D Series and PolarDataSeries3D<TPolar,THeight> underlying DataSeries.

    The location of the PolarDataSeries3D<TPolar,THeight> is defined by following properties:

    • offsetX – a location of the Polar by the X-Axis;
    • offsetY – a location of the Polar by the Y-Axis;
    • offsetZ – a location of the Polar by the Z-Axis;

    The size of the CylindroidDataSeries3D<TXZ,TY> is defined by following properties:

    • a – a distance from the origin to the internal edge of the cylindroid 3D Surface;
    • b – a distance from the origin to the external edge of the cylindroid 3D Surface;

    Polar Chart 3D

    Note

    Examples for the Polar Series 3D can be found in the SciChart Android Examples Suite as well as on GitHub:

    • Native Example
    • Xamarin Example

    Create a Polar 3D Chart

    To create a Polar 3D Chart, use the following code:

    • Java
    • Java with Builders API
    • Kotlin
    final int sizeU = 30, sizeV = 10;
    
    final PolarDataSeries3D<Double, Double> meshDataSeries = new PolarDataSeries3D<>(Double.class, Double.class, sizeU, sizeV, 0d, Math.PI * 1.75);
    meshDataSeries.setA(1d);
    meshDataSeries.setB(5d);
    
    final Random random = new Random();
    for (int u = 0; u < sizeU; u++) {
        final double weightU = 1d - Math.abs(2d * u / sizeU - 1d);
        for (int v = 0; v < sizeV; v++) {
            final double weightV = 1d - Math.abs(2d * v / sizeV - 1d);
            final double offset = random.nextDouble();
    
            meshDataSeries.setDisplacement(u, v, offset * weightU * weightV);
        }
    }
    
    final int[] colors = new int[]{0xFF00008B, 0xFF0000FF, 0xFF00FFFF, 0xFFADFF2F, 0xFFFFFF00, 0xFFFF0000, 0xFF8B0000};
    final float[] stops = new float[]{0, .1f, .3f, .5f, .7f, .9f, 1};
    final GradientColorPalette palette = new GradientColorPalette(colors, stops);
    
    final FreeSurfaceRenderableSeries3D rs = new FreeSurfaceRenderableSeries3D();
    rs.setDataSeries(meshDataSeries);
    rs.setDrawMeshAs(DrawMeshAs.SolidWireframe);
    rs.setStroke(0x77228B22);
    rs.setContourInterval(0.1f);
    rs.setContourStroke(0x77228B22);
    rs.setStrokeThickness(convertValueToDp(2f));
    rs.setLightingFactor(0.8f);
    rs.setMeshColorPalette(palette);
    rs.setPaletteMinMaxMode(FreeSurfacePaletteMinMaxMode.Relative);
    rs.setPaletteMinimum(new Vector3(0f, 0f, 0f));
    rs.setPaletteMaximum(new Vector3(0f, 0.5f, 0f));
    
    final int sizeU = 30, sizeV = 10;
    
    final PolarDataSeries3D<Double, Double> meshDataSeries = new PolarDataSeries3D<>(Double.class, Double.class, sizeU, sizeV, 0d, Math.PI * 1.75);
    meshDataSeries.setA(1d);
    meshDataSeries.setB(5d);
    
    final Random random = new Random();
    for (int u = 0; u < sizeU; u++) {
        final double weightU = 1d - Math.abs(2d * u / sizeU - 1d);
        for (int v = 0; v < sizeV; v++) {
            final double weightV = 1d - Math.abs(2d * v / sizeV - 1d);
            final double offset = random.nextDouble();
    
            meshDataSeries.setDisplacement(u, v, offset * weightU * weightV);
        }
    }
    
    final int[] colors = new int[]{0xFF00008B, 0xFF0000FF, 0xFF00FFFF, 0xFFADFF2F, 0xFFFFFF00, 0xFFFF0000, 0xFF8B0000};
    final float[] stops = new float[]{0, .1f, .3f, .5f, .7f, .9f, 1};
    final GradientColorPalette palette = new GradientColorPalette(colors, stops);
    
    final FreeSurfaceRenderableSeries3D rs = sciChart3DBuilder.newFreeSurfaceSeries3D()
            .withDataSeries(meshDataSeries)
            .withDrawMeshAs(DrawMeshAs.SolidWireframe)
            .withStroke(0x77228B22)
            .withContourInterval(0.1f)
            .withContourStroke(0x77228B22)
            .withStrokeThicknes(2f)
            .withLightingFactor(0.8f)
            .withMeshColorPalette(palette)
            .withPaletteMinMaxMode(FreeSurfacePaletteMinMaxMode.Relative)
            .withPaletteMinimum(new Vector3(0f, 0f, 0f))
            .withPaletteMaximum(new Vector3(0f, 0.5f, 0f))
            .build();
    
    val sizeU = 30
    val sizeV = 10
    
    val meshDataSeries = PolarDataSeries3D(Double::class.java, Double::class.java, sizeU, sizeV, 0.0, Math.PI * 1.75)
    
    meshDataSeries.a = 1.0
    meshDataSeries.b = 5.0
    
    val random = Random()
    for (u in 0 until sizeU) {
        val weightU = 1.0 - Math.abs(2.0 * u / sizeU - 1.0)
        for (v in 0 until sizeV) {
            val weightV = 1.0 - Math.abs(2.0 * v / sizeV - 1.0)
            val offset = random.nextDouble()
            meshDataSeries.setDisplacement(u, v, offset * weightU * weightV)
        }
    }
    
    val colors = intArrayOf(0xFF00008B.toInt(), 0xFF0000FF.toInt(), 0xFF00FFFF.toInt(), 0xFFADFF2F.toInt(), 0xFFFFFF00.toInt(), 0xFFFF0000.toInt(), 0xFF8B0000.toInt())
    val stops = floatArrayOf(0f, .1f, .3f, .5f, .7f, .9f, 1f)
    val palette = GradientColorPalette(colors, stops)
    
    val rs = FreeSurfaceRenderableSeries3D()
    rs.dataSeries = meshDataSeries
    rs.drawMeshAs = DrawMeshAs.SolidWireframe
    rs.stroke = 0x77228B22
    rs.contourInterval = 0.1f
    rs.contourStroke = 0x77228B22
    rs.strokeThickness = convertValueToDp(2f)
    rs.lightingFactor = 0.8f
    rs.meshColorPalette = palette
    rs.paletteMinMaxMode = FreeSurfacePaletteMinMaxMode.Relative
    rs.paletteMinimum = Vector3(0f, 0f, 0f)
    rs.paletteMaximum = Vector3(0f, 0.5f, 0f)
    
    Note

    See other constrained and unconstrained Free Surface Series types in the corresponding articles.

    Back to top © 2011-2025 SciChart. All rights reserved. | sitemap.xml