The Impulse (Stem) Series Type
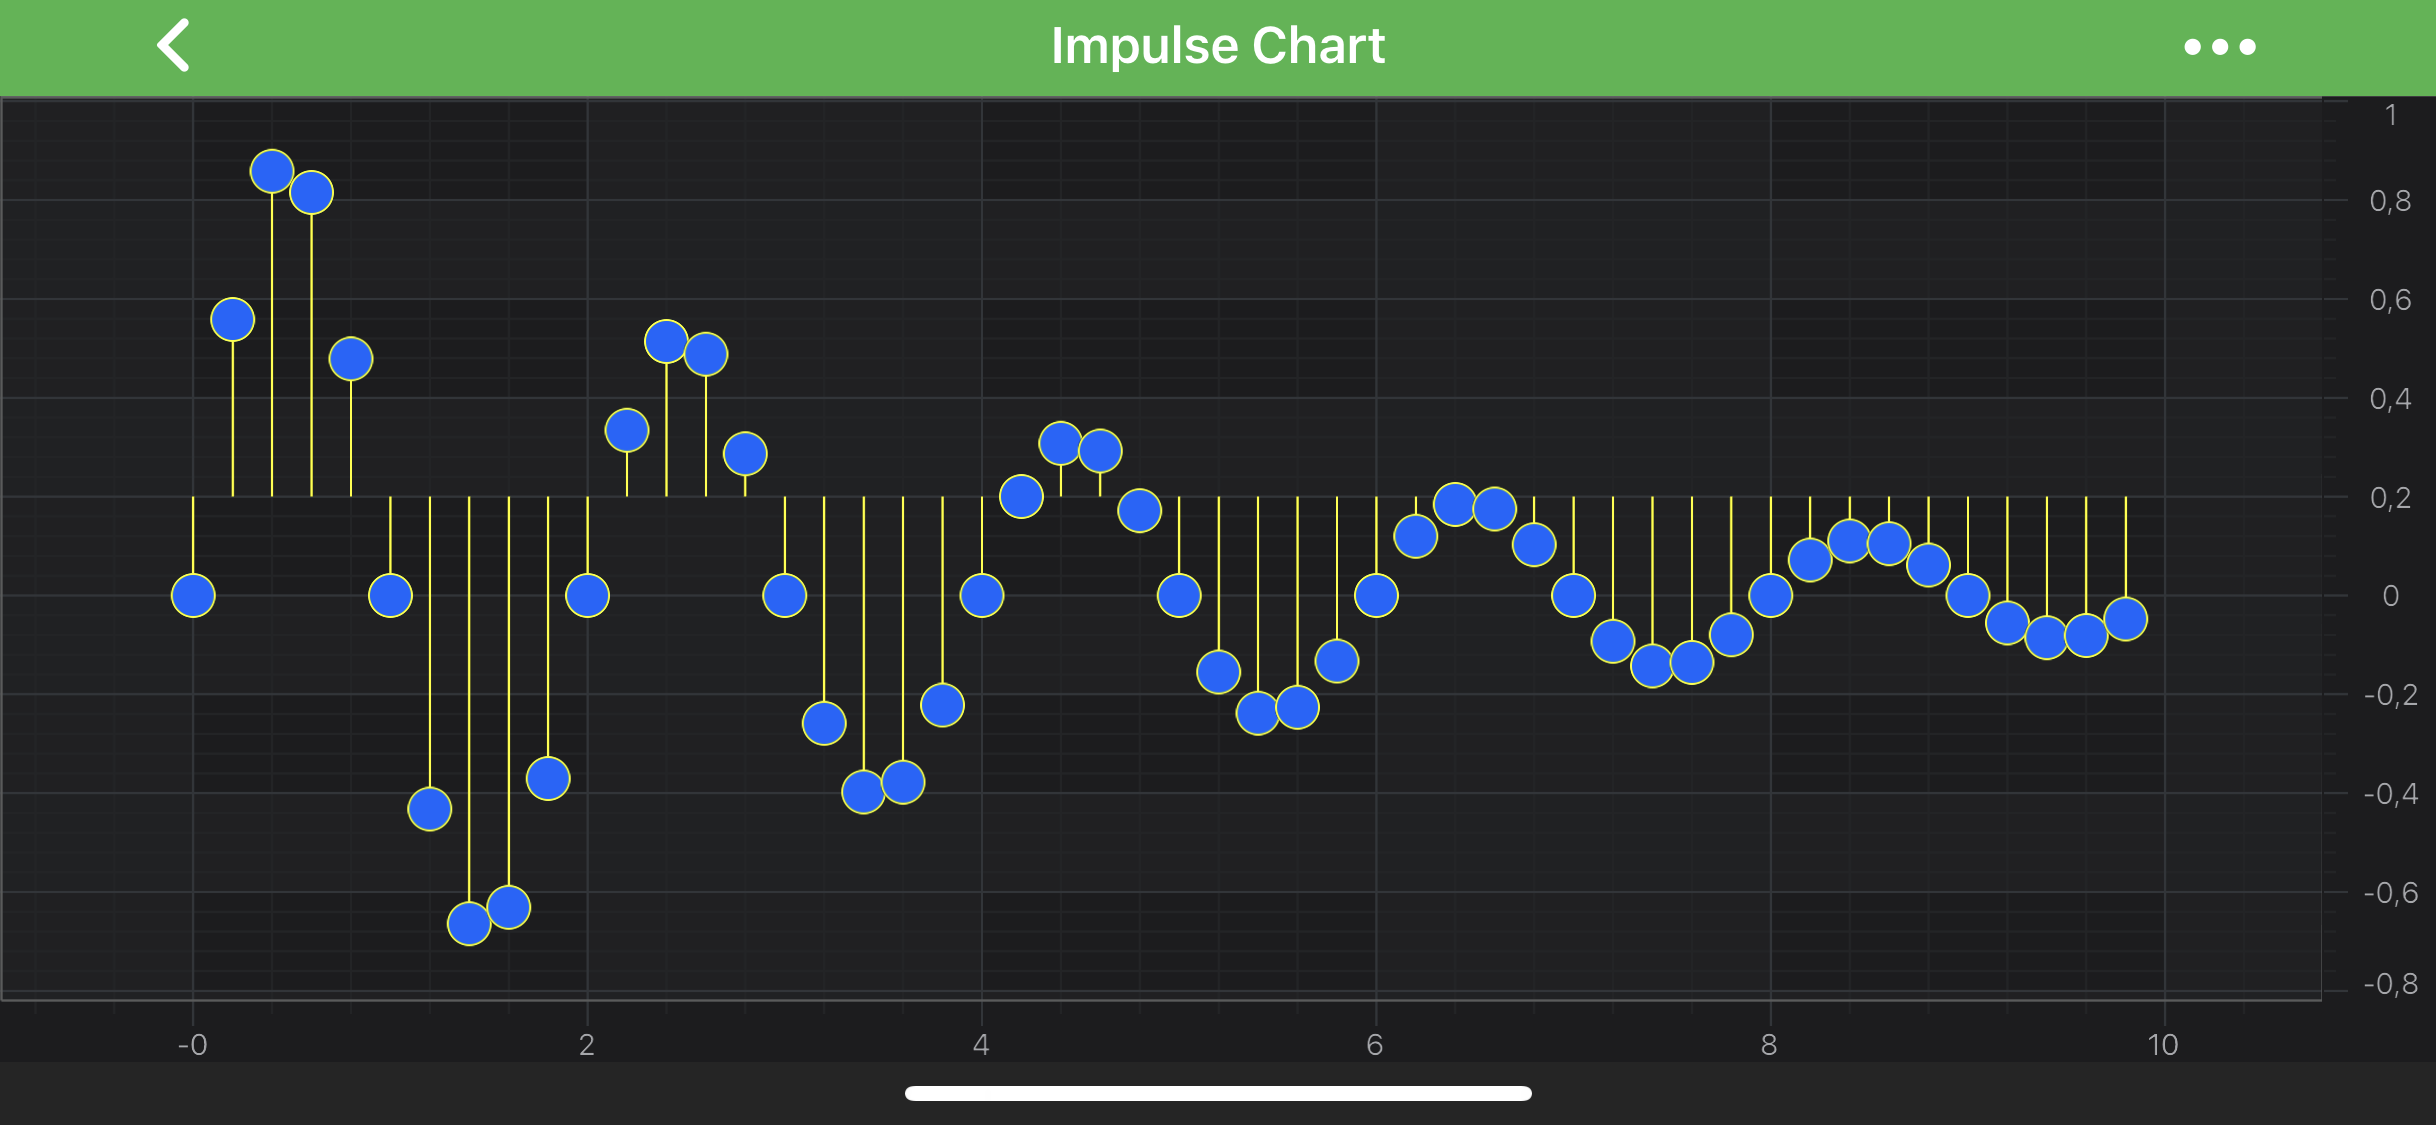
Impulse Charts are provided by the FastImpulseRenderableSeries class and is a hybrid of Column Series and Scatter Series. It accepts data (X, Y) from a XyDataSeries<TX,TY> and draws a single line from zeroLineY to the [X, Y] value with an optional IPointMarker.
Note
Examples for the Impulse Series can be found in the SciChart Android Examples Suite as well as on GitHub:
Like the XyScatterRenderableSeries type, FastImpulseRenderableSeries requires a shape to be specified for the Point Markers. There are several shapes available out of the box, as well as it is possible to define custom shapes of the Point Markers.
Note
For the detailed description of Point Markers, please see the PointMarkers API article.
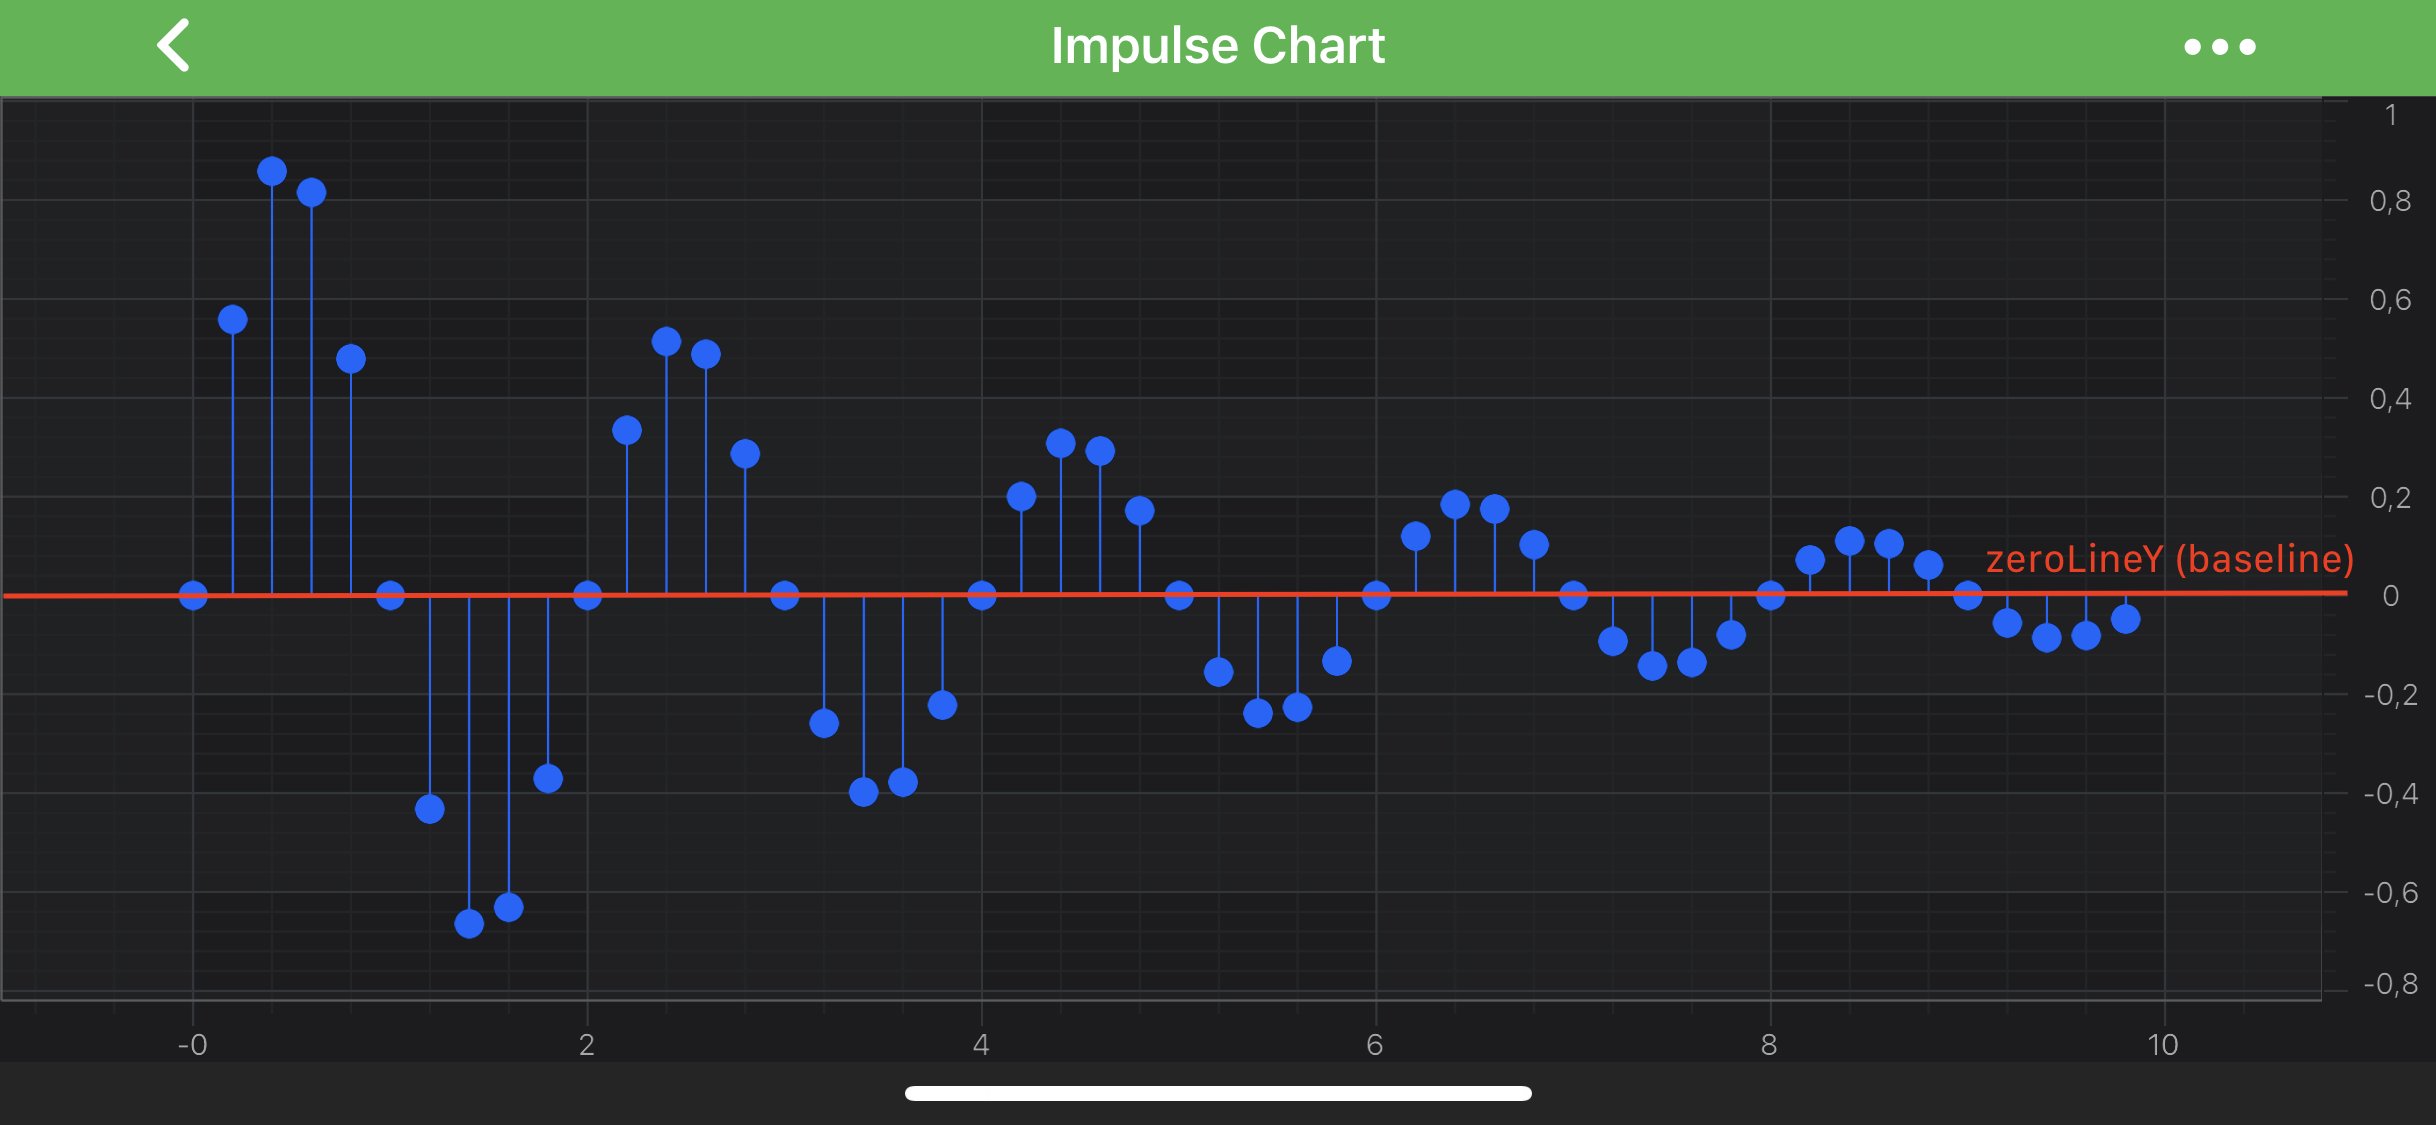
Similarly to the FastColumnRenderableSeries type, it is possible to specify the baseline position for series' bars via the zeroLineY property. All data points that have Y value less than ZeroLineY (baseline) will be drawn downwards, else - upwards:
Finally, the stem color can be changed via the strokeStyle property.
Note
To learn more about Pens and Brushes and how to utilize them, please refer to the PenStyle, BrushStyle and FontStyle article.
Note
In multi axis scenarios, a series has to be assigned to particular X and Y axes. This can be done passing the axes IDs to the xAxisId, yAxisId properties.
Create an Impulse Series
To create an Impulse Series, use the following code:
@Override
protected void initExample(@NonNull SciChartSurface surface) {
    final IXyDataSeries<Double, Double> dataSeries = new XyDataSeries<>(Double.class, Double.class);
    dataSeries.append(0.0, -3.0);
    dataSeries.append(1.0, 1.0);
    dataSeries.append(2.0, 4.0);

    final EllipsePointMarker pointMarker = new EllipsePointMarker();

    pointMarker.setFillStyle(new SolidBrushStyle(Color.CYAN));
    pointMarker.setSize(20,20);

    final FastImpulseRenderableSeries impulseSeries = new FastImpulseRenderableSeries();

    impulseSeries.setDataSeries(dataSeries);
    impulseSeries.setStrokeStyle(new SolidPenStyle(Color.RED, true, 1f, null));
    impulseSeries.setPointMarker(pointMarker);

    UpdateSuspender.using(surface, () -> {
        Collections.addAll(surface.getXAxes(), new NumericAxis(requireContext()));
        Collections.addAll(surface.getYAxes(), new NumericAxis(requireContext()));

        Collections.addAll(surface.getRenderableSeries(), impulseSeries);
    });
}
The result should be:
Impulse Series Features
Impulse Series also has some features similar to other series, such as:
Render a Gap in a Impulse Series
It's possible to render a Gap in an Impulse series, by passing a data point with a NaN as the Y value. Please refer to the RenderableSeries APIs article for more details.
Specify Color for Individual Bars
In SciChart, you can draw each bar of the Impulse Series with different colors using the PaletteProvider API. To Use palette provider for Impulse Series - a custom IFillPaletteProvider (or IStrokePaletteProvider) has to be provided to the paletteProvider property. Please refer to the PaletteProvider API article for more info.