The BoxAnnotation
The BoxAnnotation draws a rectangle at specific X1, X2, Y1, Y2 coordinates:
Note
Examples of the Annotations usage can be found in the SciChart Android Examples Suite as well as on GitHub:
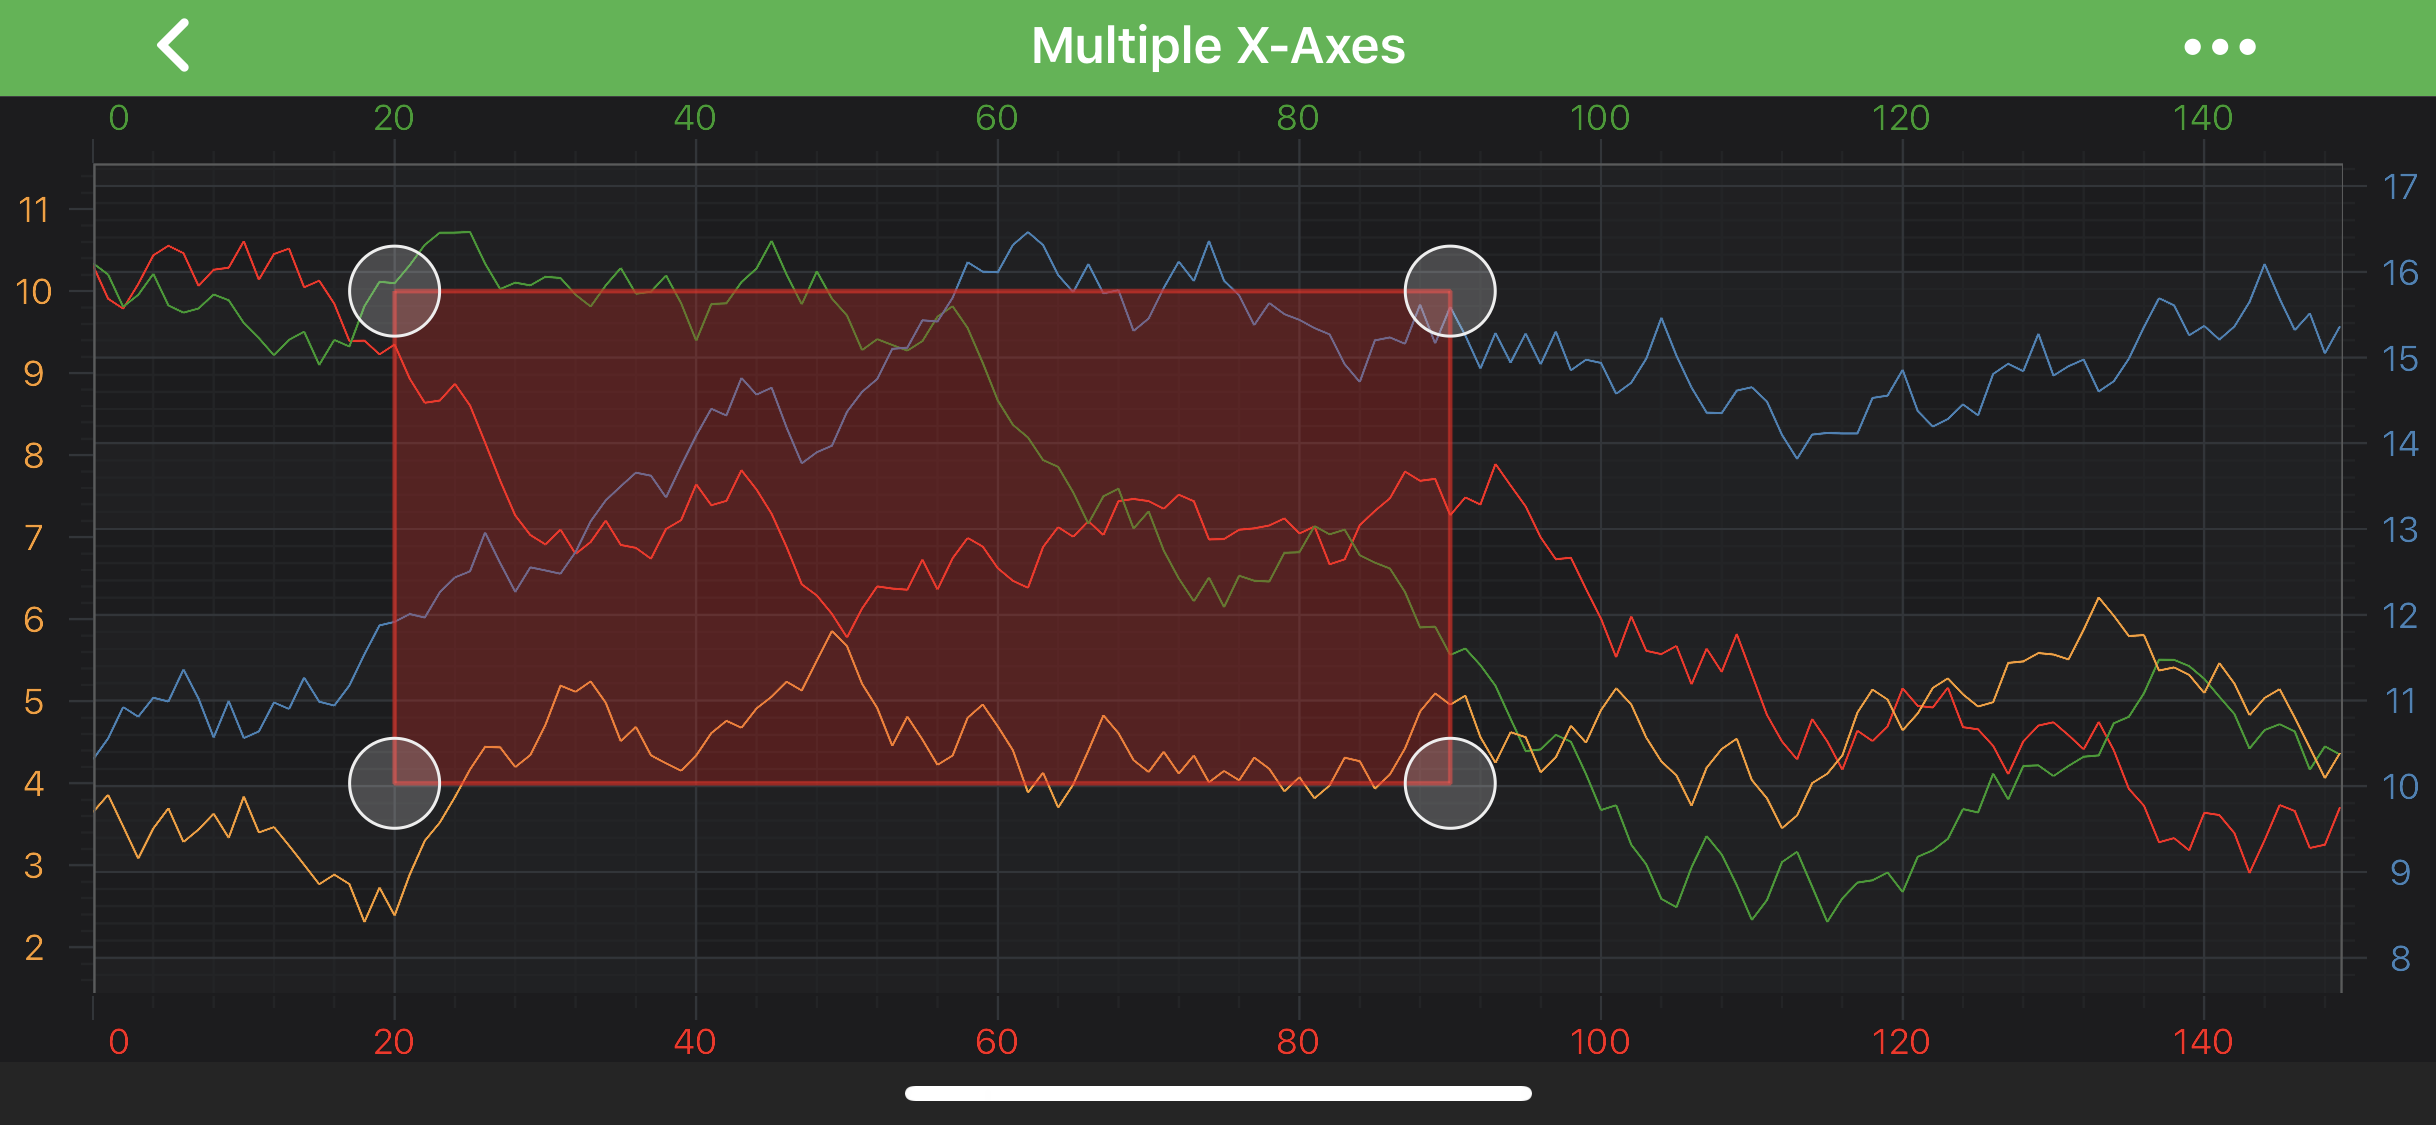
A BoxAnnotation is placed on a chart at the position determined by its [X1, Y1] and [X2, Y2] coordinates, which correspond to the top-left and bottom-right corners of the drawn rectangle.
Those can be accessed via the following properties: x1, y1, x2, y2
Note
The xAxisId and yAxisId must be supplied if you have axis with non-default Axis Ids, e.g. in multi-axis scenario.
Create a BoxAnnotation
A BoxAnnotation can be added onto a chart using the following code:
// Assume a surface has been created and configured somewhere
// Create a BoxAnnotation
final BoxAnnotation boxAnnotation = new BoxAnnotation(getContext());

// Allow to interact with the annotation in run-time
boxAnnotation.setIsEditable(true);

// in a multi-axis scenario, specify the XAxisId and YAxisId
boxAnnotation.setXAxisId("TopAxisId");
boxAnnotation.setYAxisId("LeftAxisId");

// Specify a desired position by setting coordinates
boxAnnotation.setX(20.0f);
boxAnnotation.setY1(10.0f);
boxAnnotation.setX2(90.0f);
boxAnnotation.setY2(4.0f);

// Specify the background resource
boxAnnotation.setBackgroundResource(R.drawable.example_box_annotation_background);

// Add the annotation to the AnnotationsCollection of a surface
surface.getAnnotations().add(boxAnnotation);
Note
To learn more about other Annotation Types, available out of the box in SciChart, please find the comprehensive list in the Annotation APIs article.