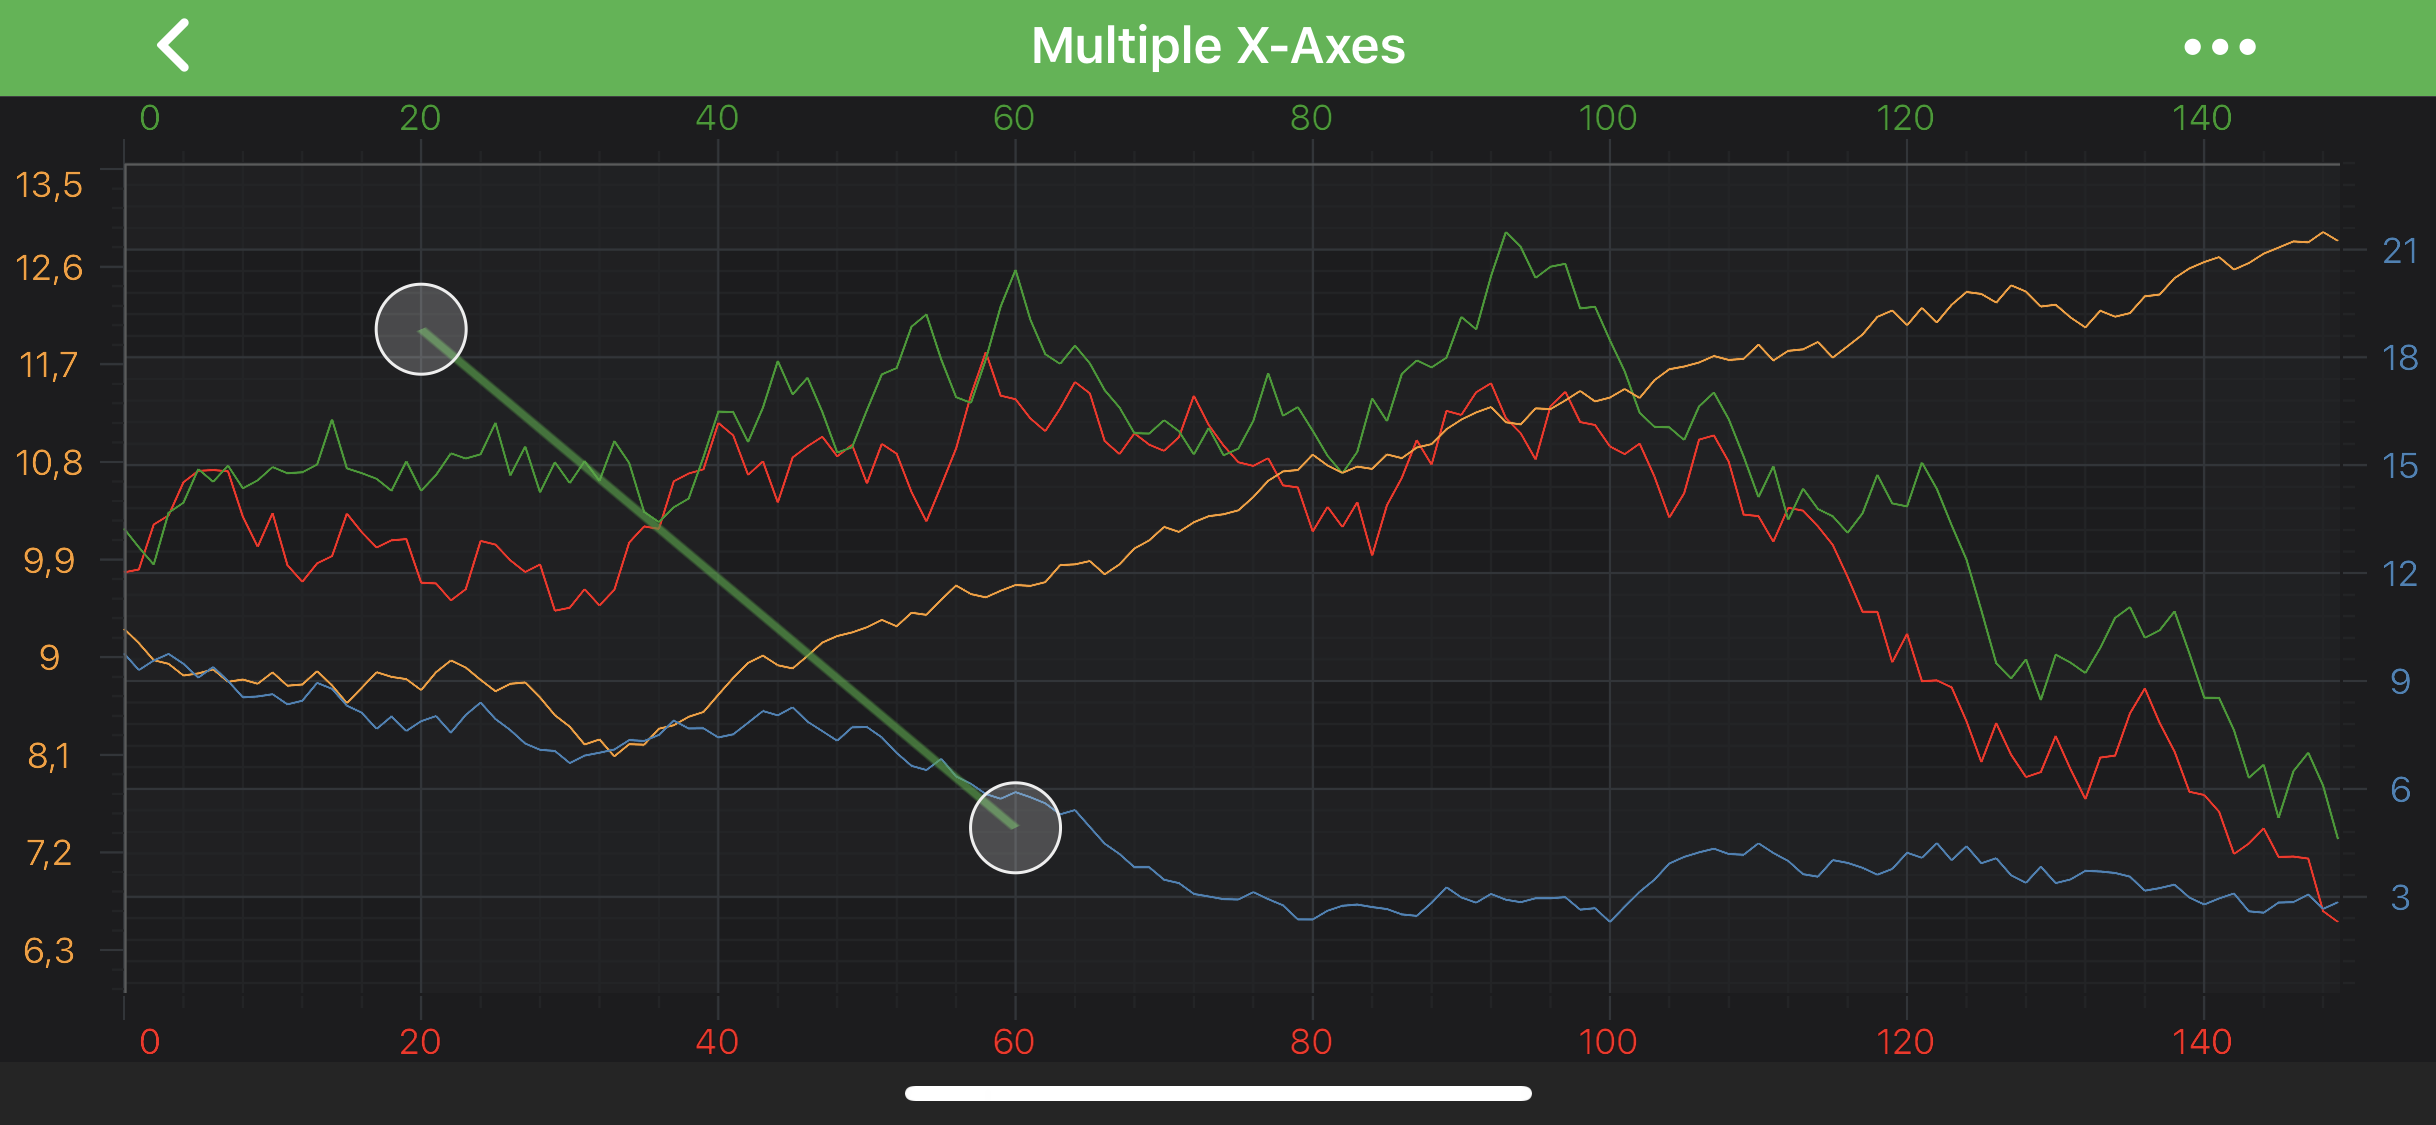
The LineAnnotation
The LineAnnotation draws a line connecting the [X1, X2] and [Y1, Y2] coordinates:
Note
Examples of the Annotations usage can be found in the SciChart Android Examples Suite as well as on GitHub:
The LineAnnotation class provides the stroke property which is used to define the line annotation color. It expects a PenStyle object. To learn more about Pens and Brushes and how to utilize them, please refer to the PenStyle, BrushStyle and FontStyle article.
Note
To learn more about Annotations in general - please see the Common Annotation Features article.
A LineAnnotation is placed on a chart at the position determined by its [X1, Y1] and [X2, Y2] coordinates, which specifies the two line ends.
Those can be accessed via the following properties: x1, y1, x2, y2
Note
The xAxisId and yAxisId must be supplied if you have an axis with non-default Axis Ids, e.g. in multi-axis scenario.
Create a LineAnnotation
A LineAnnotation can be added onto a chart using the following code:
// Assume a surface has been created and configured somewhere
// Create a Line Annotation
final LineAnnotation lineAnnotation = new LineAnnotation(getContext());

// Allow to interact with the annotation in run-time
lineAnnotation.setIsEditable(true);

// In a multi-axis scenario, specify the XAxisId and YAxisId
lineAnnotation.setXAxisId("TopAxisId");
lineAnnotation.setYAxisId("LeftAxisId");

// Specify a desired position by setting coordinates
lineAnnotation.setCoordinateMode(AnnotationCoordinateMode.RelativeY);
lineAnnotation.setX1(20);
lineAnnotation.setY1(0.2);
lineAnnotation.setX2(60);
lineAnnotation.setY2(0.8);

// Specify the stroke color for the annotation
lineAnnotation.setStroke(new SolidPenStyle(0x9942AD42, true, 4f, null));

// Add the annotation to the Annotations collection of the surface
surface.getAnnotations().add(lineAnnotation);
Note
To learn more about other Annotation Types, available out of the box in SciChart, please find the comprehensive list in the Annotation APIs article.